. 2017 Mar 27;13(3):e1006684.
doi: 10.1371/journal.pgen.1006684. eCollection 2017 Mar.

Aberrant neuronal activity-induced signaling and gene expression in a mouse model of RASopathy

Affiliations

Aberrant neuronal activity-induced signaling and gene expression in a mouse model of RASopathy

Franziska Altmüller et al. PLoS Genet. .

Erratum in

Abstract

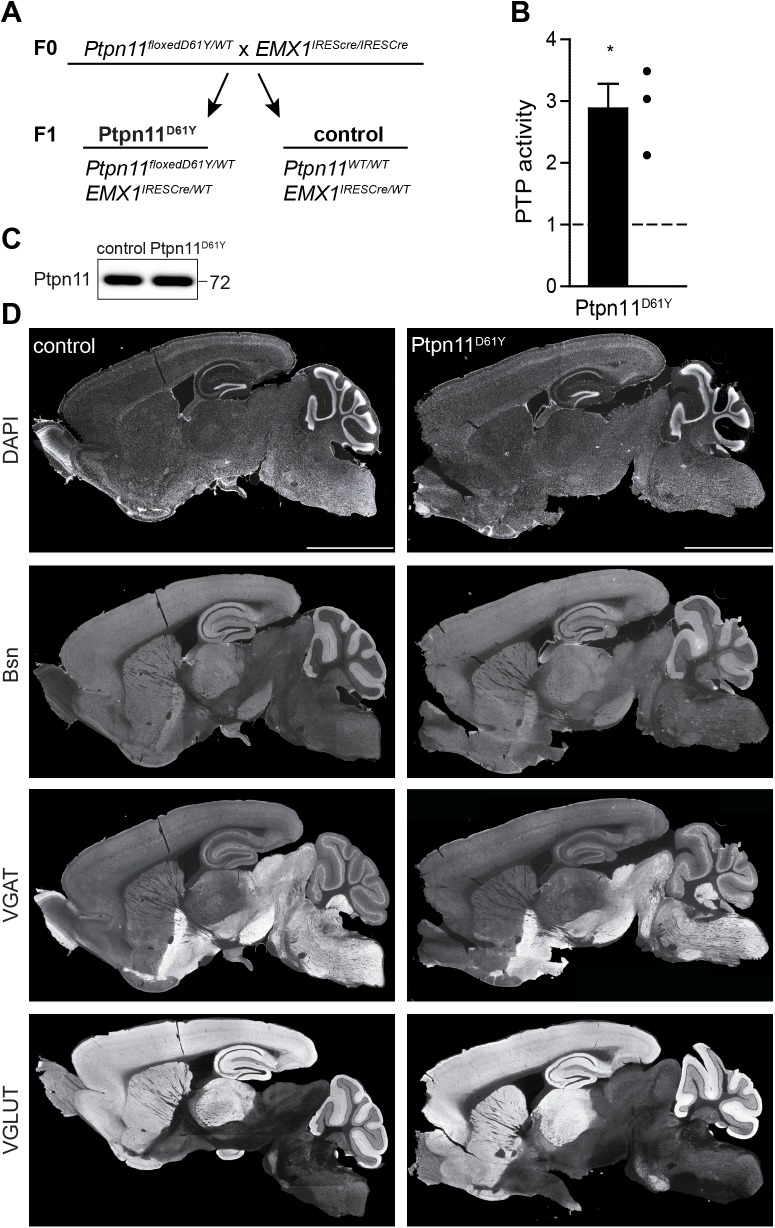
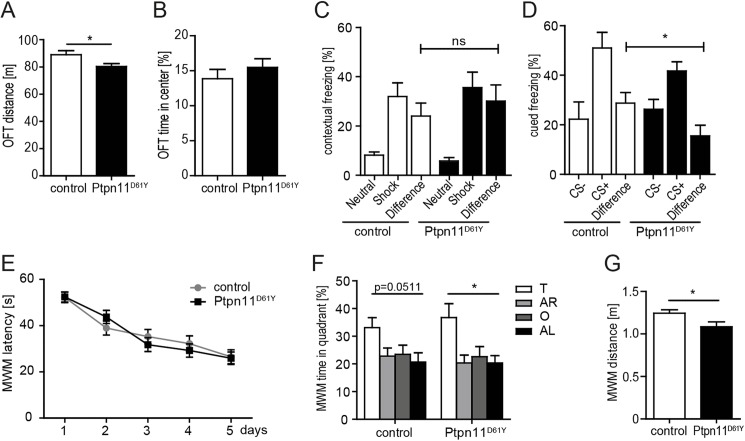
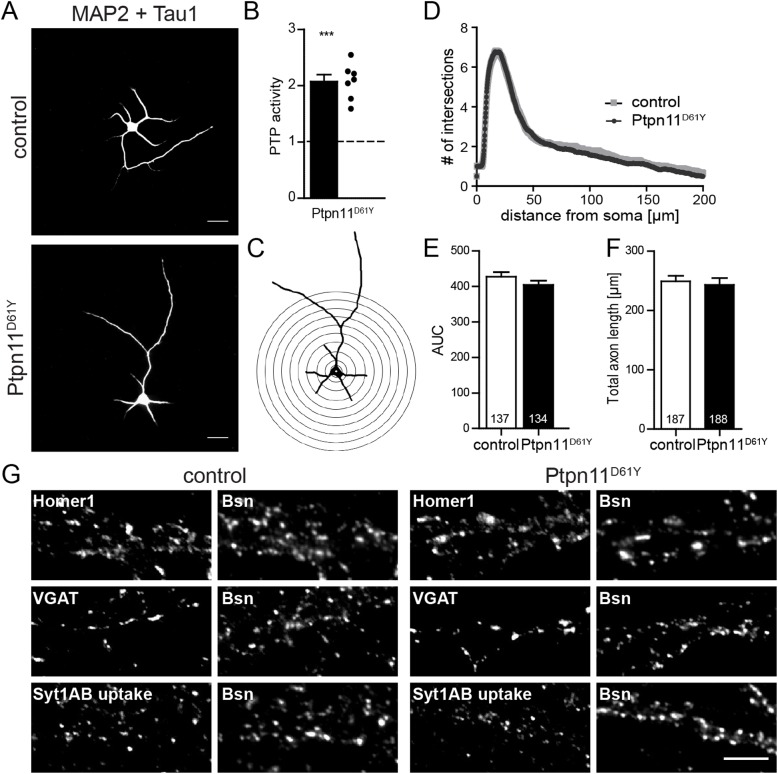
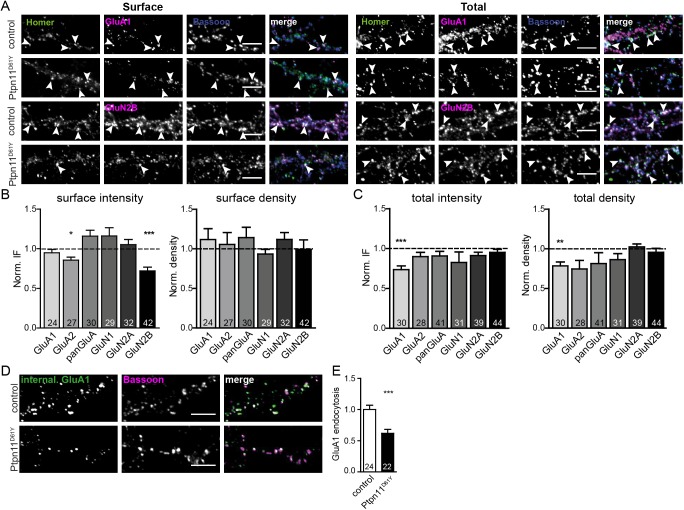
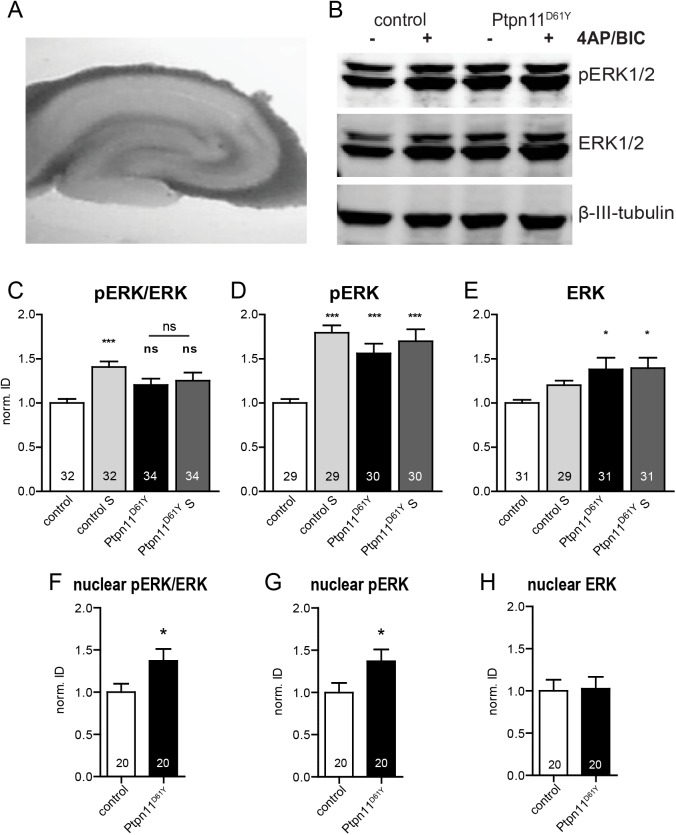
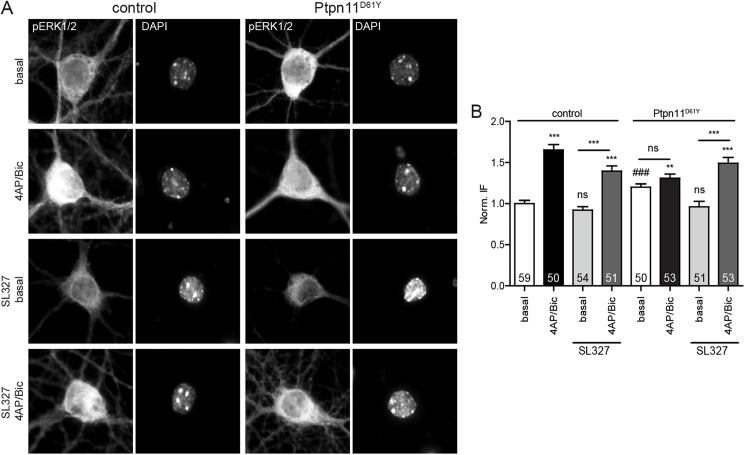
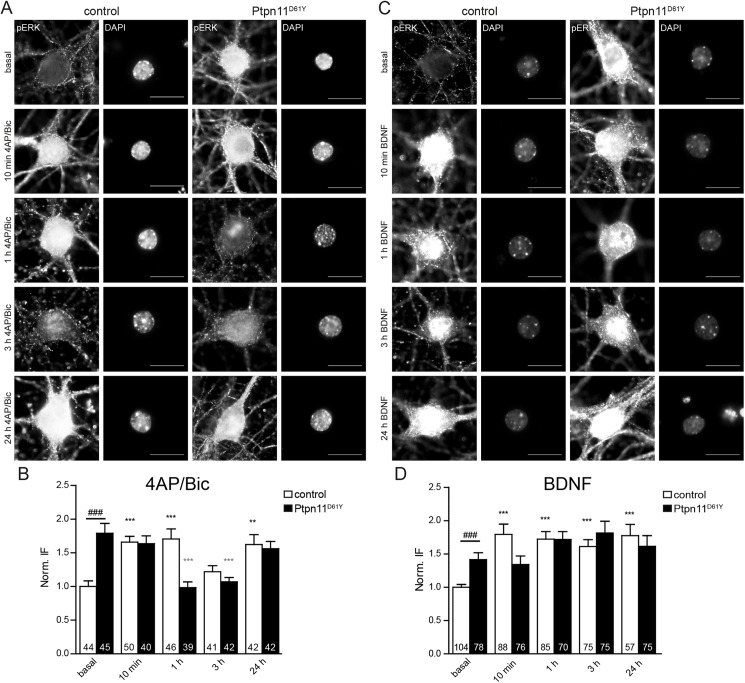
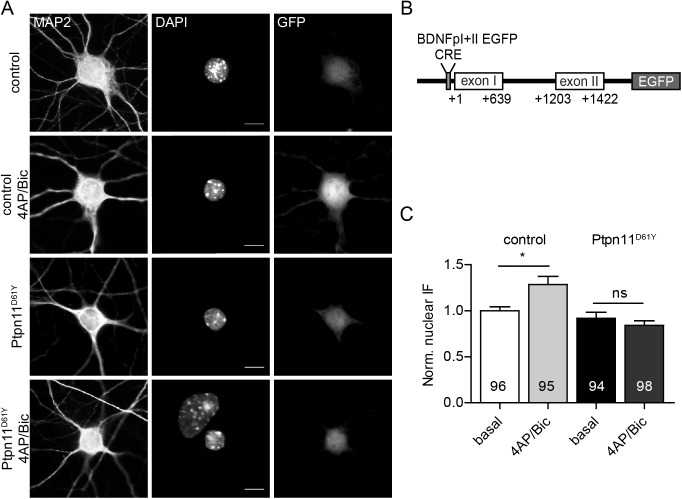
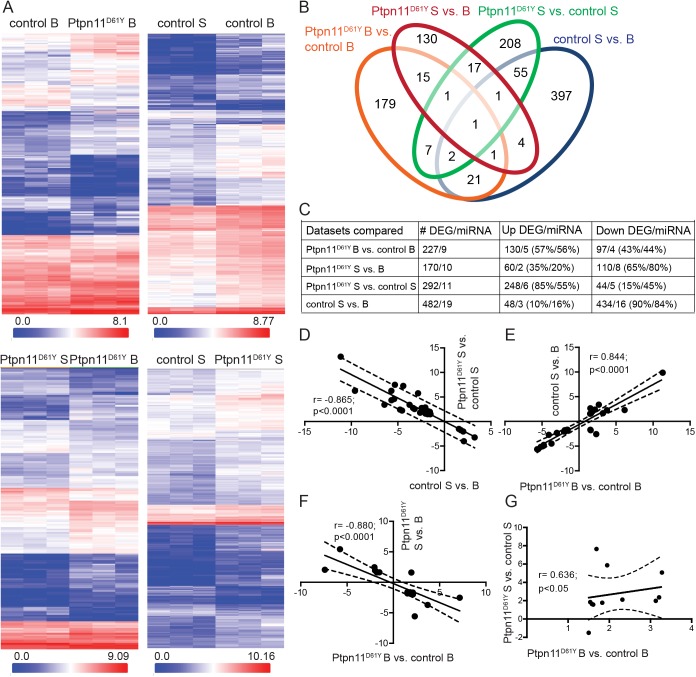
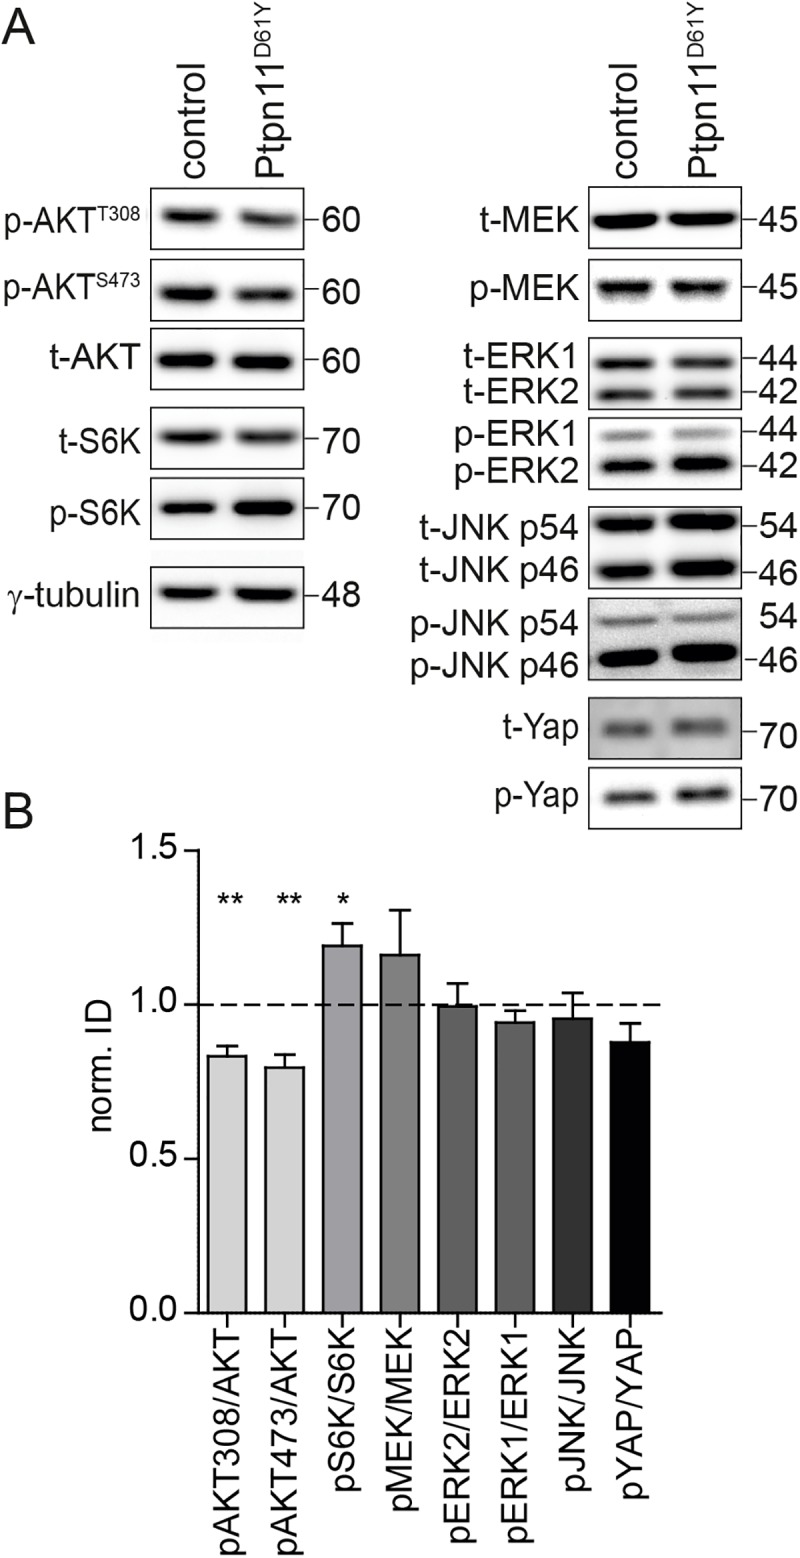
Noonan syndrome (NS) is characterized by reduced growth, craniofacial abnormalities, congenital heart defects, and variable cognitive deficits. NS belongs to the RASopathies, genetic conditions linked to mutations in components and regulators of the Ras signaling pathway. Approximately 50% of NS cases are caused by mutations in PTPN11. However, the molecular mechanisms underlying cognitive impairments in NS patients are still poorly understood. Here, we report the generation and characterization of a new conditional mouse strain that expresses the overactive Ptpn11D61Y allele only in the forebrain. Unlike mice with a global expression of this mutation, this strain is viable and without severe systemic phenotype, but shows lower exploratory activity and reduced memory specificity, which is in line with a causal role of disturbed neuronal Ptpn11 signaling in the development of NS-linked cognitive deficits. To explore the underlying mechanisms we investigated the neuronal activity-regulated Ras signaling in brains and neuronal cultures derived from this model. We observed an altered surface expression and trafficking of synaptic glutamate receptors, which are crucial for hippocampal neuronal plasticity. Furthermore, we show that the neuronal activity-induced ERK signaling, as well as the consecutive regulation of gene expression are strongly perturbed. Microarray-based hippocampal gene expression profiling revealed profound differences in the basal state and upon stimulation of neuronal activity. The neuronal activity-dependent gene regulation was strongly attenuated in Ptpn11D61Y neurons. In silico analysis of functional networks revealed changes in the cellular signaling beyond the dysregulation of Ras/MAPK signaling that is nearly exclusively discussed in the context of NS at present. Importantly, changes in PI3K/AKT/mTOR and JAK/STAT signaling were experimentally confirmed. In summary, this study uncovers aberrant neuronal activity-induced signaling and regulation of gene expression in Ptpn11D61Y mice and suggests that these deficits contribute to the pathophysiology of cognitive impairments in NS.


Conflict of interest statement

The authors have declared that no competing interests exist.

Figures

Fig 1
Fig 1. Establishment of Ptpn11D61Y mouse strain.
(A) Breeding scheme showing genotypes of parental (F0) and offspring (F1) generation. Progeny segregated in 2 genotypes used as mutants (Ptpn11D61Y) and controls (control) in all experiments. (B) Ptpn11-specific PTP activity was 3-fold higher in Ptpn11D61Y forebrain homogenate as compared to controls. Data are shown as normalized mean ± SEM and analyzed using one sample t-test, *p<0.05. Dots indicate the values of 3 Ptpn11D61Y animals. (C) The expression of Ptpn11 is not altered in the forebrain of Ptpn11D61Y mice. (D) The overall brain morphology is not affected in Ptpn11D61Y animals. Sagittal sections of brains from control and Ptpn11D61Y mice were stained with antibodies against Bsn, VGAT, and VGLUT and with DAPI. Scale bar: 3.5 mm.
Fig 2
Fig 2. Ptpn11D61Y animals show reduced exploratory activity and mild impairment of memory specificity.
(A) Ptpn11D61Y animals show a reduced run distance in the OFT. (B) The time spent in the center of field did not differ in the OFT. (C) Ptpn11D61Y animals display normal levels of contextual fear memory. (D) In cued fear conditioning the differentiation of CS+ and CS- was reduced in the mutants compared to controls. (E, F) In the MWM, the escape latency during training (E) as well as the time spent in the target quadrant (T) in the first probe trial (F) are comparable between the genotypes indicating normal spatial memory in Ptpn11D61Y (AR, adjacent right; O, opposite; AL adjacent left quadrant). (G) Ptpn11D61Y animals swam shorter distances in the probe trial. Data are shown as mean ± SEM analyzed using unpaired t-test, one-way ANOVA or two-way repeated measures ANOVA (n = 10–12; *p<0.05).
Fig 3
Fig 3. Morphometric analysis of Ptpn11D61Y neurons.
(A) DIV5 neurons were stained with antibodies against the dendritic marker MAP2 and the axonal marker Tau1 for the assessment of dendritic arborization and axonal outgrowth. Scale bar: 50 μm. (B) The Ptpn11-specific PTP activity showed a 2-fold increase in cultured cortical Ptpn11D61Y neurons compared to controls. The points indicate the values from cultures derived from individual animals. (C) Example image of a neuron from (A) after binarization and placement of the array of concentric circles used for Sholl analysis. (D) Sholl analysis of DIV5 neurons is shown, where the number of ramifications is plotted against the distance from the soma. (E, F) The area under the curve (AUC) in Sholl analysis (E) and the axonal length (F) do not differ between control and Ptpn11D61Y neurons. (G) Immunostaining of excitatory (positive for Homer1), inhibitory (positive for VGAT) and active (showing the syt1AB uptake) synapses in DIV14 neurons from control and Ptpn11D61Y. Scale bar: 5 μm. Data are presented as mean ± SEM and analyzed using unpaired t-test. The numbers in columns indicate the number of cells analyzed.
Fig 4
Fig 4. Synaptic expression and surface trafficking of glutamate receptors is affected in Ptpn11D61Y.
(A) Representative examples of the staining of synaptic surface (left) and total (right) glutamate receptors containing GluA1 or GluN2B subunit in neurons from control and from Ptpn11D61Y. Excitatory synapses were stained for Homer1 and Bassoon. (B, C) Synaptic IF intensity and density (puncta per 20 μm of proximal dendrite) of surface (B) and total (C) staining for all tested receptor subunits are shown. Values are normalized to the respective value in control, represented by the dashed line in the graphs. Note the reduced surface expression of GluA2 and GluN2B and the decrease of the overall expression of GluA1 in Ptpn11D61Y neurons as compared to controls. All numerical values and statistics are listed in S1 Table. (D, E) The rate of internalization of the GluA1-containing AMPARs is reduced in Ptpn11D61Y cells. Scale bars: 5 μm. Data are presented as mean ± SEM and analyzed using unpaired t-test (*p≤0.05, **p≤0.01, ***p≤0.001). Numbers in columns indicate the number of cells analyzed.
Fig 5
Fig 5. Neuronal activity-induced phosphorylation of ERK is disturbed in Ptpn11D61Y.
(A) Exemplary photograph of an acute slice used for experiments. (B) Western blot of lysates from control and Ptpn11D61Y acute slices treated with 4AP/Bic (+) or vehicle (-) for 10 minutes and probed with antibodies against pERK, ERK and β-III-tubulin. The latter was used as a loading control. (C-E) Quantification of the Western blot experiment as exemplified in B is shown. The stimulation of control slices led to a significant increase of the pERK level (C, D). The basal pERK level was increased in Ptpn11D61Y slices compared to controls. No further increase of pERK immunoreactivity could be detected upon stimulation of neuronal activity (C, D). Note the increased total expression of ERK in the slices from Ptpn11D61Y in the basal state and upon stimulation (E). (F-H) The quantification of ERK phosphorylation in the nuclear fraction prepared from forebrains indicates an increase in the pERK level in the samples from Ptpn11D61Y animals as compared to controls. Data are shown as mean ± SEM and analyzed using either one-way ANOVA followed by Bonferroni´s multiple comparison test or unpaired t-test (*p≤0.05, ***p≤0.001). The number of replicates from a total of three independent experiments is indicated in the columns of the graph.
Fig 6
Fig 6. Activity-induced increase of pERK is abolished in Ptpn11D61Y neurons and can be restored upon MEK1 inhibition.
Staining (A) and quantification (B) of pERK in nuclei (marked by DAPI) of excitatory neurons revealed elevated basal nuclear pERK levels in Ptpn11D61Y neurons. The basal levels of nuclear pERK significantly differ between the genotypes (unpaired t-test, ###p≤0.001). The stimulation of neuronal activity induces a rapid increase in the nuclear pERK level (in relation to the basal levels) in control neurons but not in those from Ptpn11D61Y mice. The inhibition of MEK1 using SL327 for 24 h prior to the stimulation normalized the elevated basal pERK in nuclei of Ptpn11D61Y neurons and fully restored the activity-induced increase of nuclear pERK. The identical treatment affected neither the basal nuclear pERK levels nor their stimulation-induced increase in control neurons. Data are presented as mean ± SEM; numbers in columns indicate the numbers of analyzed cells. Significance is assessed using unpaired t-test and one-way ANOVA followed by Bonferroni´s multiple comparison test (**p≤0.01, ***p≤0.001).
Fig 7
Fig 7. Time course of nuclear pERK accumulation induced by neuronal activity or BDNF is affected in Ptpn11D61Y neurons.
(A, C) Neurons of both genotypes are stained for pERK at different time points upon 4AP/Bic (A) or BDNF (C) application. DAPI staining was used as nuclear mask. Scale bar: 10 μm. (B, D) Quantification of the nuclear pERK level as exemplified in the staining in A and C. The basal levels of nuclear pERK significantly differ between the genotypes (unpaired t-test, ### p≤0.001). The time course upon stimulation by both stimuli differed between Ptpn11D61Y and control neurons. Data are shown as mean ± SEM and numbers in columns of graphs indicate number of analyzed cells. The stimulation-induced changes were compared to basal pERK levels in each genotype and significance was assessed using one-way ANOVA and Dunnett´s multiple comparison test (**p≤0.01 and ***p≤0.001) and shown in black for controls and in gray for Ptpn11D61Y neurons.
Fig 8
Fig 8. Activity-induced BDNF expression is affected in Ptpn11D61Y neurons.
(A) Representative images of neurons in low-density cultures infected with the lentivirus containing the BDNFpI+II EGFP reporter in basal conditions and upon treatment with 4AP/Bic for 30 min. Neurons are stained with antibodies against GFP to enhance the intrinsic EGFP signal, MAP2 as a neuronal marker, and DAPI. (B) Schema of the activity reporter, in which the BDNF promoters I and II drive the expression of EGFP. The cAMP response element (CRE) is depicted. (C) Quantification of the GFP IF that was measured in the nuclei of control and Ptpn11D61Y neurons. The reporter signal increased significantly upon stimulation in control but not in Ptpn11D61Y neurons. Data are shown as mean ± SEM and analyzed using one-way ANOVA followed by Bonferroni´s multiple comparison test (*p≤0.05) Scale bar: 10 μm.
Fig 9
Fig 9. Analysis of DEGs in hippocampi of control and Ptpn11D61Y mice in the basal state and after the stimulation of neuronal activity.
(A) The heat maps show the expression levels of DEG transcripts for each analyzed dataset. Three biological replicates (columns) per condition are shown for all DEGs (rows). The color code in a logarithmic scale is given for the signal intensities of the DEGs and indicates a low (in blue) or high (red) expression. (B) The Venn diagram shows the number of DEGs in each dataset. The intersections indicate the number of genes regulated in two or more datasets. (C) The table shows the number of differentially expressed mRNAs and miRNAs as well as the direction of their regulation in each dataset. (D-F) Plots show the inter-dependency of the expressional regulations of the DEGs that are commonly regulated between the datasets. Each data point represents one DEG; the x- and y-axis indicate the level of regulation as fold change in a logarithmic scale in the dataset. The correlation coefficient (r) and p-value are indicated in the graphs. The black lines show the best fits; the dashed lines indicate the 95% confidence intervals.
Fig 10
Fig 10. The PI3K-AKT signaling is altered in Ptpn11D61Y brains.
(A) Representative Western blots of forebrain homogenate from control and Ptpn11D61Y mice. The phosphorylation level of AKT at the residues Thr308 and Ser473 are reduced, while the phosphorylation of S6K is increased. See S8 Fig for representative images of all proteins analyzed. (B) Quantification of the Western blots exemplified in A. Data is shown as mean ± SEM and normalized to the expression in controls (n = 3 animals per genotype, unpaired t-test; *p<0.05; **, p<0.01).

References

    1. Tartaglia M, Zampino G, Gelb BD (2010) Noonan syndrome: clinical aspects and molecular pathogenesis. Mol Syndromol 1: 2–26. 10.1159/000276766 - DOI - PMC - PubMed
    1. Zenker M (2011) Clinical manifestations of mutations in RAS and related intracellular signal transduction factors. Curr Opin Pediatr 23: 443–451. 10.1097/MOP.0b013e32834881dd - DOI - PubMed
    1. Tajan M, de Rocca Serra A, Valet P, Edouard T, Yart A (2015) SHP2 sails from physiology to pathology. Eur J Med Genet 58: 509–525. 10.1016/j.ejmg.2015.08.005 - DOI - PubMed
    1. Cleghon V, Feldmann P, Ghiglione C, Copeland TD, Perrimon N, et al. (1998) Opposing actions of CSW and RasGAP modulate the strength of Torso RTK signaling in the Drosophila terminal pathway. Mol Cell 2: 719–727. - PubMed
    1. Bennett AM, Tang TL, Sugimoto S, Walsh CT, Neel BG (1994) Protein-tyrosine-phosphatase SHPTP2 couples platelet-derived growth factor receptor beta to Ras. Proc Natl Acad Sci U S A 91: 7335–7339. - PMC - PubMed

Publication types

MeSH terms

Substances