Characteristics of seasonal influenza A and B in Latin America: Influenza surveillance data from ten countries
- PMID: 28346498
- PMCID: PMC5367818
- DOI: 10.1371/journal.pone.0174592
Characteristics of seasonal influenza A and B in Latin America: Influenza surveillance data from ten countries
Abstract
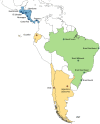
Introduction: The increased availability of influenza surveillance data in recent years justifies an actual and more complete overview of influenza epidemiology in Latin America. We compared the influenza surveillance systems and assessed the epidemiology of influenza A and B, including the spatio-temporal patterns of influenza epidemics, in ten countries and sub-national regions in Latin America.
Methods: We aggregated the data by year and country and characteristics of eighty-two years were analysed. We calculated the median proportion of laboratory-confirmed influenza cases caused by each virus strain, and compared the timing and amplitude of the primary and secondary peaks between countries.
Results: 37,087 influenza cases were reported during 2004-2012. Influenza A and B accounted for a median of 79% and, respectively, 21% of cases in a year. The percentage of influenza A cases that were subtyped was 82.5%; for influenza B, 15.6% of cases were characterized. Influenza A and B were dominant in seventy-five (91%) and seven (9%) years, respectively. In half (51%) of the influenza A years, influenza A(H3N2) was dominant, followed by influenza A(H1N1)pdm2009 (41%) and pre-pandemic A(H1N1) (8%). The primary peak of influenza activity was in June-September in temperate climate countries, with little or no secondary peak. Tropical climate countries had smaller primary peaks taking place in different months and frequently detectable secondary peaks.
Conclusions: We found that good influenza surveillance data exists in Latin America, although improvements can still be made (e.g. a better characterization of influenza B specimens); that influenza B plays a considerable role in the seasonal influenza burden; and that there is substantial heterogeneity of spatio-temporal patterns of influenza epidemics. To improve the effectiveness of influenza control measures in Latin America, tropical climate countries may need to develop innovative prevention strategies specifically tailored to the spatio-temporal patterns of influenza in this region.
Conflict of interest statement
Figures


References
-
- The Acute Respiratory Infections Atlas. First Edition. http://www.ariatlas.org/understanding_aris/influenza. Accessed on August 20th, 2014.
MeSH terms
LinkOut - more resources
Full Text Sources
Other Literature Sources
Medical

