. 2017 Mar 27;12(3):e0174124.
doi: 10.1371/journal.pone.0174124. eCollection 2017.

Specific expression of novel long non-coding RNAs in high-hyperdiploid childhood acute lymphoblastic leukemia

Affiliations

Specific expression of novel long non-coding RNAs in high-hyperdiploid childhood acute lymphoblastic leukemia

Mathieu Lajoie et al. PLoS One. .

Abstract

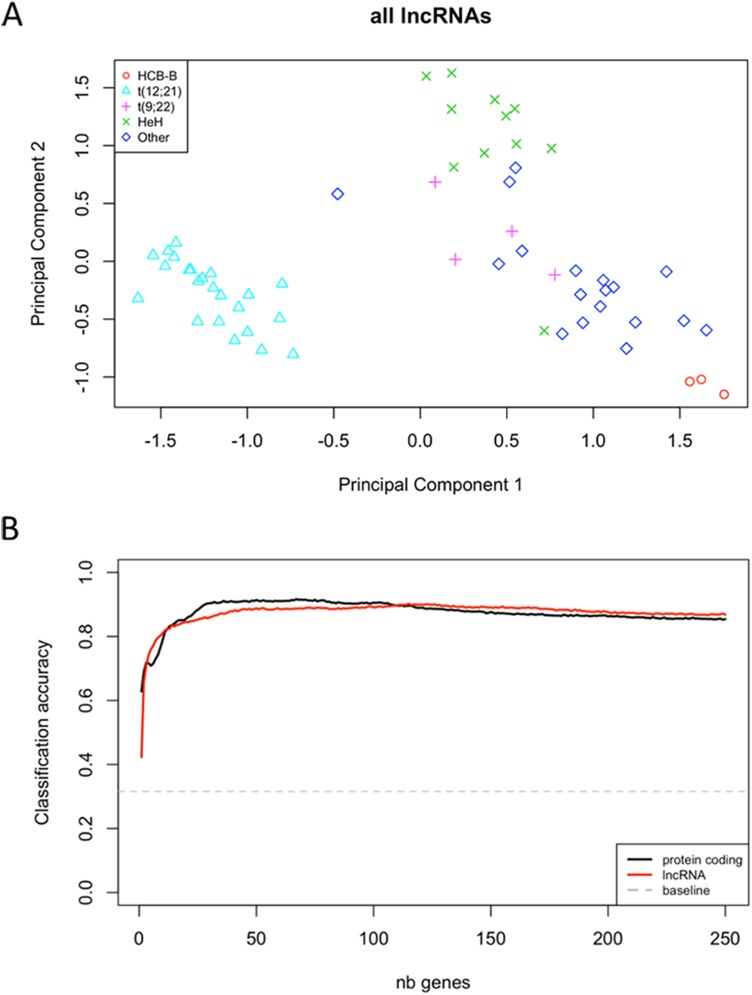
Pre-B cell childhood acute lymphoblastic leukemia (pre-B cALL) is a heterogeneous disease involving many subtypes typically stratified using a combination of cytogenetic and molecular-based assays. These methods, although widely used, rely on the presence of known chromosomal translocations, which is a limiting factor. There is therefore a need for robust, sensitive, and specific molecular biomarkers unaffected by such limitations that would allow better risk stratification and consequently better clinical outcome. In this study we performed a transcriptome analysis of 56 pre-B cALL patients to identify expression signatures in different subtypes. In both protein-coding and long non-coding RNAs (lncRNA), we identified subtype-specific gene signatures distinguishing pre-B cALL subtypes, particularly in t(12;21) and hyperdiploid cases. The genes up-regulated in pre-B cALL subtypes were enriched in bivalent chromatin marks in their promoters. LncRNAs is a new and under-studied class of transcripts. The subtype-specific nature of lncRNAs suggests they may be suitable clinical biomarkers to guide risk stratification and targeted therapies in pre-B cALL patients.


Conflict of interest statement

Competing Interests: The authors have declared that no competing interests exist.

Figures

Fig 1
Fig 1. Comparison of differentially expressed genes in our RNA-seq and public dataset.
(A) Overlap between differentially expressed genes identified from microarray data (Lee et al.) and RNA-seq for the HeH versus t(12;21) comparison. The intersection of 200 genes represents a 10-fold enrichment compared to the expected intersection (20) when DEGs are picked randomly. (B) Comparison of logFCs for DEGs identified in both the microarray and RNA-seq analysis. Pearson’s product-moment correlation between log2FCs = 0.844. Spearman’s rank correlation = 0.793. We note that expression changes are coherent (in the same direction) for all DEGs identified from both datasets
Fig 2
Fig 2. Multidimensional scaling plot of distances between gene expression profiles.
The distance between each pair of samples is the Euclidean distance between expression values (logCPM) of the 500 genes with the most variance across all samples. Samples with an unknown phenotype or belonging to a cALL subtype appearing less than four times in our cohort have been labelled as “Other”.
Fig 3
Fig 3. Accuracy of k-nearest neighbors (KNN) classification according to the number of considered top variances genes.
Each continuous line gives the fraction of tumor samples correctly classified by cALL subtype, averaged over 100 replicates. For each replicate, we sampled 50% from all genes and ordered them according to expression (logCPM) variance across samples. KNN (3-nearest neighbors) classification was then performed, considering Euclidean distance between samples based on an incremental number of genes (pseudogenes excluded). (A) Leave-one-out classification was performed using all tumor samples. (B) Under-sampling was performed so that four tumor samples from each subtype were used at each iteration. Dashed lines show the expected accuracies when predictions are made by random assignation of cALL subtype
Fig 4
Fig 4. Histone mark distribution with respect to dysregulation status in pre-B cALL.
(A) Relative peak coverage of H3K27me3 repressive mark. (B) Relative peak coverage of H3K4me3 activating mark. (C) Relative peak coverage of the H3K36me3 mark associated to active transcription. (D) Fraction of genes with H3K27me3 or both H3K27me3 and H3K4me3 (bivalency) near their TSS (-5kb to +5kb). Genes with an FDR<0.001 and a log2FC > 2 (or < -2) in all subtypes have been classified as up-regulated (or down-regulated). Genes not differentially expressed (not DE) include all genes with FDR>0.5. Only the most upstream TSS of each gene was considered. Histone peak data was obtained from ENCODE epigenome E031 [55].
Fig 5
Fig 5. ENCODE TF peak enrichment near TSS of dysregulated genes.
The y-axis corresponds to the minimal TF expression change observed among all subtypes. The x-axis corresponds to the peak enrichment ratio for genes that are up- or down-regulated in all subtypes. All TFs are represented as dots and text labels have been added when both expression change and (positive) peak enrichment are statistically significant (FDR < 0.1).
Fig 6
Fig 6. Expression distribution for core and accessory PRC2 subunits in our pre-B cALL cohort.
Gene expression box plots for (A) core and (B) accessory PCR2 subunits. Thick boxes comprise observations from the first to the third quartiles in each group. Observations farther than 1.5*IQR (inter-quartile range) from these boxes boundaries are represented as dots. Genes identified as dysregulated by the edgeR analysis (FDR<1e-3) are marked with an asterisk and associated FDR values specified underneath.
Fig 7
Fig 7. Correlation between median fold change (FC) and average copy number in the HeH group (R2 = 0.8).
The y-axis corresponds to the chromosome median fold-change between the HeH group and HCB controls. The x-axis corresponds to the chromosome mean copy number in the HeH group. To avoid division by very small quantities, we restricted this analysis to genes expressed at >30 counts per million (CPM) in both groups. Only autosomes were included in this analysis.
Fig 8
Fig 8. Effect of frequently gained chromosomes on inter-sample distances and KNN classification accuracy.
(A) MDS plot obtained with the 500 top variance genes including all autosomes. (B) MDS plot obtained with the 500 top variance genes that are not located on chromosomes frequently gained in HeH (chr 4,6,10,14,17,18 and 21). (C) Effect on classification accuracy. The y-axis corresponds to the fraction of HeH samples correctly classified, averaged over 100 replicates. For each replicate, we sampled 50% of available genes and ordered them according to expression variance across samples. 3-nearest-neighbors classification was then performed using an incremental number of genes and Euclidean distance between samples. The baseline accuracy corresponds to random assignment of tumor subtypes within the cohort.
Fig 9
Fig 9. Overall accuracy of 3-nearest-neighbors classification using an increasing number of top variance genes from different biotypes.
(A) Multidimensional scaling plot of distances between expression profiles only for lncRNAs. The distance between each pair of samples is the Euclidean distance between expression values (logCPM) of the 500 lncRNAs with the most variance across all samples. (B) K-nearest neighbors classification accuracy comparison between lncRNA and protein-coding transcripts. The y-axis corresponds to the fraction of samples correctly classified, averaged over 100 replicates. For each replicate, we sampled 50% of available genes and ordered them according to expression variance across samples. 3-nearest-neighbors classification was then performed using an incremental number of genes and Euclidean distance between samples. The baseline accuracy corresponds to random assignment of tumor subtypes within the cohort.

Similar articles

Cited by

References

    1. Mullighan CG (2012) Molecular genetics of B-precursor acute lymphoblastic leukemia. J Clin Invest 122: 3407–3415. 10.1172/JCI61203 - DOI - PMC - PubMed
    1. Woo JS, Alberti MO, Tirado CA (2014) Childhood B-acute lymphoblastic leukemia: a genetic update. Exp Hematol Oncol 3: 16 10.1186/2162-3619-3-16 - DOI - PMC - PubMed
    1. Kaneko Y, Hayashi Y, Sakurai M (1981) Chromosomal findings and their correlation to prognosis in acute lymphocytic leukemia. Cancer Genet Cytogenet 4: 227–235. - PubMed
    1. Paulsson K, Lilljebjorn H, Biloglav A, Olsson L, Rissler M, et al. (2015) The genomic landscape of high hyperdiploid childhood acute lymphoblastic leukemia. Nat Genet 47: 672–676. 10.1038/ng.3301 - DOI - PubMed
    1. Pui CH, Relling MV, Downing JR (2004) Acute lymphoblastic leukemia. N Engl J Med 350: 1535–1548. 10.1056/NEJMra023001 - DOI - PubMed

MeSH terms

Substances