Comparative Study
. 2017 May 2;56(17):2304-2314.
doi: 10.1021/acs.biochem.6b01066. Epub 2017 Apr 7.

Structure Determination of Mycobacterium tuberculosis Serine Protease Hip1 (Rv2224c)

Affiliations
Comparative Study

Structure Determination of Mycobacterium tuberculosis Serine Protease Hip1 (Rv2224c)

Jacqueline L Naffin-Olivos et al. Biochemistry. .

Abstract

The Mycobacterium tuberculosis (Mtb) serine protease Hip1 (hydrolase important for pathogenesis; Rv2224c) promotes tuberculosis (TB) pathogenesis by impairing host immune responses through proteolysis of a protein substrate, Mtb GroEL2. The cell surface localization of Hip1 and its immunomodulatory functions make Hip1 a good drug target for new adjunctive immune therapies for TB. Here, we report the crystal structure of Hip1 to a resolution of 2.6 Å and the kinetic studies of the enzyme against model substrates and the protein GroEL2. The structure shows a two-domain protein, one of which contains the catalytic residues that are the signature of a serine protease. Surprisingly, a threonine is located within the active site close enough to hydrogen bond with the catalytic residues Asp463 and His490. Mutation of this residue, Thr466, to alanine established its importance for function. Our studies provide insights into the structure of a member of a novel family of proteases. Knowledge of the Hip1 structure will aid in designing inhibitors that could block Hip1 activity.


Conflict of interest statement

Notes

The authors declare no competing financial interest.

Figures

Figure 1
Figure 1
Thermo-stability assay of Hip1 proteins. See Materials and Methods for assay conditions.
Figure 2
Figure 2
Protease activity of Hip1wt, Hip1SeMet, Hip1S228A, and Hip1T466A proteins observed using two different protein substrates, azocasein and GroEL2. (A) Bovine serum albumin (BSA) and protease Subtilisin Carlsberg were used as a negative and positive control, respectively. (B) The GroEL2-only sample contained no cleaved product; therefore, this band was set to 100% and used to normalize the samples containing Hip1 proteins. The graph represents the precentage of cleaved GroEl2 product formed.
Figure 3
Figure 3
Overall structure of the Hip1 monomer. (A) Ribbon diagram based on Cα’s of the final model. Helices are colored red, β-strands are yellow, and the loop regions are green. The catalytic residues, as well as the cysteine residues involved in the formation of disulfide bridges, are represented as sticks and are colored blue and black, respectively. Black arrows are used to indicate the five disulfide bridges. N and C termini are indicated. (B) Topology model based on structural assignments made according to DSSP. The diagram was first generated using PDBSUM, to determine the length of helices and then redrawn to depict a more accurate representation of the two domains. A solid black line is used to indicate a distinction between the two domains referred to as the α-domain and the α/β-domain. The same color scheme is used as that for the ribbon diagram in part A. The catalytic residues are denoted by the blue circles and are annotated. The N-terminus is on the left side, which is the same orientation relative to the ribbon diagram in part A.
Figure 4
Figure 4
Comparison of Hip1, F1, SPAP, and DPP2 structures. Ribbon diagrams are shown of Hip1, F1, SPAP, and DPP2 structures to compare the two domains of each protein with emphasis on the different α-domains, in particular, the insert in chain A of Hip1 shown in blue (residues inserted between β-strand 4 and α-helix 5 that form part of the α-domain). Also shown are the corresponding regions of F1 (residues Asp62–Pro72), SPAP (residues Asp70–Asn86), and DPP2 (residues Glu106-L129) colored in dark blue. For all proteins, helices are colored red, β-strands are yellow, the loop regions are green, and the catalytic residues, shown in stick representation, are dark blue. Arrows indicate the locations of the active site in each protein.
Figure 5
Figure 5
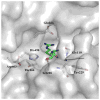
Surface diagram of the Hip1 model. The active site opening is indicated by an arrow. Catalytic triad residues are colored by element: carbon in yellow, oxygen in red, and nitrogen in blue. Also included is residue Thr466, which is in close proximity spatially to Asp463 and His490. Measurements of the distances (in Å) between potential interactions of the residues are also depicted.
Figure 6
Figure 6
Overlay of Hip1 with F1, XCPIP, and SPAP active sites. (A) Overlay of Hip1 and F1 catalytic residues. Hip1 residues are colored blue, F1 (active form) residues are green, and F1 (inactive form) residues are yellow. His490 and Ser228 of Hip1 align well with His271 and Ser105 of the active form of F1. Note the Ser105 of the inactive form is turned away from the His271 residue. Also, the His residue has moved slightly in the active form to align with the Ser. The position of the Asp244 residue of F1 does not change upon activation. However, Asp463 of Hip1 is slightly tilted out of line with His490; instead of being perpendicular (90° angle) such as with F1, it is approximately at a 60° angle. (B) Alignment of Hip1, XCPIP, and SPAP catalytic residues. Hip1 residues are colored blue, XCPIP residues are light blue, and SPAP residues are gray.
Figure 7
Figure 7
Kinetic studies of Hip1wt and Hip1T466A. (A) Time course comparing the proteolysis of GroEL2 protein by Hip1wt and Hip1T466A using a Western blot probed with S-tag antibody to observe only the GroEL2 protein. An arrow indicates the cleaved product formed upon addition of Hip1wt. (B) Representative graph of the hydrolysis of the substrate BApNA at 1 mM.
Figure 8
Figure 8
S1 pocket of Hip1 with a model of the Arg-Gly dipeptide. Surface diagram of Hip1 showing a model of the RG dipeptide in the active site of Hip1 based on an overlay of the Hip1 model and the model of F1 with a bound peptide. The RG dipeptide is colored by element: carbon in green, oxygen in red, and nitrogen in blue. Residues within the active site are represented as sticks and are colored by element: carbon in light gray, oxygen in red, and nitrogen in blue. The putative oxyanion hole is indicated by an arrow and comprises the backbone nitrogen of Tyr229 and Gly110. Residue Glu264, which is suspected to be part of the S1 pocket, is also indicated.

Similar articles

Cited by

References

    1. Global Tuberculosis Report 2015. World Health Organization (WHO); Geneva, Switzerland: 2015.
    1. Ehrt S, Schnappinger D. Mycobacterial survival strategies in the phagosome: defence against host stresses. Cell Microbiol. 2009;11:1170–1178. - PMC - PubMed
    1. Russell DG. Mycobacterium tuberculosis: here today, and here tomorrow. Nat Rev Mol Cell Biol. 2001;2:569–586. - PubMed
    1. Rengarajan J, Bloom BR, Rubin EJ. Genome-wide requirements for Mycobacterium tuberculosis adaptation and survival in macrophages. Proc Natl Acad Sci U S A. 2005;102:8327–8332. - PMC - PubMed
    1. Madan-Lala R, Peixoto KV, Re F, Rengarajan J. Mycobacterium tuberculosis Hip1 Dampens Macrophage Proinflammatory Responses by Limiting Toll-Like Receptor 2 Activation. Infect Immun. 2011;79:4828–4838. - PMC - PubMed

Publication types

MeSH terms

LinkOut - more resources