

Unraveling the complexity of transcriptomic, metabolomic and quality environmental response of tomato fruit
- PMID: 28347287
- PMCID: PMC5369198
- DOI: 10.1186/s12870-017-1008-4
Unraveling the complexity of transcriptomic, metabolomic and quality environmental response of tomato fruit
Abstract
Background: The environment has a profound influence on the organoleptic quality of tomato (Solanum lycopersicum) fruit, the extent of which depends on a well-regulated and dynamic interplay among genes, metabolites and sensorial attributes. We used a systems biology approach to elucidate the complex interacting mechanisms regulating the plasticity of sensorial traits. To investigate environmentally challenged transcriptomic and metabolomic remodeling and evaluate the organoleptic consequences of such variations we grown three tomato varieties, Heinz 1706, whose genome was sequenced as reference and two "local" ones, San Marzano and Vesuviano in two different locations of Campania region (Italy).
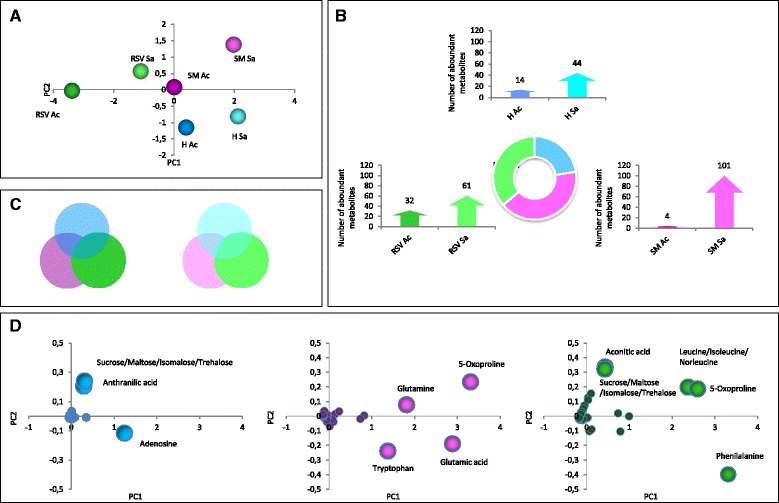
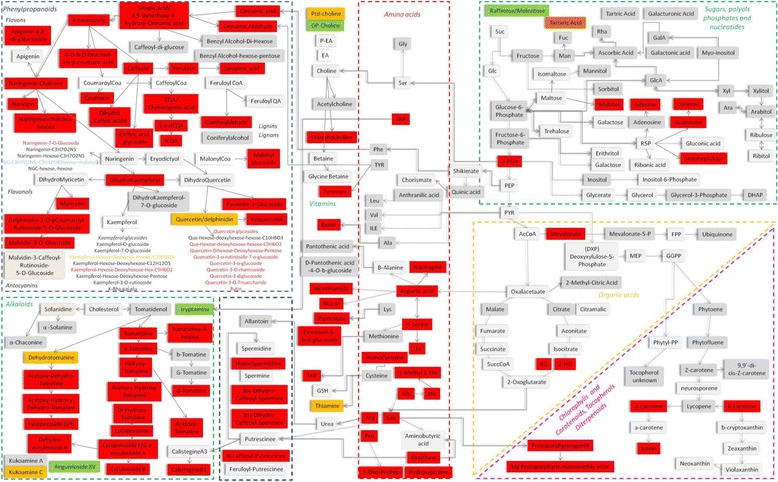
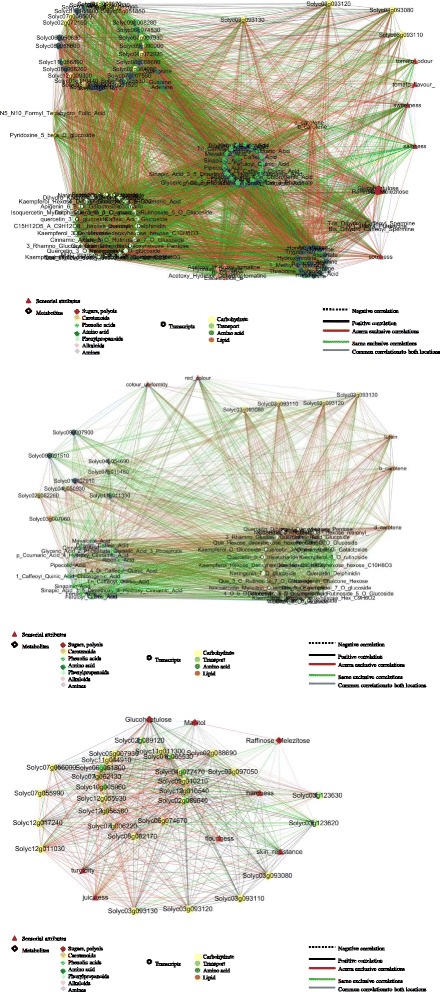
Results: Responses to environment were more pronounced in the two "local" genotypes, rather than in the Heinz 1706. The overall genetic composition of each genotype, acting in trans, modulated the specific response to environment. Duplicated genes and transcription factors, establishing different number of network connections by gaining or losing links, play a dominant role in shaping organoleptic profile. The fundamental role of cell wall metabolism in tuning all the quality attributes, including the sensorial perception, was also highlighted.
Conclusions: Although similar fruit-related quality processes are activated in the same environment, different tomato genotypes follow distinct transcriptomic, metabolomic and sensorial trajectories depending on their own genetic makeup.
Keywords: Environment; Fruit quality; Metabolome; Network; Plasticity; Sensorial attributes; Solanum lycopersicum; Transcriptome.
Figures


Similar articles
-
The Impact of Growing Area on the Expression of Fruit Traits Related to Sensory Perception in Two Tomato Cultivars.Int J Mol Sci. 2024 Aug 20;25(16):9015. doi: 10.3390/ijms25169015. Int J Mol Sci. 2024. PMID: 39201701 Free PMC article.
-
Patchwork sequencing of tomato San Marzano and Vesuviano varieties highlights genome-wide variations.BMC Genomics. 2014 Feb 18;15:138. doi: 10.1186/1471-2164-15-138. BMC Genomics. 2014. PMID: 24548308 Free PMC article.
-
Systems biology of tomato fruit development: combined transcript, protein, and metabolite analysis of tomato transcription factor (nor, rin) and ethylene receptor (Nr) mutants reveals novel regulatory interactions.Plant Physiol. 2011 Sep;157(1):405-25. doi: 10.1104/pp.111.175463. Epub 2011 Jul 27. Plant Physiol. 2011. PMID: 21795583 Free PMC article.
-
Genetics and control of tomato fruit ripening and quality attributes.Annu Rev Genet. 2011;45:41-59. doi: 10.1146/annurev-genet-110410-132507. Annu Rev Genet. 2011. PMID: 22060040 Review.
-
Use of genomics tools to isolate key ripening genes and analyse fruit maturation in tomato.J Exp Bot. 2002 Oct;53(377):2023-30. doi: 10.1093/jxb/erf057. J Exp Bot. 2002. PMID: 12324526 Review.
Cited by
-
The Impact of Growing Area on the Expression of Fruit Traits Related to Sensory Perception in Two Tomato Cultivars.Int J Mol Sci. 2024 Aug 20;25(16):9015. doi: 10.3390/ijms25169015. Int J Mol Sci. 2024. PMID: 39201701 Free PMC article.
-
Recovering Tomato Landraces to Simultaneously Improve Fruit Yield and Nutritional Quality Against Salt Stress.Front Plant Sci. 2018 Nov 30;9:1778. doi: 10.3389/fpls.2018.01778. eCollection 2018. Front Plant Sci. 2018. PMID: 30555505 Free PMC article.
-
Sensory Traits and Consumer's Perceived Quality of Traditional and Modern Fresh Market Tomato Varieties: A Study in Three European Countries.Foods. 2021 Oct 21;10(11):2521. doi: 10.3390/foods10112521. Foods. 2021. PMID: 34828802 Free PMC article.
-
Putting primary metabolism into perspective to obtain better fruits.Ann Bot. 2018 Jun 28;122(1):1-21. doi: 10.1093/aob/mcy057. Ann Bot. 2018. PMID: 29718072 Free PMC article. Review.
-
Molecular and biochemical characterization of a potato collection with contrasting tuber carotenoid content.PLoS One. 2017 Sep 12;12(9):e0184143. doi: 10.1371/journal.pone.0184143. eCollection 2017. PLoS One. 2017. PMID: 28898255 Free PMC article.
References
-
- Schlichting CD, Smith H. Phenotypic plasticity: linking molecular mechanisms with evolutionary outcomes. Evol Ecol. 2002;16:189–211. doi: 10.1023/A:1019624425971. - DOI
Publication types
MeSH terms
Substances
LinkOut - more resources
Full Text Sources
Other Literature Sources
Molecular Biology Databases
