. 2017 Aug 1;23(15):4429-4440.
doi: 10.1158/1078-0432.CCR-17-0162. Epub 2017 Mar 27.

Stratification of Pancreatic Ductal Adenocarcinoma: Combinatorial Genetic, Stromal, and Immunologic Markers

Affiliations

Stratification of Pancreatic Ductal Adenocarcinoma: Combinatorial Genetic, Stromal, and Immunologic Markers

Erik S Knudsen et al. Clin Cancer Res. .

Abstract

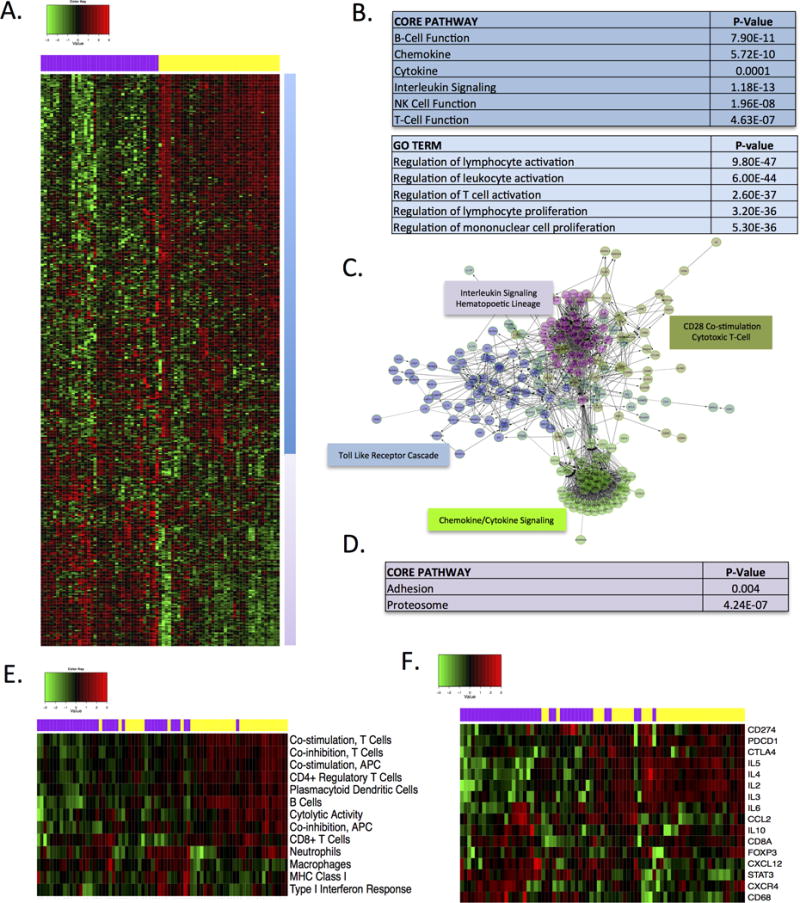
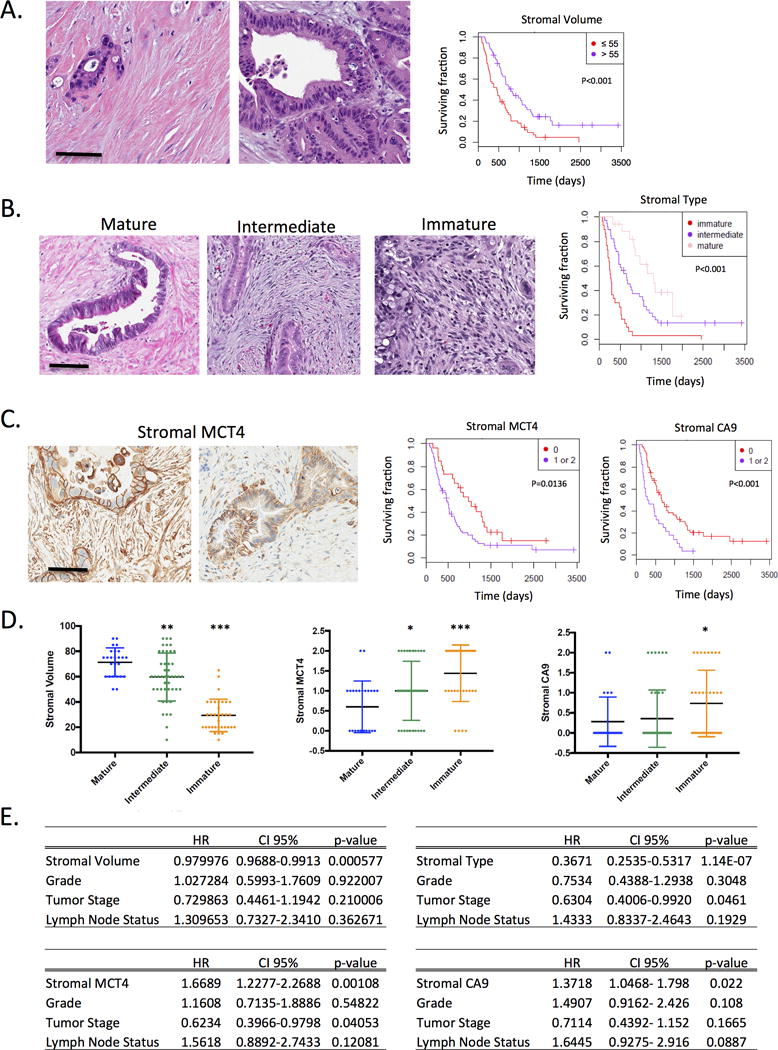
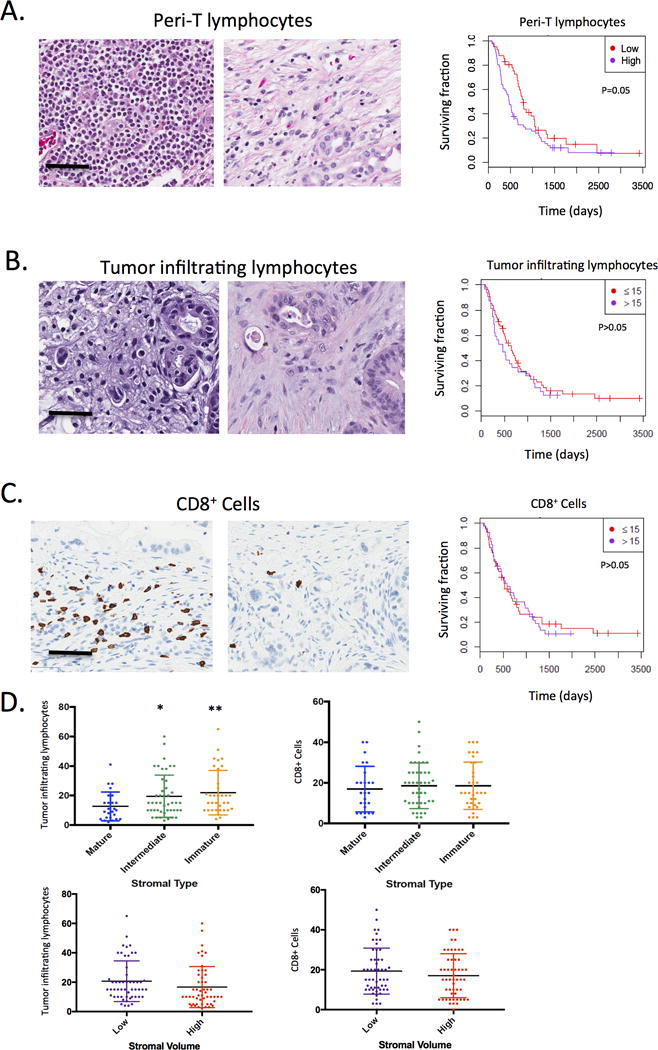
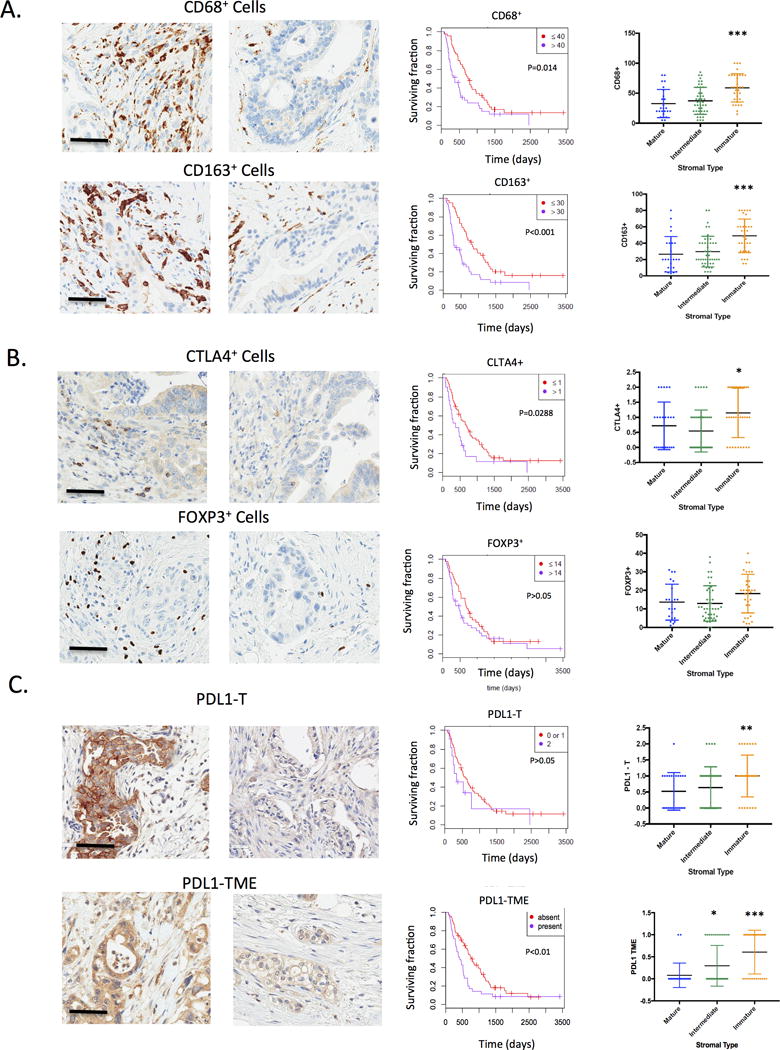
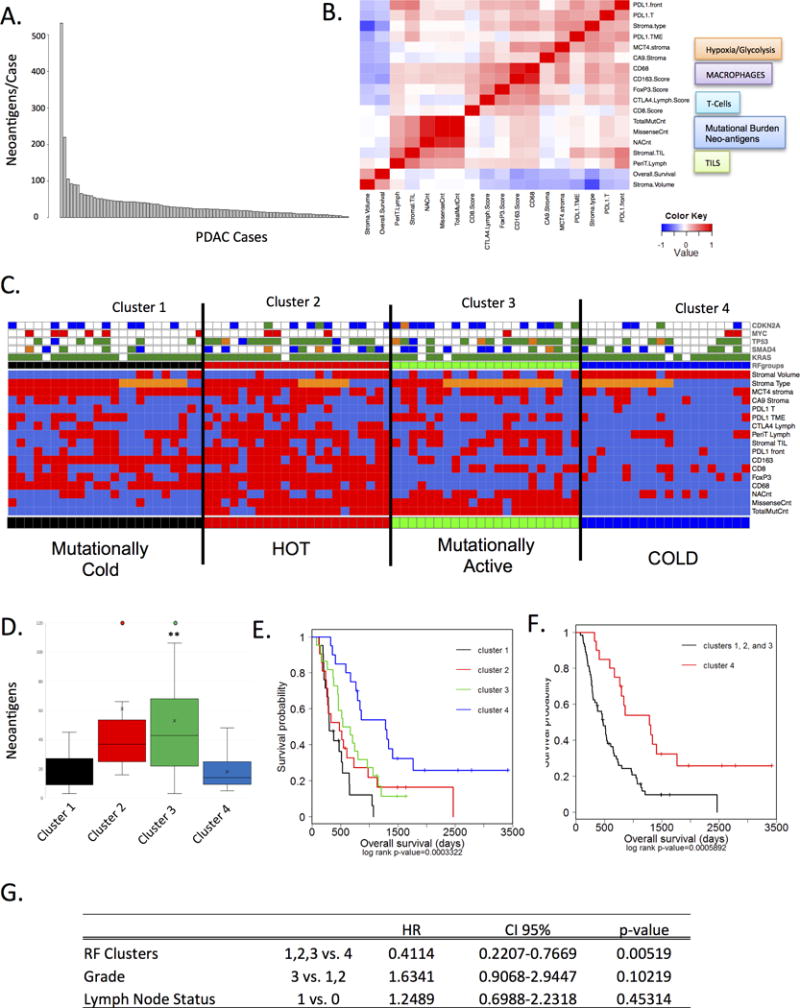
Purpose: Pancreatic ductal adenocarcinoma (PDAC) is associated with an immunosuppressive milieu that supports immune system evasion and disease progression. Here, we interrogated genetic, stromal, and immunologic features of PDAC to delineate impact on prognosis and means to more effectively employ immunotherapy.Experimental Design: A cohort of 109 PDAC cases annotated for overall survival was utilized as a primary discovery cohort. Gene expression analysis defined immunologic subtypes of PDAC that were confirmed in the Cancer Genome Atlas dataset. Stromal and metabolic characteristics of PDAC cases were evaluated by histologic analysis and immunostaining. Enumeration of lymphocytes, as well as staining for CD8, FOXP3, CD68, CD163, PDL1, and CTLA4 characterized immune infiltrate. Neoantigens were determined by analysis of whole-exome sequencing data. Random-forest clustering was employed to define multimarker subtypes, with univariate and multivariate analyses interrogating prognostic significance.Results: PDAC cases exhibited distinct stromal phenotypes that were associated with prognosis, glycolytic and hypoxic biomarkers, and immune infiltrate composition. Immune infiltrate was diverse among PDAC cases and enrichment for M2 macrophages and select immune checkpoints regulators were specifically associated with survival. Composite analysis with neoantigen burden, immunologic, and stromal features defined novel subtypes of PDAC that could have bearing on sensitivity to immunologic therapy approaches. In addition, a subtype with low levels of neoantigens and minimal lymphocyte infiltrate was associated with improved overall survival.Conclusions: The mutational burden of PDAC is associated with distinct immunosuppressive mechanisms that are conditioned by the tumor stromal environment. The defined subtypes have significance for utilizing immunotherapy in the treatment of PDAC. Clin Cancer Res; 23(15); 4429-40. ©2017 AACR.


Figures

Figure 1
Figure 1. Onco-immune gene expression analysis
(A) Heatmap demonstrating two principle expression behaviors of genes within the HTG oncoimmunology panel. (B) The yellow cluster is significantly enriched for multiple genes involved in T- and C-cell activation. (C) Example of gene networks significantly enriched within the yellow cluster. (D) The purple cluster is enriched for genes involved in adhesion and proteasome function. (E) Heatmap of gene expression signatures associated with specific branches of the immune system. Color-bar denotes canonical cluster from unsupervised analysis. (F) Expression of select genes involved in immune activation and evasion are shown. Coloar-bar denotes the canonical cluster from the unsupervised analysis.
Figure 2
Figure 2. Stromal and metabolic features are associated with prognosis
(A) PDAC cases exhibit distinct stromal volume as shown in the representative images. PDAC were stratified based on stromal volume and the association with survival is shown. (B) PDAC cases exhibit three distinct stromal subtypes as shown in the representative images. Cases were stratified based on stromal type and the immature form of PDAC stroma was significantly associated with poor prognosis as determined by Kaplan-Meier analysis. (C) The expression of MCT4 and CA9 are markers of glycolytic and hypoxic environments respectively. The high expression of each marker was significantly associated with poor prognosis as determined by Kaplan-Meier analysis. (D) The stromal volume, stromal MCT4 expression, or stromal CA9 expression were evaluated dependent on the stromal type. Statistical association was determined by t-test (*p<0.05,**p<0.01,***p<0.001). (E) Multivariate analysis of the prognostic significance of stromal volume, stromal type, stromal MCT4, or stromal CA9 were determined against the clinical variable grade, tumor stage, and nodal status. Each marker remains significant in the multivariate model.
Figure 3
Figure 3. Tumor infiltrating cells and prognosis
(A) Tumor infiltrating lymphocytes in the periphery of the tumor were scored on tissue sections using established criteria by a surgical pathologist with extensive experience with PDAC histology. The association with survival was determined by Kaplan-Meier analysis. (B) The level of tumor infiltrating lymphocytes was determined using established criteria by a surgical pathologist with extensive experience in PDAC histology. The level of tumor infiltrating lymphocytes were not significantly associated with overall survival as determined by Kaplan-Meier analysis. (C) CD8+ cells within the tumor were quantified and exhibited diverse levels within the tumor. The level of CD8+ cells was not significantly associated with overall survival as determined by Kaplan-Meier analysis. (D) The stromal tumor infiltrating lymphocytes and CD8+ cells were evaluated dependent on the stromal volume and stromal type. Statistical association was determined by t-test (*p<0.05,**p<0.01).
Figure 4
Figure 4. Differential engagement of immune suppressive features in PDAC
(A) The presence of macrophages or type II macrophages was determined by staining for CD68 and CD163 respectively. The overall presence of macrophages within the tumor microenvironment was significantly associated with overall survival as determined by Kaplan-Meier analysis. The level of CD68+ and CD163+ cells was associated with an immature stromal type (***p<0.001). (B) The presence of FOXP3 positive cells (indicative of T-regulatory cells) or CTLA4+ lymphocytes was determined within the PDAC tumors. CTLA4+ lymphocytes were significantly associated with overall survival, while FOXP3 was not significantly associated with overall survival as determined by Kaplan-Meier analysis. The level of CTLA4+ and FOXP3+ cells was determined as a function of stromal type (*p<0.05) (C) The expression of PDL1 was determined by immunostaining both in tumor cores (PDL1-T) and in the tumor micro-environment (PDL1-TME). The association with overall survival was determined by Kaplan-Meier Analysis. The level of PDL1 in various tumor comparments was analyzed as a function of stromal-type (*p<0.05,**p<0.01,***p<0.001).
Figure 5
Figure 5. Composite analysis of tumor genetics, microenvironment, and immune milieu
(A) The presence of neoantigens in the tumor cohort was determined from whole exome sequencing. Graph demonstrates the number of neoantigens per case. (B) Correlation analysis between histological features, the number of neoantigens, the number of mutations, immunologoical/metabolic markers, and overall survival is summarized in the heatmap. (C) Random Forest clustering was employed on all of the markers summarized in the heatmap to define four clusters (red=high, organge=intermediate, blue=low). The presence of hallmark genetic alterations targeting KRAS, CDKN2A, SMAD4, TP53, and MYC are shown in the color-bar (green=mutation, orange=INDEL, red=amplification, blue=deletion). (D) quantification of the number of neoantigens in each of the clusters is shown (**p<0.01) (E) The association of the Random Forest clusters with survival was determined by Kaplan-Meier analysis and statistical significance was assessed by log-rank analysis. (F) The analysis of Cluster 4 vs. all other cases was determined by Kaplan-Meier analysis and statistical significance was determined by log-rank analysis. (G) The significance of the Random Forest clusters was evaluated by multivariate analysis relative to grade and lymph-node (LN) status in the cohort. Cluster 1 remained significant relative to improved outcome.

References

    1. Moore MJ, Goldstein D, Hamm J, Figer A, Hecht JR, Gallinger S, et al. Erlotinib plus gemcitabine compared with gemcitabine alone in patients with advanced pancreatic cancer: a phase III trial of the National Cancer Institute of Canada Clinical Trials Group. J Clin Oncol. 2007;25:1960–6. - PubMed
    1. Tempero MA, Klimstra D, Berlin J, Hollingsworth T, Kim P, Merchant N, et al. Changing the way we do business: recommendations to accelerate biomarker development in pancreatic cancer. Clin Cancer Res. 2013;19:538–40. - PubMed
    1. Paulson AS, Tran Cao HS, Tempero MA, Lowy AM. Therapeutic advances in pancreatic cancer. Gastroenterology. 2013;144:1316–26. - PubMed
    1. Witkiewicz AK, McMillan EA, Balaji U, Baek G, Lin WC, Mansour J, et al. Whole-exome sequencing of pancreatic cancer defines genetic diversity and therapeutic targets. Nature communications. 2015;6:6744. - PMC - PubMed
    1. Bailey P, Chang DK, Nones K, Johns AL, Patch AM, Gingras MC, et al. Genomic analyses identify molecular subtypes of pancreatic cancer. Nature. 2016;531:47–52. - PubMed

MeSH terms