

Bile Acid Administration Elicits an Intestinal Antimicrobial Program and Reduces the Bacterial Burden in Two Mouse Models of Enteric Infection
- PMID: 28348052
- PMCID: PMC5442623
- DOI: 10.1128/IAI.00942-16
Bile Acid Administration Elicits an Intestinal Antimicrobial Program and Reduces the Bacterial Burden in Two Mouse Models of Enteric Infection
Abstract
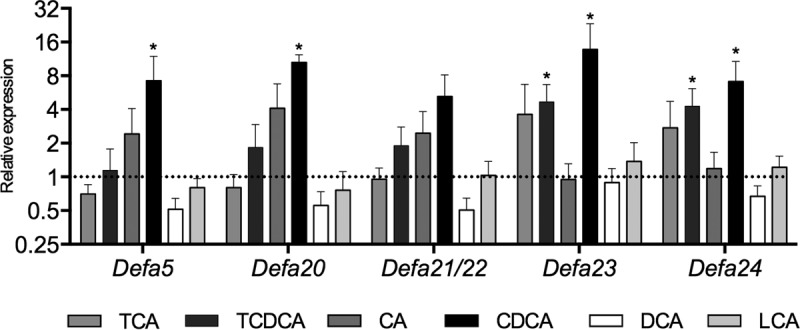
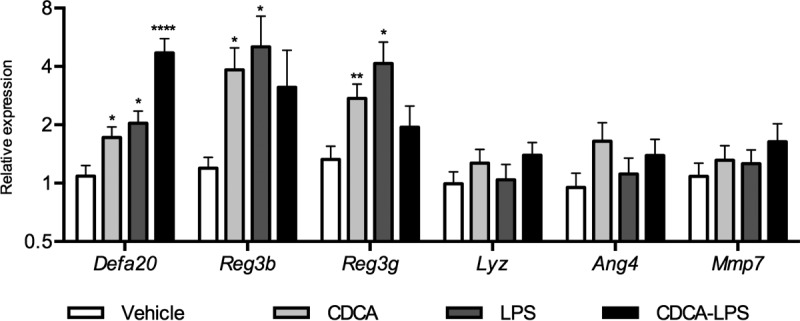
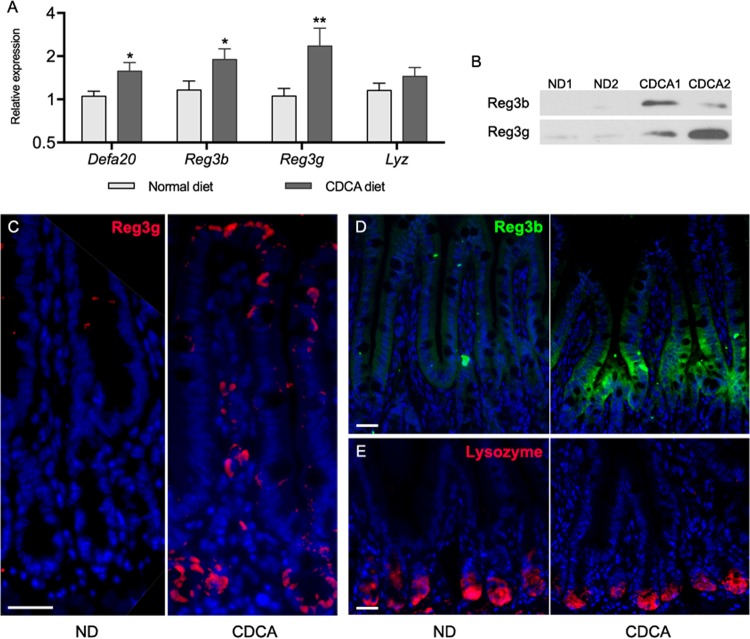
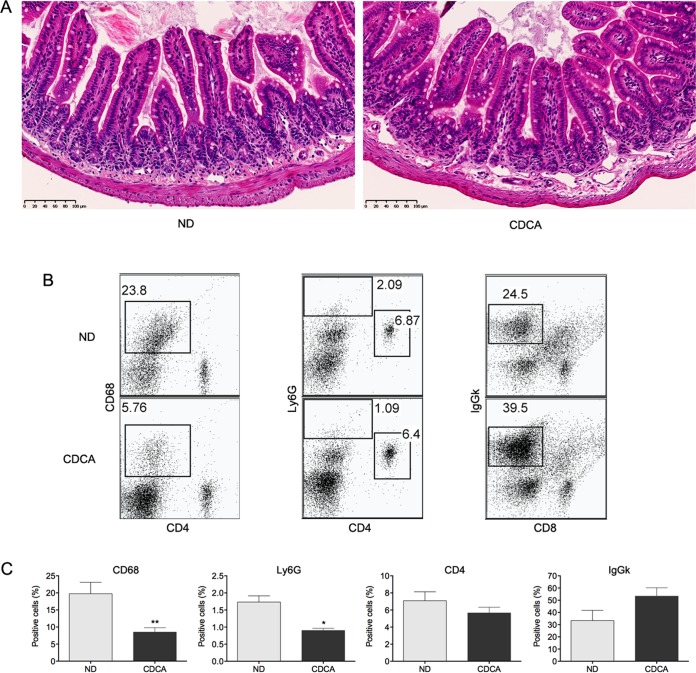
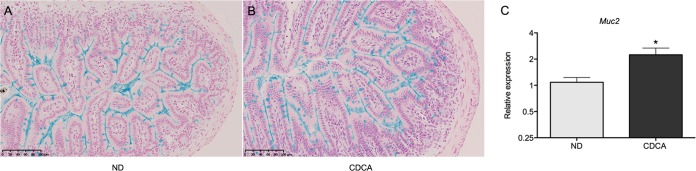
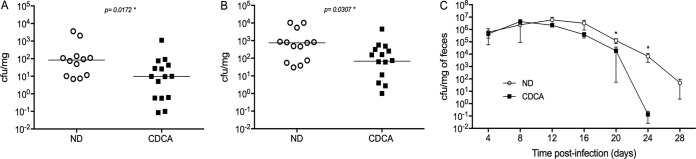
In addition to their chemical antimicrobial nature, bile acids are thought to have other functions in the homeostatic control of gastrointestinal immunity. However, those functions have remained largely undefined. In this work, we used ileal explants and mouse models of bile acid administration to investigate the role of bile acids in the regulation of the intestinal antimicrobial response. Mice fed on a diet supplemented with 0.1% chenodeoxycholic acid (CDCA) showed an upregulated expression of Paneth cell α-defensins as well as an increased synthesis of the type-C lectins Reg3b and Reg3g by the ileal epithelium. CDCA acted on several epithelial cell types, by a mechanism independent from farnesoid X receptor (FXR) and not involving STAT3 or β-catenin activation. CDCA feeding did not change the relative abundance of major commensal bacterial groups of the ileum, as shown by 16S analyses. However, administration of CDCA increased the expression of ileal Muc2 and induced a change in the composition of the mucosal immune cell repertoire, decreasing the proportion of Ly6G+ and CD68+ cells, while increasing the relative amount of IgGκ+ B cells. Oral administration of CDCA to mice attenuated infections with the bile-resistant pathogens Salmonella enterica serovar Typhimurium and Citrobacter rodentium, promoting lower systemic colonization and faster bacteria clearance, respectively. Our results demonstrate that bile acid signaling in the ileum triggers an antimicrobial program that can be potentially used as a therapeutic option against intestinal bacterial infections.
Keywords: Citrobacter rodentium; Salmonella enterica; bile acids; intestinal antimicrobial peptides; mucins; mucosal immunity.
Copyright © 2017 American Society for Microbiology.
Figures
Similar articles
-
Regional variations in Paneth cell antimicrobial peptide expression along the mouse intestinal tract.BMC Immunol. 2008 Jul 17;9:37. doi: 10.1186/1471-2172-9-37. BMC Immunol. 2008. PMID: 18637162 Free PMC article.
-
Intestinal epithelium-specific MyD88 signaling impacts host susceptibility to infectious colitis by promoting protective goblet cell and antimicrobial responses.Infect Immun. 2014 Sep;82(9):3753-63. doi: 10.1128/IAI.02045-14. Epub 2014 Jun 23. Infect Immun. 2014. PMID: 24958710 Free PMC article.
-
Paneth cell α-defensins in enteric innate immunity.Cell Mol Life Sci. 2011 Jul;68(13):2215-29. doi: 10.1007/s00018-011-0714-6. Epub 2011 May 11. Cell Mol Life Sci. 2011. PMID: 21560070 Free PMC article. Review.
-
Paneth cell alpha-defensins: peptide mediators of innate immunity in the small intestine.Springer Semin Immunopathol. 2005 Sep;27(2):133-46. doi: 10.1007/s00281-005-0202-x. Epub 2005 Jun 2. Springer Semin Immunopathol. 2005. PMID: 15931529 Review.
-
Paneth cells, defensins, and the commensal microbiota: a hypothesis on intimate interplay at the intestinal mucosa.Semin Immunol. 2007 Apr;19(2):70-83. doi: 10.1016/j.smim.2007.04.002. Epub 2007 May 7. Semin Immunol. 2007. PMID: 17485224 Review.
Cited by
-
Multi-omics analysis reveals a feedback loop amplifying immune responses in acute graft-versus-host disease due to imbalanced gut microbiota and bile acid metabolism.J Transl Med. 2024 Aug 7;22(1):746. doi: 10.1186/s12967-024-05577-x. J Transl Med. 2024. PMID: 39113144 Free PMC article.
-
Bile acids drive the newborn's gut microbiota maturation.Nat Commun. 2020 Jul 23;11(1):3692. doi: 10.1038/s41467-020-17183-8. Nat Commun. 2020. PMID: 32703946 Free PMC article.
-
Review: microbial transformations of human bile acids.Microbiome. 2021 Jun 14;9(1):140. doi: 10.1186/s40168-021-01101-1. Microbiome. 2021. PMID: 34127070 Free PMC article. Review.
-
Farnesoid X receptor: a potential therapeutic target in multiple organs.Histol Histopathol. 2020 Dec;35(12):1403-1414. doi: 10.14670/HH-18-301. Epub 2021 Jan 4. Histol Histopathol. 2020. PMID: 33393073 Review.
-
Effects of Bile Acids on Growth Performance, Hepatopancreatic Antioxidant Capacity, Intestinal Immune-Related Gene Expression, and Gut Microbiota of Penaeus vannamei.Animals (Basel). 2025 Jan 16;15(2):240. doi: 10.3390/ani15020240. Animals (Basel). 2025. PMID: 39858240 Free PMC article.
References
-
- Hofmann AF. 1999. Bile acids: The Good, the Bad, and the Ugly. News Physiol Sci 14:24–29. - PubMed
Publication types
MeSH terms
Substances
LinkOut - more resources
Full Text Sources
Other Literature Sources
Medical
Miscellaneous
