. 2017 Aug;28(8):2443-2458.
doi: 10.1681/ASN.2016070711. Epub 2017 Mar 27.

Long-Term Endothelin-A Receptor Antagonism Provides Robust Renal Protection in Humanized Sickle Cell Disease Mice

Affiliations

Long-Term Endothelin-A Receptor Antagonism Provides Robust Renal Protection in Humanized Sickle Cell Disease Mice

Malgorzata Kasztan et al. J Am Soc Nephrol. 2017 Aug.

Abstract

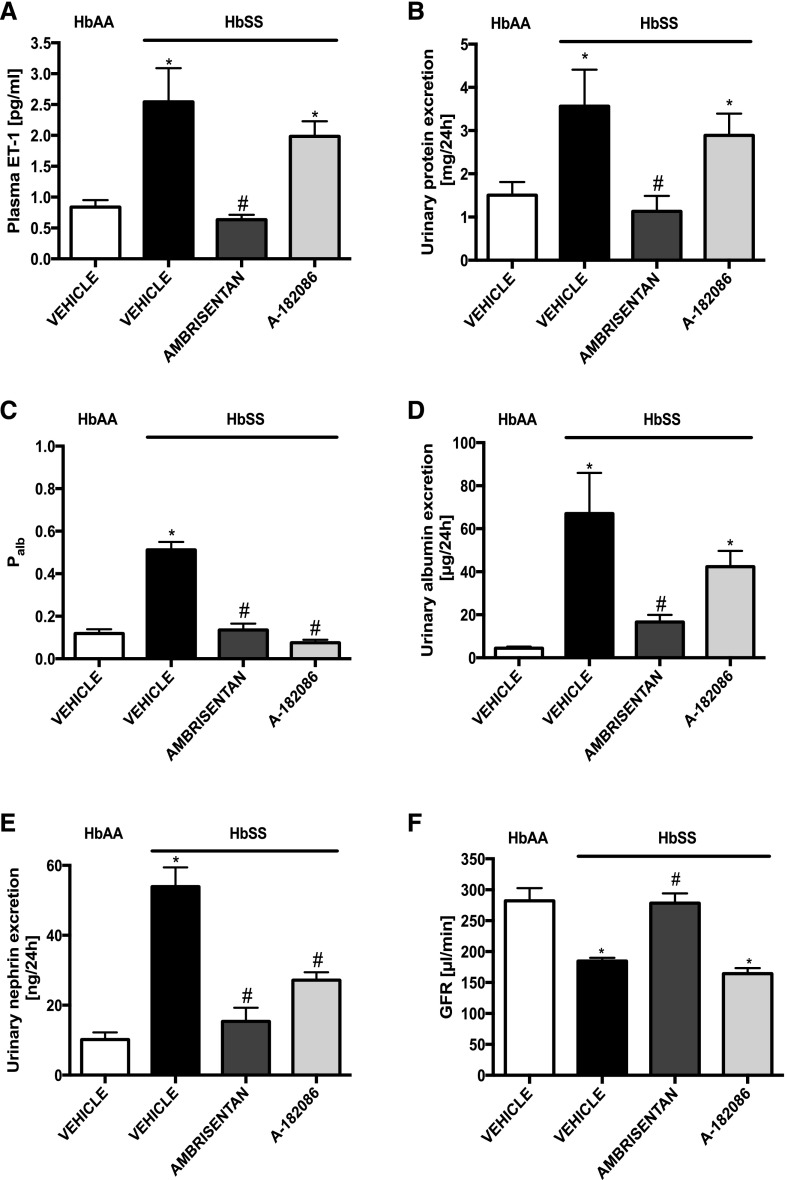
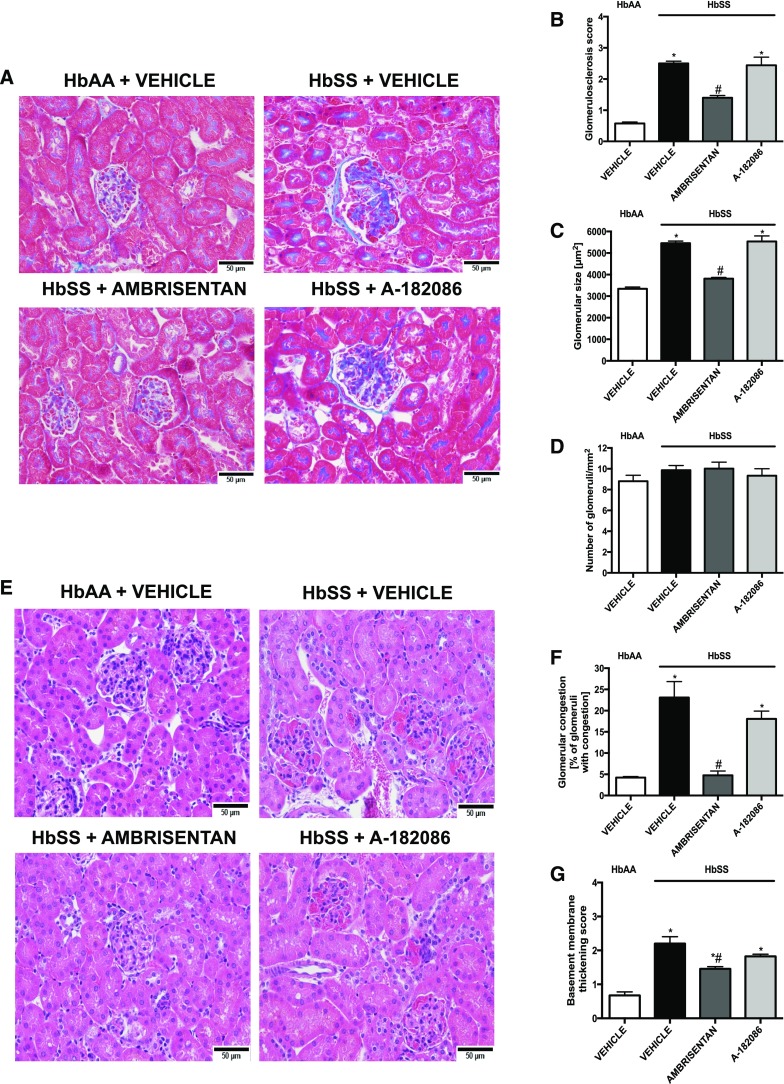
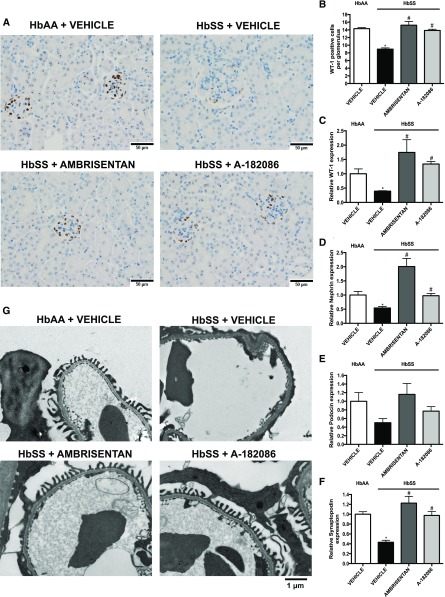
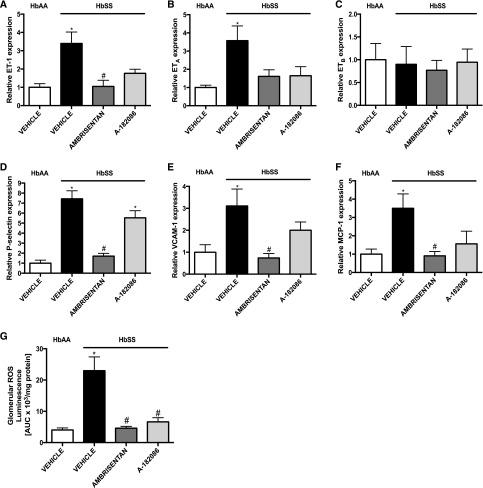
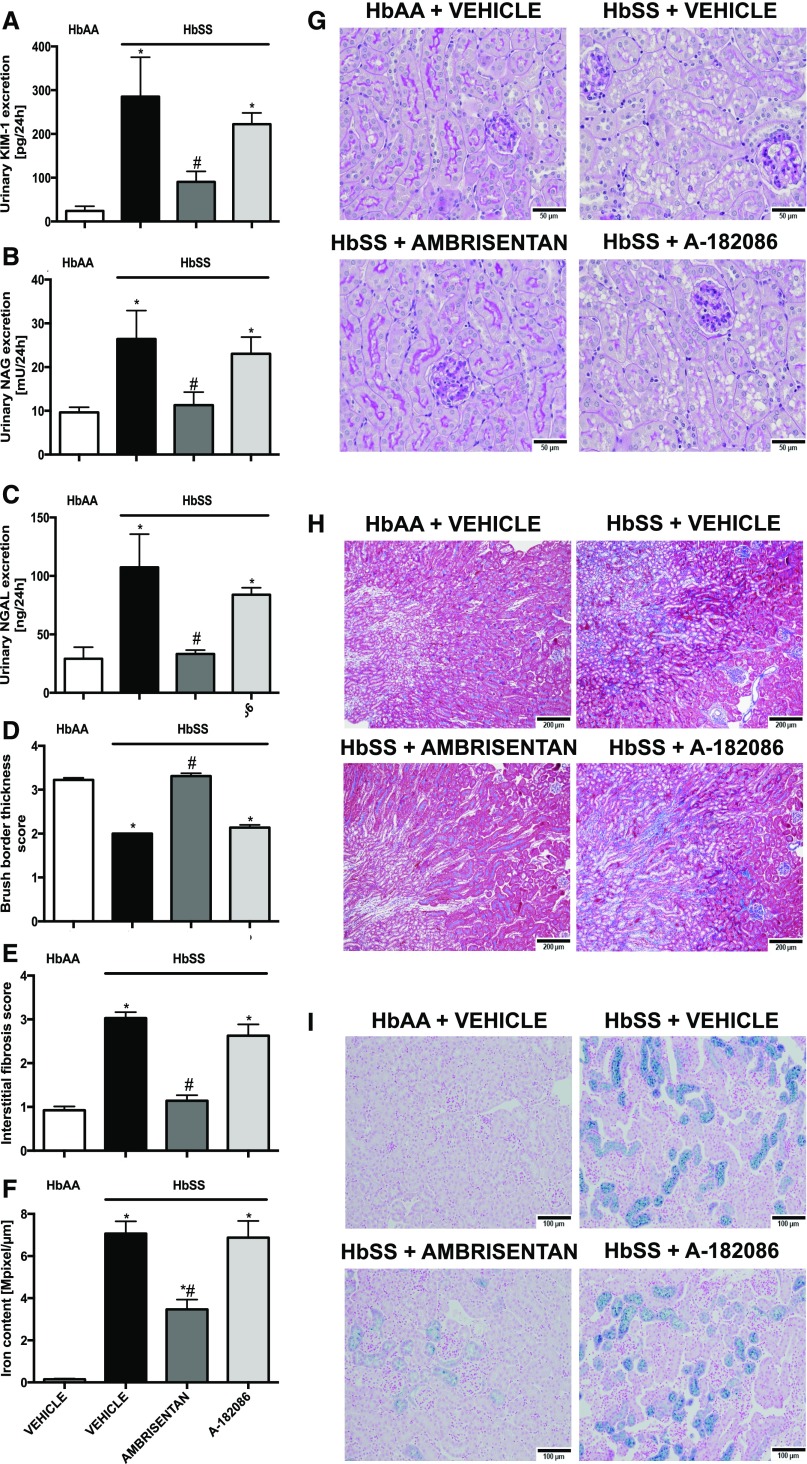
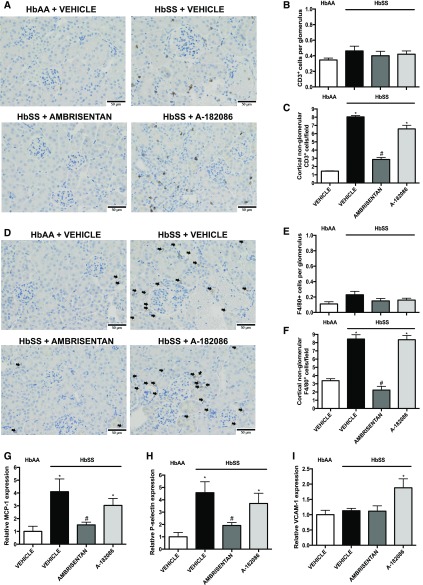
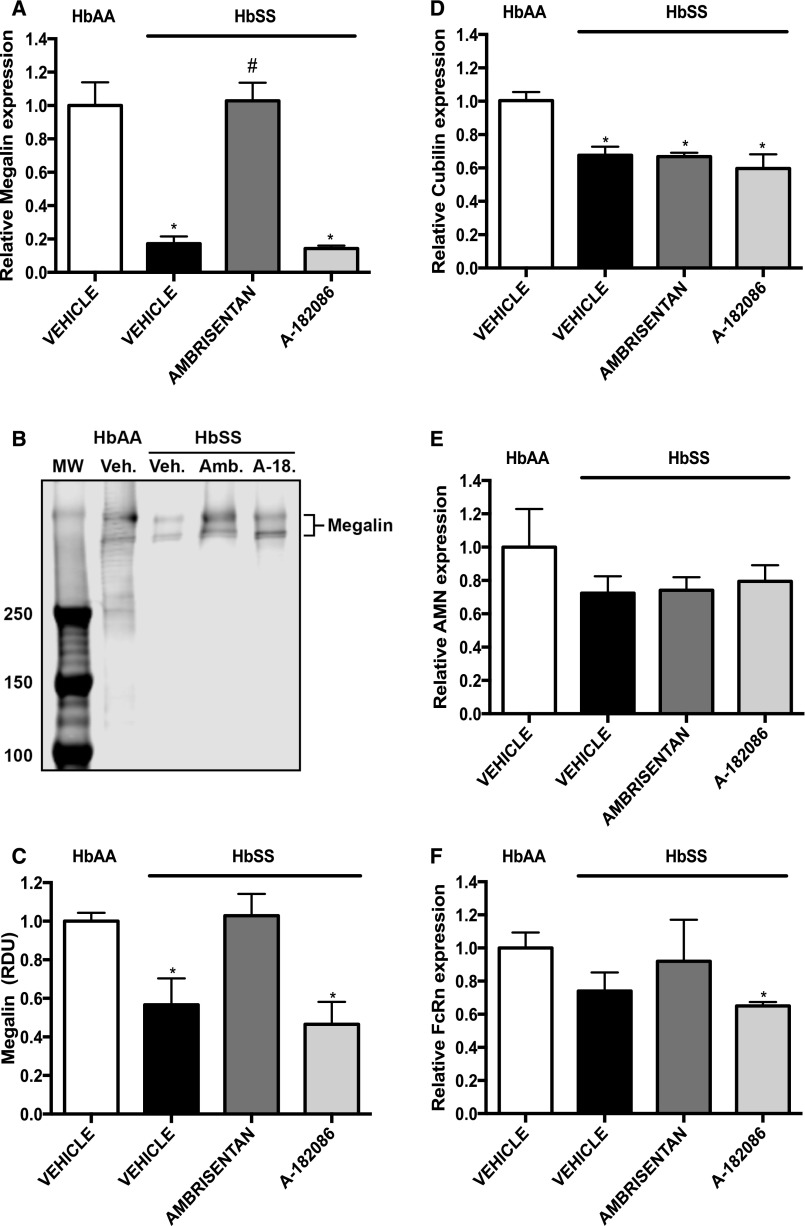
Sickle cell disease (SCD)-associated nephropathy is a major source of morbidity and mortality in patients because of the lack of efficacious treatments targeting renal manifestations of the disease. Here, we describe a long-term treatment strategy with the selective endothelin-A receptor (ETA) antagonist, ambrisentan, designed to interfere with the development of nephropathy in a humanized mouse model of SCD. Ambrisentan preserved GFR at the level of nondisease controls and prevented the development of proteinuria, albuminuria, and nephrinuria. Microscopy studies demonstrated prevention of podocyte loss and structural alterations, the absence of vascular congestion, and attenuation of glomerulosclerosis in treated mice. Studies in isolated glomeruli showed that treatment reduced inflammation and oxidative stress. At the level of renal tubules, ambrisentan treatment prevented the increased excretion of urinary tubular injury biomarkers. Additionally, the treatment strategy prevented tubular brush border loss, diminished tubular iron deposition, blocked the development of interstitial fibrosis, and prevented immune cell infiltration. Furthermore, the prevention of albuminuria in treated mice was associated with preservation of cortical megalin expression. In a separate series of identical experiments, combined ETA and ETB receptor antagonism provided only some of the protection observed with ambrisentan, highlighting the importance of exclusively targeting the ETA receptor in SCD. Our results demonstrate that ambrisentan treatment provides robust protection from diverse renal pathologies in SCD mice, and suggest that long-term ETA receptor antagonism may provide a strategy for the prevention of renal complications of SCD.

Keywords: endothelin; glomerular filtration barrier; proteinuria; renal injury; sickle nephropathy.


Figures

Figure 1.
Figure 1.
Long-term selective ETA receptor antagonism preserves glomerular function by preventing glomerular injury in humanized sickle cell mice. Plasma ET-1 and markers of renal function from genetic control (HbAA) and humanized sickle mice (HbSS) treated with vehicle, the selective ETA antagonist, ambrisentan, or the combined ETA/B antagonist, A-182086, for 10 weeks beginning at 4 weeks of age. (A) Depicts the average ET-1 in plasma after 10-week treatment protocol. (B) Depicts the average proteinuria after 10-week treatment protocol. (C) Depicts the average Palb after 10-week treatment protocol. (D) Depicts the average urinary albumin excretion after 10-week treatment protocol. (E) Depicts the average urinary nephrin excretion after 10-week treatment protocol. (F) Depicts the average GFR after 10-week treatment protocol. Data are mean±SEM; *P<0.05 versus vehicle-treated HbAA; #P<0.05 versus vehicle-treated HbSS; n=9–10 in HbSS and n=9 in vehicle-treated HbAA group.
Figure 2.
Figure 2.
Histological analysis reveals that selective ETA receptor antagonism preserves glomerular morphology and prevents vascular congestion in humanized sickle cell mice. Histologic examination of the renal cortex of genetic control (HbAA) and humanized sickle mice (HbSS) treated with vehicle, the selective ETA antagonist, ambrisentan, or the combined ETA/B antagonist, A-182086, for 10 weeks beginning at 4 weeks of age. (A) Depicts representative Masson trichrome–stained sections of glomeruli. Original magnification, ×40 (scale bar=50 μm). (B) Depicts quantification of (A) represented as sclerosis index score. (C) Depicts glomerulomegaly represented as mean area of glomeruli (square micrometer). (D) Depicts number of glomeruli per square millimeter. (E) Depicts representative hematoxylin and eosin–stained sections of glomeruli. Original magnification, ×40 (scale bar=50 μm). (F) Depicts glomerular congestion represented as percentage of glomeruli with congestion. (G) Depicts basement membrane of Bowman’s capsule thickening score. Data are mean±SEM; n=5 in HbAA and HbSS groups; *P<0.05 versus vehicle-treated HbAA; #P<0.05 versus vehicle-treated HbSS. All of the glomerular characteristics were counted in ten sections per slide (minimum 20 glomeruli).
Figure 3.
Figure 3.
ETA receptor antagonism prevents podocyte loss and preserves podocyte structure in humanized sickle cell mice. Immunohistochemical examination and mRNA expression of markers of podocyte injury of kidneys from genetic control (HbAA) and humanized sickle mice (HbSS) treated with vehicle, the selective ETA antagonist, ambrisentan, or the combined ETA/B antagonist, A-182086, for 10 weeks beginning at 4 weeks of age. (A) Depicts representative WT-1–positive stained sections of glomeruli. Original magnification, ×40 (scale bar=50 μm). (B) Depicts the quantification of (A) represented as the average number of WT-1–positive cells per glomerulus. Podocytes were counted in minimum 20 glomeruli in ten sections per slide. Data are mean±SEM; n=5 in HbAA and HbSS groups. (C) Depicts the relative WT-1 mRNA expression in glomeruli after 10-week treatment protocol. (D) Depicts the relative nephrin mRNA expression in glomeruli after 10-week treatment protocol. (E) Depicts the relative podocin mRNA expression in glomeruli after 10-week treatment protocol. (F) Depicts the relative synaptopodin mRNA expression in glomeruli after 10-week treatment protocol. (G) Depicts representative photomicrographs of transmission electron microscopy sections of glomeruli. Data are mean±SEM; *P<0.05 versus vehicle-treated HbAA; #P<0.05 versus vehicle-treated HbSS; n=5–6 in HbSS and n=6 in vehicle-treated HbAA group.
Figure 4.
Figure 4.
Evidence from isolated glomeruli suggests that ETA receptor antagonism prevents the onset of glomerular inflammation and oxidative stress in humanized sickle cell mice. Expression of components of the ET system, inflammation, and oxidative stress in glomeruli from genetic control (HbAA) and humanized sickle mice (HbSS) treated with vehicle, the selective ETA antagonist, ambrisentan, or the combined ETA/B antagonist, A-182086, for 10 weeks beginning at 4 weeks of age. (A) Depicts the relative ET-1 mRNA expression in glomeruli after 10-week treatment protocol. (B) Depicts the relative ETA receptor mRNA expression in glomeruli after 10-week treatment protocol. (C) Depicts the relative ETB receptor mRNA expression in glomeruli after 10-week treatment protocol. (D) Depicts the relative P-selectin mRNA expression in glomeruli after 10-week treatment protocol. (E) Depicts the relative vascular cell adhesion molecule 1 (VCAM-1) mRNA expression in glomeruli after 10-week treatment protocol. (F) Depicts the relative monocyte chemoattractant protein-1 (MCP-1) mRNA expression in glomeruli after 10-week treatment protocol. (G) Depicts the glomerular ROS production after 10-week treatment protocol. Data are mean±SEM; *P<0.05 versus vehicle-treated HbAA; #P<0.05 versus vehicle-treated HbSS; n=5–6 in HbSS and n=6 in vehicle-treated HbAA group. AUC, area under the curve.
Figure 5.
Figure 5.
Long-term ETA receptor antagonism prevents renal tubular injury in humanized sickle cell mice. Histologic examination of the renal cortex and urinary excretion of markers of tubular injury of genetic control (HbAA) and humanized sickle mice (HbSS) treated with vehicle, the selective ETA antagonist, ambrisentan, or the combined ETA/B antagonist, A-182086, for 10 weeks beginning at 4 weeks of age. (A) Depicts the average urinary KIM-1 excretion after 10-week treatment protocol. (B) Depicts the average urinary NAG excretion after 10-week treatment protocol. (C) Depicts the average urinary NGAL excretion, iron-binding protein, after 10-week treatment protocol. Data are mean±SEM; *P<0.05 versus vehicle-treated HbAA; #P<0.05 versus vehicle-treated HbSS; n=9–10 in HbSS and n=9 in untreated HbAA group. (D) Depicts brush border thickness index score. (E) Depicts interstitial fibrosis index score. (F) Depicts quantification of iron deposition in the whole kidney sections (megapixel per micrometer). (G) Depicts representative periodic acid Schiff–hematoxylin–stained sections of renal cortex. Original magnification, ×40 (scale bar=50 μm). (H) Representative Masson trichrome–stained sections of renal cortex and medulla. Original magnification, ×10 (scale bar=200 μm, respectively). (I) Depicts Prussian blue iron–stained sections of renal cortex. Original magnification, ×20 (scale bar=100 µm). Fibrosis and brush border thickness were assessed in ten sections per slide. Data are mean±SEM; *P<0.05 versus vehicle-treated HbAA; #P<0.05 versus vehicle-treated HbSS; n=5 in HbAA and HbSS groups.
Figure 6.
Figure 6.
Selective ETA receptor antagonism prevents renal cortical inflammation and immune cell infiltration in humanized sickle cell mice. Immunohistochemical examination and mRNA expression of proinflammatory and profibrotic markers in renal cortex of genetic control (HbAA) and humanized sickle mice (HbSS) treated with vehicle, the selective ETA antagonist, ambrisentan, or the combined ETA/B antagonist, A-182086, for 10 weeks beginning at 4 weeks of age. (A) Depicts representative CD3+–stained cortical sections. Original magnification, ×40 (scale bar=50 μm). (B) Depicts the quantification of glomerular CD3+ cells represented as the average number of CD3+ cells per glomerulus (minimum 20 glomeruli counted). (C) Depicts the quantification of cortical nonglomerular CD3+ cells represented as the average number of nonglomerular CD3+ cells per field. (D) Depicts representative F4/80+-stained cortical sections. Original magnification, ×40 (scale bar=50 μm). Arrows indicate F4/80+ cells. (E) Depicts the quantification of glomerular F4/80+ cells represented as the average number of F4/80+ cells per glomerulus (minimum 20 glomeruli counted). (F) Depicts the quantification of cortical nonglomerular F4/80+ cells represented as the average number of nonglomerular F4/80+ cells per field. CD3+ and F4/80+ cells were assessed in ten sections per slide and calculated. Data are mean±SEM; n=5 in HbAA and HbSS groups. (G) Depicts the relative MCP-1 mRNA expression in cortex after 10-week treatment protocol. (H) Depicts the relative P-selectin mRNA expression in cortex after 10-week treatment protocol. (I) Depicts the relative VCAM-1 mRNA expression in cortex after 10-week treatment protocol. Data are mean±SEM *P<0.05 versus vehicle-treated HbAA; #P<0.05 versus vehicle-treated HbSS; n=5–6 in HbSS and n=6 in vehicle-treated HbAA group.
Figure 7.
Figure 7.
Analysis of tubular albumin transporters reveals that ETA receptor antagonism preserves megalin expression in the renal cortex of humanized sickle cell mice. Expression of receptors that participate in albumin handling from renal cortex of genetic control (HbAA) and humanized sickle mice (HbSS) treated with vehicle, the selective ETA antagonist, ambrisentan, or the combined ETA/B antagonist, A-182086, for 10 weeks beginning at 4 weeks of age. (A) Depicts the relative megalin mRNA expression in cortex after 10-week treatment protocol. (B) Depicts Western blot analysis of megalin expression in cortical extracts. (C) Depicts quantification of Western blot bands for megalin. (D) Depicts the relative cubilin mRNA expression in cortex after 10-week treatment protocol. (E) Depicts the relative amnionless (AMN) receptor mRNA expression in cortex after 10-week treatment protocol. (F) Depicts the relative FcRn mRNA expression in cortex after 10-week treatment protocol. Data are mean±SEM; *P<0.05 versus vehicle-treated HbAA; #P<0.05 versus vehicle-treated HbSS; n=5–6 in HbSS and n=6 in vehicle-treated HbAA group. a-18, A-182086; Amb., Ambrisentan; MW, molecular weight; RDU, relative densitometry units; Veh., vehicle.

Comment in

Similar articles

Cited by

References

    1. Hassell KL: Population estimates of sickle cell disease in the U.S. Am J Prev Med 38[Suppl]: S512–S521, 2010 - PubMed
    1. Weatherall DJ, Clegg JB: Inherited haemoglobin disorders: An increasing global health problem. Bull World Health Organ 79: 704–712, 2001 - PMC - PubMed
    1. Nath KA, Hebbel RP: Sickle cell disease: Renal manifestations and mechanisms. Nat Rev Nephrol 11: 161–171, 2015 - PMC - PubMed
    1. Lanzkron S, Carroll CP, Haywood C Jr: Mortality rates and age at death from sickle cell disease: U.S., 1979-2005. Public Health Rep 128: 110–116, 2013 - PMC - PubMed
    1. Yawn BP, Buchanan GR, Afenyi-Annan AN, Ballas SK, Hassell KL, James AH, Jordan L, Lanzkron SM, Lottenberg R, Savage WJ, Tanabe PJ, Ware RE, Murad MH, Goldsmith JC, Ortiz E, Fulwood R, Horton A, John-Sowah J: Management of sickle cell disease: Summary of the 2014 evidence-based report by expert panel members. JAMA 312: 1033–1048, 2014 - PubMed