

Urate hydroperoxide oxidizes human peroxiredoxin 1 and peroxiredoxin 2
- PMID: 28348082
- PMCID: PMC5448098
- DOI: 10.1074/jbc.M116.767657
Urate hydroperoxide oxidizes human peroxiredoxin 1 and peroxiredoxin 2
Abstract
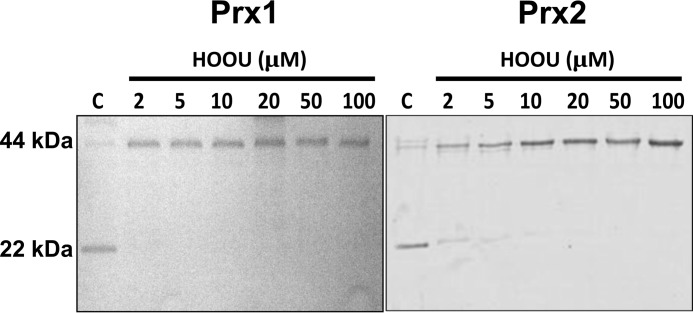
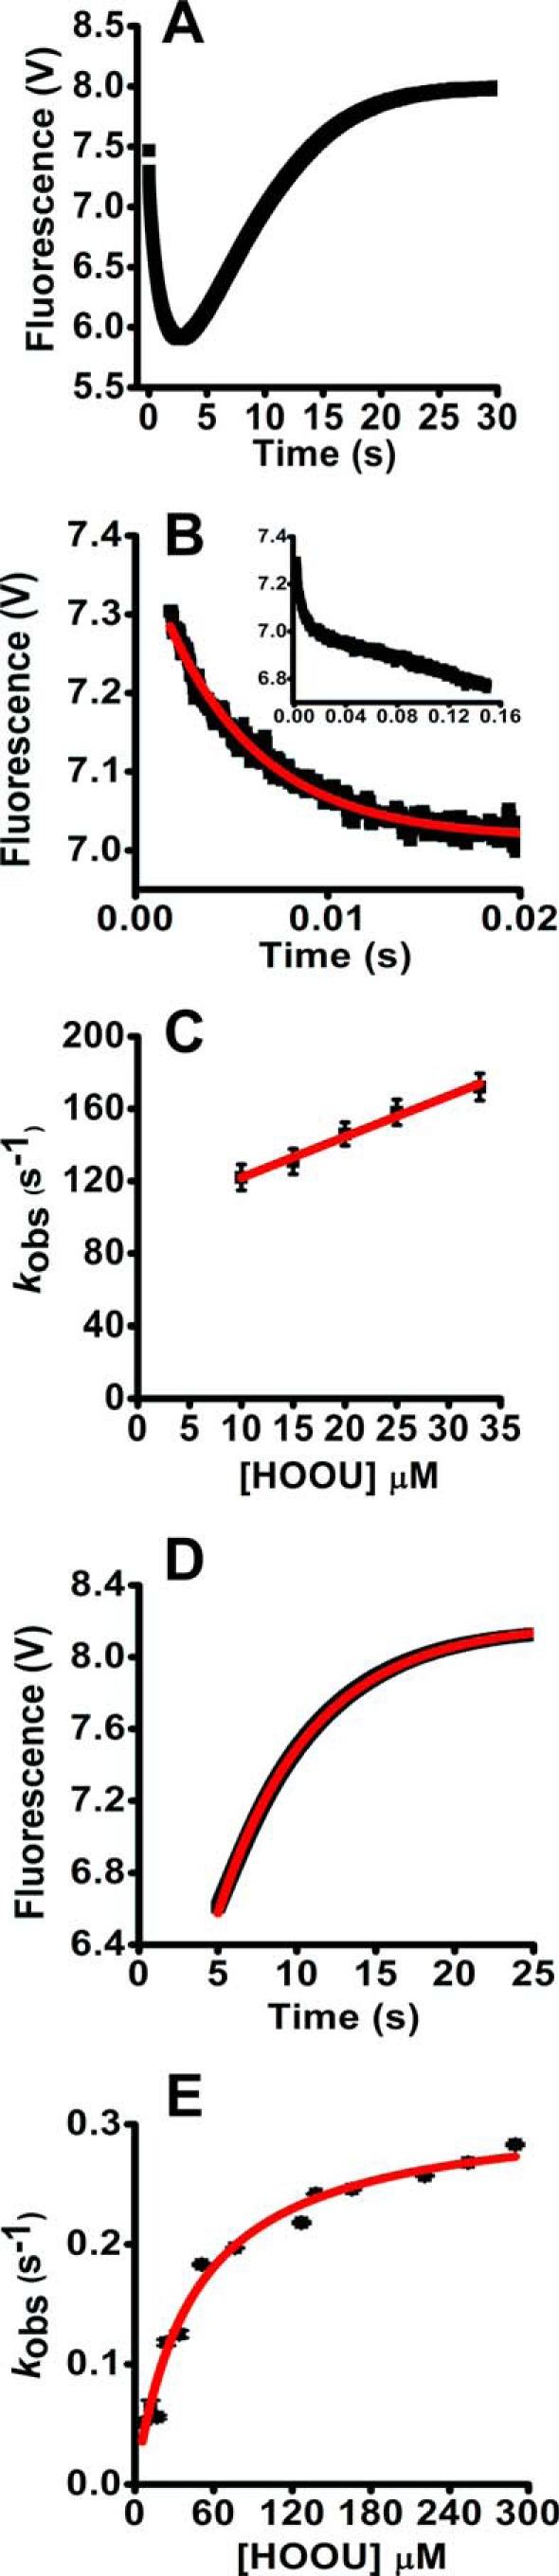
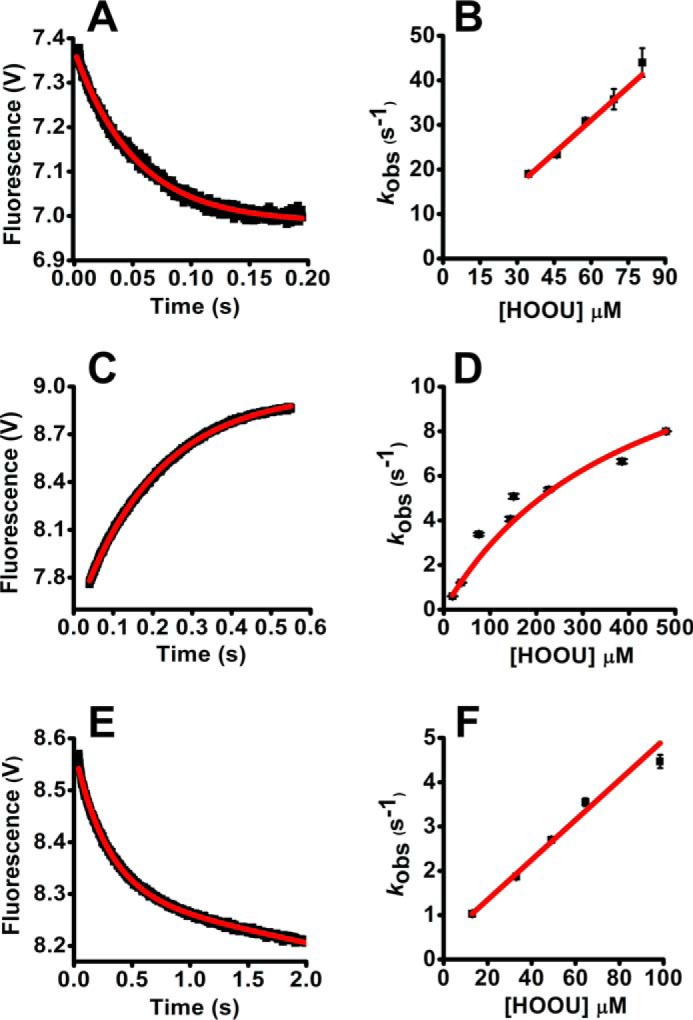
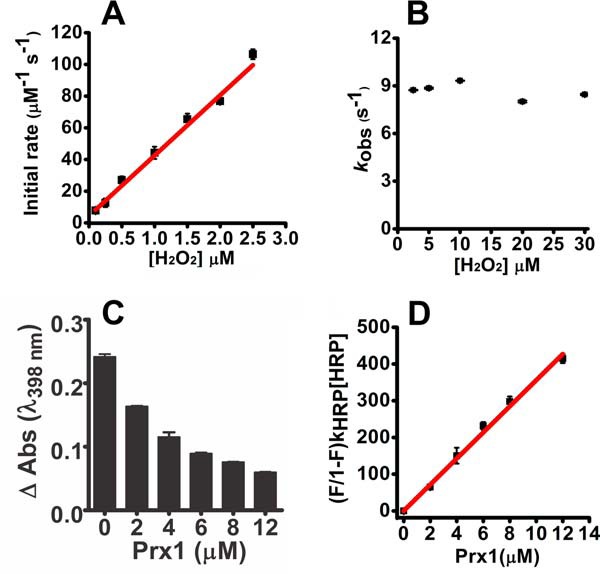
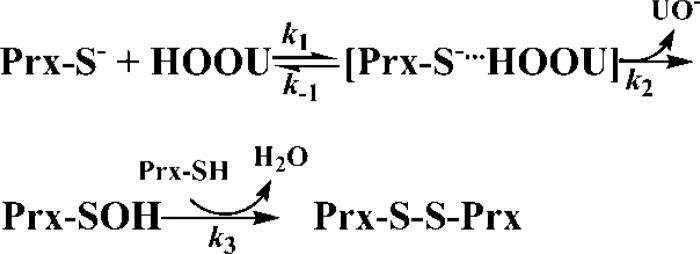
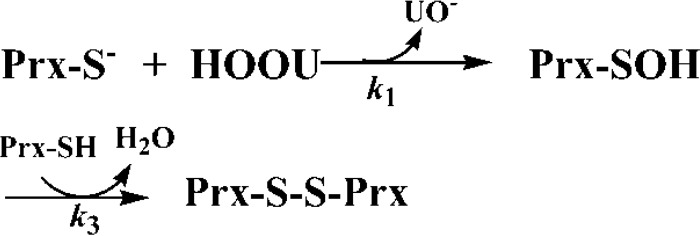
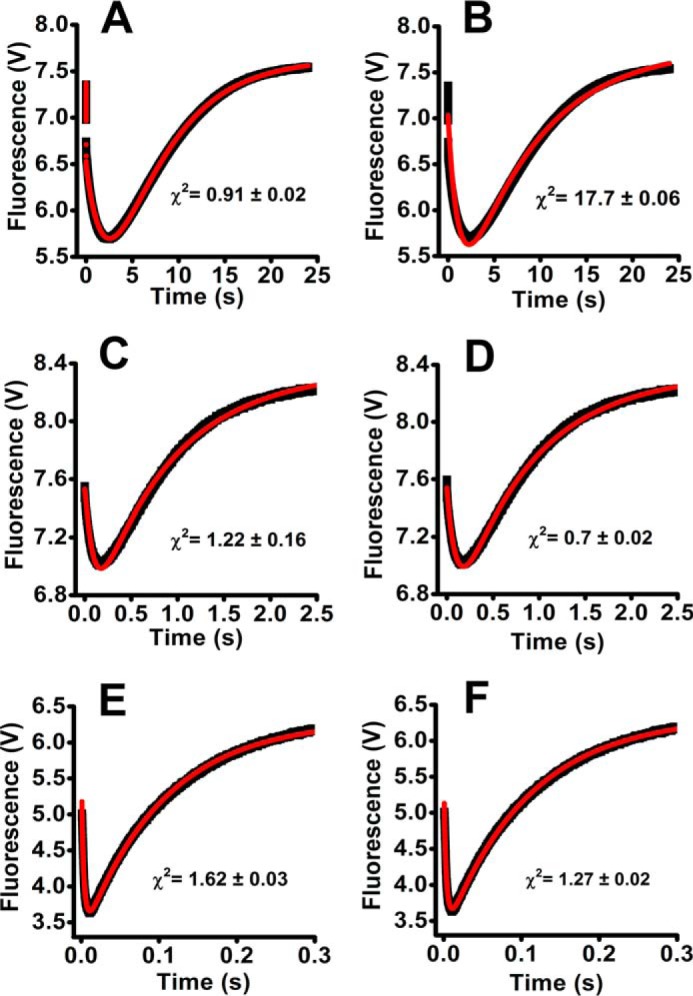
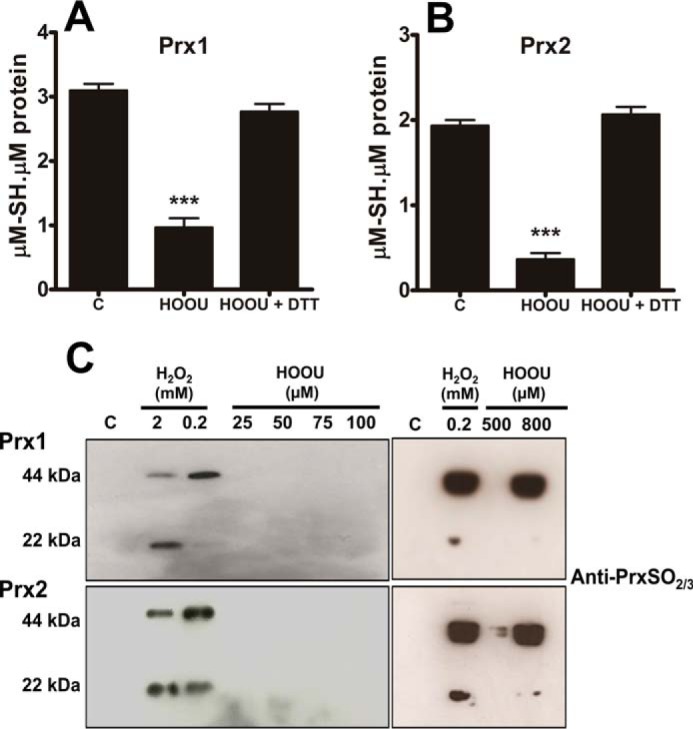
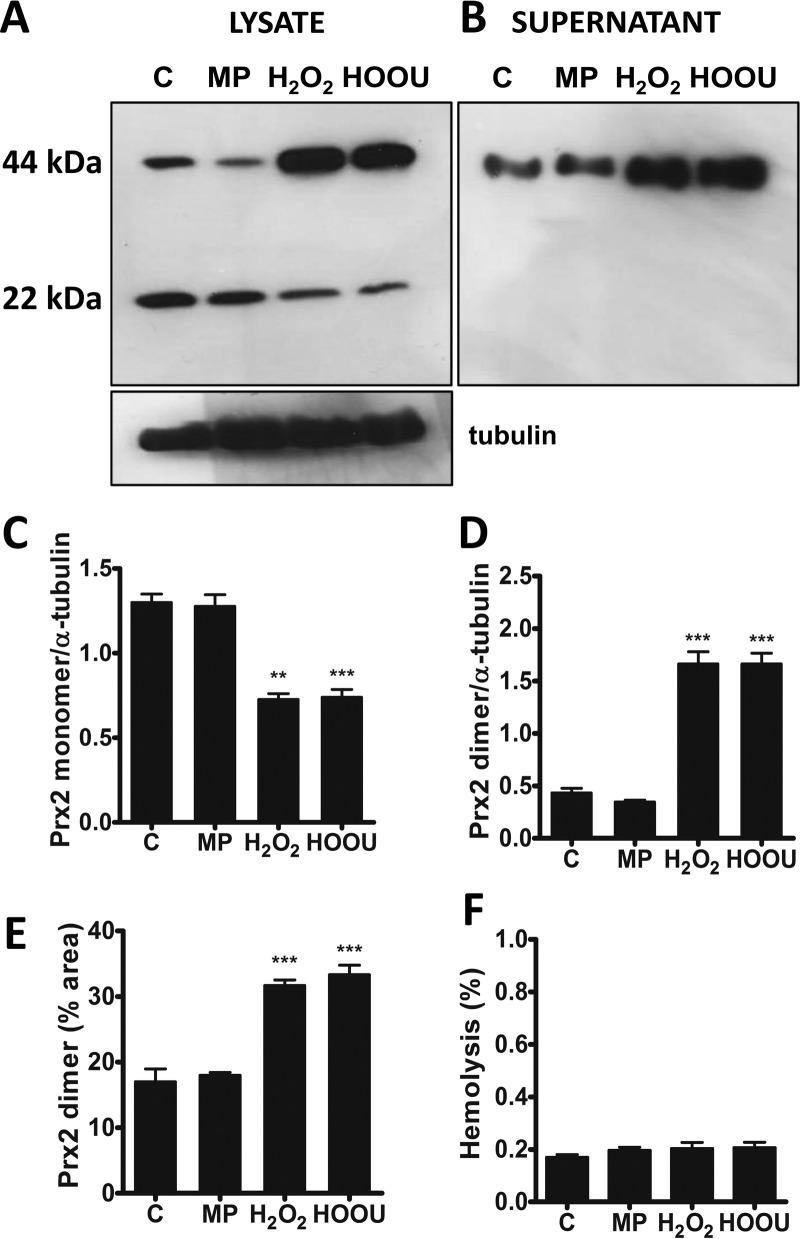
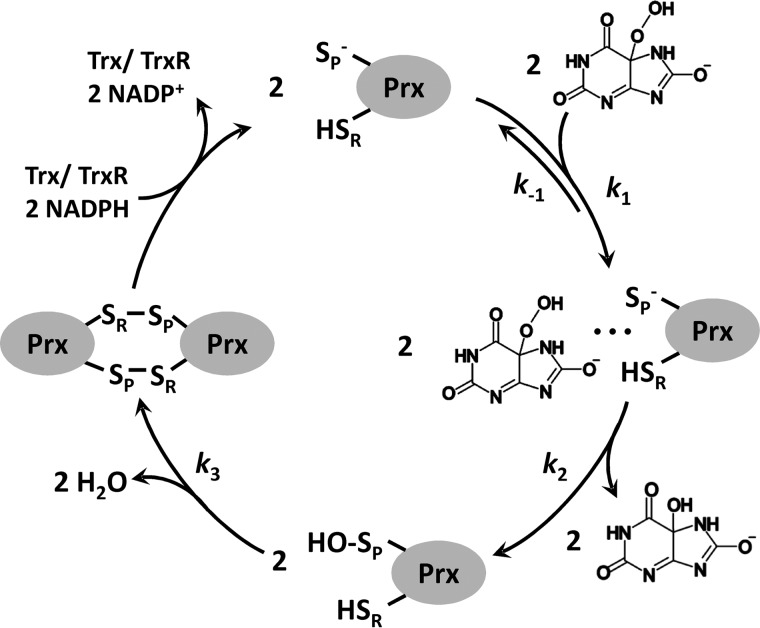
Urate hydroperoxide is a product of the oxidation of uric acid by inflammatory heme peroxidases. The formation of urate hydroperoxide might be a key event in vascular inflammation, where there is large amount of uric acid and inflammatory peroxidases. Urate hydroperoxide oxidizes glutathione and sulfur-containing amino acids and is expected to react fast toward reactive thiols from peroxiredoxins (Prxs). The kinetics for the oxidation of the cytosolic 2-Cys Prx1 and Prx2 revealed that urate hydroperoxide oxidizes these enzymes at rates comparable with hydrogen peroxide. The second-order rate constants of these reactions were 4.9 × 10⁵ and 2.3 × 10⁶ m-1 s-1 for Prx1 and Prx2, respectively. Kinetic and simulation data suggest that the oxidation of Prx2 by urate hydroperoxide occurs by a three-step mechanism, where the peroxide reversibly associates with the enzyme; then it oxidizes the peroxidatic cysteine, and finally, the rate-limiting disulfide bond is formed. Of relevance, the disulfide bond formation was much slower in Prx2 (k3 = 0.31 s-1) than Prx1 (k3 = 14.9 s-1). In addition, Prx2 was more sensitive than Prx1 to hyperoxidation caused by both urate hydroperoxide and hydrogen peroxide. Urate hydroperoxide oxidized Prx2 from intact erythrocytes to the same extent as hydrogen peroxide. Therefore, Prx1 and Prx2 are likely targets of urate hydroperoxide in cells. Oxidation of Prxs by urate hydroperoxide might affect cell function and be partially responsible for the pro-oxidant and pro-inflammatory effects of uric acid.
Keywords: hydrogen peroxide; inflammation; oxidation-reduction (redox); peroxiredoxin; urate hydroperoxide; uric acid.
© 2017 by The American Society for Biochemistry and Molecular Biology, Inc.
Conflict of interest statement
The authors declare that they have no conflicts of interest with the contents of this article
Figures
Similar articles
-
Differential oxidation processes of peroxiredoxin 2 dependent on the reaction with several peroxides in human red blood cells.Biochem Biophys Res Commun. 2019 Oct 22;518(4):685-690. doi: 10.1016/j.bbrc.2019.08.108. Epub 2019 Aug 28. Biochem Biophys Res Commun. 2019. PMID: 31472963
-
Kinetics of peroxiredoxins and their role in the decomposition of peroxynitrite.Subcell Biochem. 2007;44:83-113. doi: 10.1007/978-1-4020-6051-9_5. Subcell Biochem. 2007. PMID: 18084891 Review.
-
Chemical Characterization of Urate Hydroperoxide, A Pro-oxidant Intermediate Generated by Urate Oxidation in Inflammatory and Photoinduced Processes.Chem Res Toxicol. 2015 Aug 17;28(8):1556-66. doi: 10.1021/acs.chemrestox.5b00132. Epub 2015 Aug 5. Chem Res Toxicol. 2015. PMID: 26207674
-
Hyperoxidation of peroxiredoxins 2 and 3: rate constants for the reactions of the sulfenic acid of the peroxidatic cysteine.J Biol Chem. 2013 May 17;288(20):14170-14177. doi: 10.1074/jbc.M113.460881. Epub 2013 Mar 29. J Biol Chem. 2013. PMID: 23543738 Free PMC article.
-
Peroxiredoxin 2 and peroxide metabolism in the erythrocyte.Antioxid Redox Signal. 2008 Sep;10(9):1621-30. doi: 10.1089/ars.2008.2081. Antioxid Redox Signal. 2008. PMID: 18479207 Review.
Cited by
-
Differential parameters between cytosolic 2-Cys peroxiredoxins, PRDX1 and PRDX2.Protein Sci. 2019 Jan;28(1):191-201. doi: 10.1002/pro.3520. Epub 2018 Nov 12. Protein Sci. 2019. PMID: 30284335 Free PMC article.
-
Bioinformatic Analyses of Peroxiredoxins and RF-Prx: A Random Forest-Based Predictor and Classifier for Prxs.Methods Mol Biol. 2022;2499:155-176. doi: 10.1007/978-1-0716-2317-6_8. Methods Mol Biol. 2022. PMID: 35696080 Free PMC article.
-
Prdx1 Interacts with ASK1 upon Exposure to H2O2 and Independently of a Scaffolding Protein.Antioxidants (Basel). 2021 Jun 30;10(7):1060. doi: 10.3390/antiox10071060. Antioxidants (Basel). 2021. PMID: 34209102 Free PMC article.
-
Inhibition of HDAC6 Activity Alleviates Myocardial Ischemia/Reperfusion Injury in Diabetic Rats: Potential Role of Peroxiredoxin 1 Acetylation and Redox Regulation.Oxid Med Cell Longev. 2018 Jun 25;2018:9494052. doi: 10.1155/2018/9494052. eCollection 2018. Oxid Med Cell Longev. 2018. PMID: 30046381 Free PMC article.
-
Unraveling the effects of uric acid on endothelial cells: A global proteomic study.Redox Biol. 2025 May;82:103625. doi: 10.1016/j.redox.2025.103625. Epub 2025 Apr 1. Redox Biol. 2025. PMID: 40203480 Free PMC article.
References
-
- Simic M. G., and Jovanovic S. V. (1989) Antioxidation mechanisms of uric acid. J. Am. Chem. Soc. 111, 5778–5782
-
- Oda M., Satta Y., Takenaka O., and Takahata N. (2002) Loss of urate oxidase activity in hominoids and its evolutionary implications. Mol. Biol. Evol. 19, 640–653 - PubMed
-
- Becker B. F. (1993) Towards the physiological function of uric acid. Free Radic. Biol. Med. 14, 615–631 - PubMed
-
- Domazou A. S., Zhu H., and Koppenol W. H. (2012) Fast repair of protein radicals by urate. Free Radic. Biol. Med. 52, 1929–1936 - PubMed
Publication types
MeSH terms
Substances
LinkOut - more resources
Full Text Sources
Other Literature Sources
Research Materials
Miscellaneous
