. 2017 Jun 1;129(22):2959-2970.
doi: 10.1182/blood-2016-08-736454. Epub 2017 Mar 27.

Inhibition of WNT signaling in the bone marrow niche prevents the development of MDS in the Apcdel/+ MDS mouse model

Affiliations

Inhibition of WNT signaling in the bone marrow niche prevents the development of MDS in the Apcdel/+ MDS mouse model

Angela Stoddart et al. Blood. .

Abstract

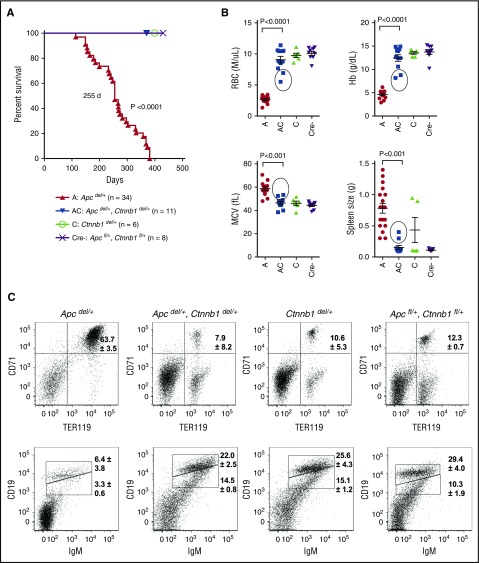
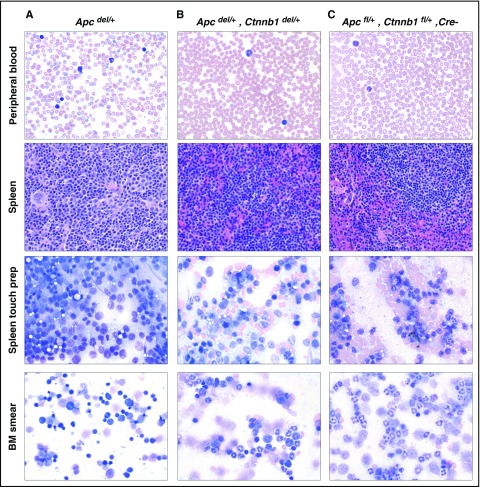
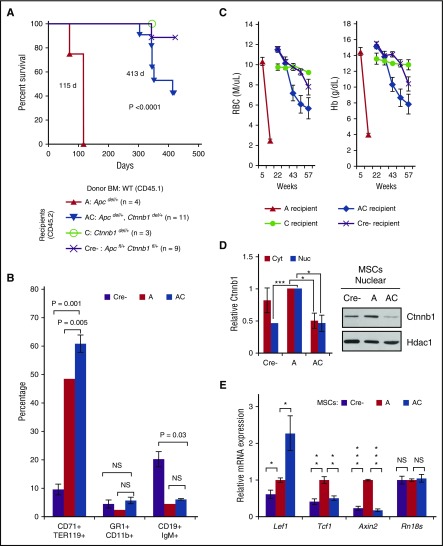
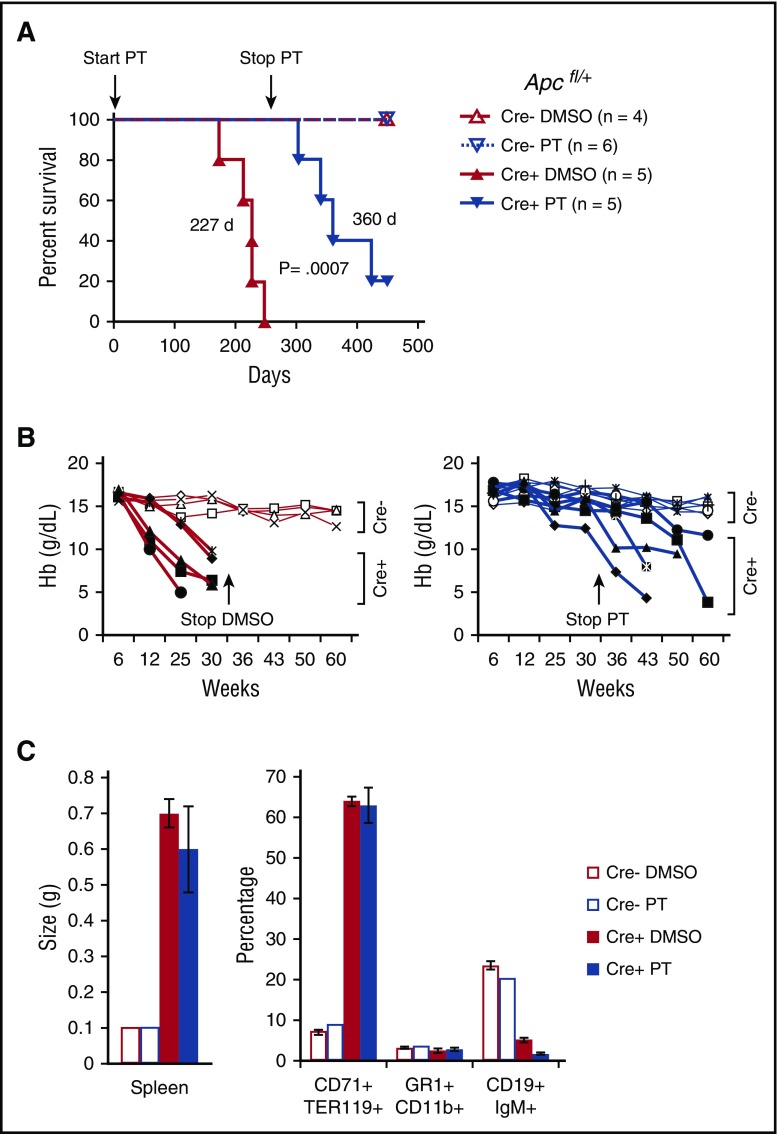
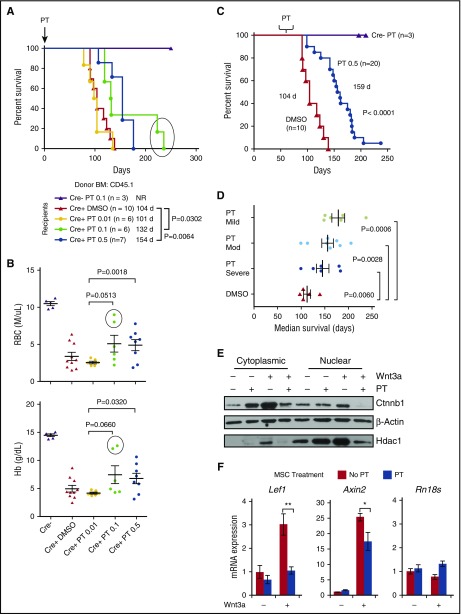
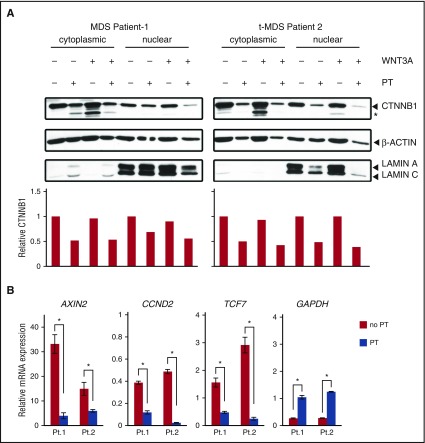
There is accumulating evidence that functional alteration(s) of the bone marrow (BM) microenvironment contribute to the development of some myeloid disorders, such as myelodysplastic syndrome (MDS) and acute myeloid leukemia (AML). In addition to a cell-intrinsic role of WNT activation in leukemia stem cells, WNT activation in the BM niche is also thought to contribute to the pathogenesis of MDS and AML. We previously showed that the Apc-haploinsufficient mice (Apcdel/+ ) model MDS induced by an aberrant BM microenvironment. We sought to determine whether Apc, a multifunctional protein and key negative regulator of the canonical β-catenin (Ctnnb1)/WNT-signaling pathway, mediates this disease through modulating WNT signaling, and whether inhibition of WNT signaling prevents the development of MDS in Apcdel/+ mice. Here, we demonstrate that loss of 1 copy of Ctnnb1 is sufficient to prevent the development of MDS in Apcdel/+ mice and that altered canonical WNT signaling in the microenvironment is responsible for the disease. Furthermore, the US Food and Drug Administration (FDA)-approved drug pyrvinium delays and/or inhibits disease in Apcdel/+ mice, even when it is administered after the presentation of anemia. Other groups have observed increased nuclear CTNNB1 in stromal cells from a high frequency of MDS/AML patients, a finding that together with our results highlights a potential new strategy for treating some myeloid disorders.


Figures

Figure 1.
Figure 1.
Loss of 1 copy of Ctnnb1 is sufficient to prevent fatal macrocytic anemia in Apcdel/+ mice. (A) Kaplan-Meier survival curves for Apcdel/+ (A; n = 34), Apcdel/+, Ctnnb1del/+ (AC; n = 11), Ctnnb1del/+ (C; n = 6), and Apcfl/+, Ctnnb1fl/+ (Cre; n = 8) control mice. The median survival of Apcdel/+ mice was 255 days (previously published by Stoddart et al); thus, the A and AC mice were not littermates in this figure. All other mouse cohorts, monitored monthly for the development of macrocytic anemia, survived until the end of the study (∼400 days) (B) RBC parameters from complete blood counts (CBCs) and spleen size. CBCs and spleen size for Apcdel/+ mice were measured at the time of sacrifice, and for the other 3 cohorts were measured at the end of the study (∼400 days). Circles represent 2 Apcdel/+, Ctnnb1del/+ mice that displayed moderate anemia and splenomegaly at the end of the study, suggestive of the onset of MDS. (C) Representative flow cytometric analysis of erythroid (CD71+Ter119+) and B cells (CD19+IgM+) in spleen isolated from mice for each cohort. Shown is the average percentage of CD71+Ter119+ erythroblasts and CD19loIgM+ (immature) and CD19hiIgM+ (mature) B cells from at least 3 mice from each cohort. In contrast to Apcdel/+ mice, 9 of 11 Apcdel/+, Ctnnb1del/+ mice (82%) had a normal distribution of erythroid cells and B cells in the spleen, similar to controls. Analysis of the 2 exceptional Apcdel/+, Ctnnb1del/+ mice with splenomegaly and moderate anemia is shown in supplemental Table 2. MCV, mean corpuscular volume.
Figure 2.
Figure 2.
Decreasing Ctnnb1 levels in Apcdel/+ mice reverses the MDS phenotype. Histology of hematopoietic tissues from a representative Apcdel/+ mouse (A, mouse 3938) euthanized when displaying severe signs of anemia (241 days) vs an Apcdel/+, Ctnnb1del/+ mouse (B, mouse 8455), and an Apcfl/+, Ctnnb1fl/+, Cre mouse (C, mouse 8740) euthanized at the end of the study (∼400 days). All images were obtained using an Olympus BX41 microscope (Melville, NY) and a 50×/0.9 (oil) or 40×/0.9 objective. Images were processed with Adobe Photoshop (San Jose, CA). Peripheral blood smears, BM smears, and spleen touch preparations were stained with Wright-Giemsa (original magnification ×500), and spleen sections were stained with hematoxylin and eosin (H&E; original magnification ×400).
Figure 3.
Figure 3.
Loss of 1 copy of Ctnnb1 in an Apc-haploinsufficient microenvironment prevents or delays the development of MDS by 8 to 10 months. (A) Kaplan-Meier survival curves for Apcdel/+ (A; n = 4), Apcdel/+, Ctnnb1del/+ (AC; n = 11), Ctnnb1del/+ (C; n = 3), and Apcfl/+, Ctnnb1fl/+ (Cre; n = 9) recipient mice. Median survival of Apcdel/+ and Apcdel/+, Ctnnb1del/+ recipient mice was significantly different (115 vs 413 days; P < .0001). All control mice (C and Cre) survived until the end of the study, with the exception of 1 Apcfl/+, Ctnnb1fl/+ recipient that died at 343 days, likely due to a hemorrhagic renal cyst. (B) Percentage of CD71+Ter119+ erythroid cells, Gr1+CD11b+ myeloid cells, and CD19+IgM+ B cells in spleen isolated from Cre (∼400 days), A (70-115 days), and AC (303-413 days) recipients that eventually displayed a fatal anemia. At sacrifice, the AC cell populations were more similar to A than Cre recipients. (C) RBC and Hb counts in all 4 cohorts over time. The development of anemia is delayed in AC recipients after 35 weeks (a point in time when all A recipients have already been sacrificed due to severe anemia). In Cre control recipients, 2 mice developed moderate anemia at 57 weeks. However, 1 mouse had an apparent colorectal tumor, and the other had a hemorrhagic renal cyst; neither had developed MDS. (D) MSCs were isolated from Cre (control), A, and AC littermates 2 months posttreatment with pIpC to induce Cre-mediated deletion, and before development of disease. Following in vitro Wnt3a stimulation for 6 hours, nuclear and cytoplasmic fractions were isolated and immunoblotted with Ctnnb1, β-actin (cytoplasmic), and Hdac1 (nuclear) antibodies. Quantification of 3 independent experiments shows increased nuclear and cytoplasmic Ctnnb1 protein expression in Apcdel/+ MSCs that is reduced by ∼50% upon haploinsufficient loss of Ctnnb1. (E) RNA was isolated from Cre, A, and AC MSCs (no Wnt3a stimulation), transcribed to complementary DNA (cDNA), and PCRs (run in triplicate) were quantified using Fast-SYBR Green. Gene expression was normalized to Gapdh and data are presented as mean ± standard error of the mean (SEM) of 3 independent experiments. ***P < .0001, **P < .001, *P < .05. NS, not significant.
Figure 4.
Figure 4.
Pharmacological inhibition of WNT signaling using pyrvinium prevents the development of MDS in Apcdel/+ mice. (A) Mx1-CreApcfl/+ (Cre) or Mx1-Cre+Apcfl/+ (Cre+, also referred to as Apcdel/+) were injected IP for 300 days with 0.1 mg/kg PT or vehicle (DMSO) twice per week (beginning when Apc deletion was induced at 2 months of age). Kaplan-Meier survival curves of Cre and Cre+ mice treated with PT or DMSO are shown. DMSO-treated Cre+ mice died with a median survival of 227 days. PT-treated Cre+ mice did not develop disease as long as PT was administered; however, they slowly developed a severe anemia after PT was withdrawn and survived for a median of 360 days (DMSO 227 days vs PT 360 days; P = .0007). Cre mice, treated with PT or vehicle, survived until the end of the study indicating no major adverse effects from PT administration. (B) Hb counts from Cre (open symbols) and Cre+ (solid black symbols) mice injected with DMSO (left) or PT (right) over time. Injections were stopped at 35 weeks, after all DMSO-treated Cre+ were sacrificed. None of the PT-treated Cre+ mice were anemic at 35 weeks (with the exception of mouse 8493, which was mildly anemic with a Hb of ∼10 g/dL). However, following cessation of PT treatment, anemia slowly developed at varying rates in all PT-treated Cre+ mice. (C) Spleen size and percentage of CD71+Ter119+ erythroid cells, Gr1+Cd11b+ myeloid cells, and CD19+IgM+ B cells in spleen isolated from DMSO-treated Cre (450 days) or Cre+ (173-248 days) mice or PT-treated Cre (450 days) or Cre+ (304-449 days) mice. After PT cessation, PT-treated Cre+ mice eventually developed splenomegaly with marked erythroid proliferation and effacement of B lymphoid cells, indicators of the MDS seen in the DMSO-treated Cre+ mice.
Figure 5.
Figure 5.
Pyrvinium modulation of WNT signaling is more effective before the onset of moderate-severe anemia. (A) Two-month-old Mx1-CreApcfl/+ (Cre) or Mx1-Cre+Apcfl/+ (Cre+, also referred to as Apcdel/+) recipients were treated with pIpC (to induce Apc deletion) and vehicle (DMSO) or PT 2 weeks before lethal irradiation and transplantation with WT (CD45.1) BM cells. Mice were injected twice per week with 0.01, 0.1, or 0.5 mg/kg PT or DMSO until sacrifice. Kaplan-Meier curves for overall survival show that mice treated with 0.1 mg/kg or 0.5 mg/kg PT survived about 1 to 2 months longer than vehicle-treated mice (P = .0302 and P = .0064, respectively). (B) RBC and Hb counts of DMSO and PT-treated mice at ∼100 days posttransplant (for some mice in the DMSO and 0.01 mg/kg PT groups, counts from <100 days were plotted since they died before 100 days). The RBC and Hb counts of 0.5 mg/kg PT-treated mice were higher than 0.01 mg/kg PT-treated mice, indicating the administration of 0.5 mg/kg PT delays development of anemia (P = .0018 and P = .0320). The 2 mice in the 0.1 mg/kg PT-treated group that survived beyond 200 days had noticeably higher RBC and Hb counts at 100 days (circled). (C) Cre+ recipients were treated with 0.5 mg/kg PT once they developed mild (Hb, 12-13.5 g/dL), moderate (Hb, 10-11.5 g/dL), or severe anemia (Hb, <10 g/dL). A Kaplan-Meier survival curve of all PT-treated mice indicates survival is extended by almost 2 months (DMSO vs PT: 104 days vs 159 days; P < .0001). (D) The average median survival of recipients from the mild, moderate, and severe anemia group vs the DMSO-treated control group is shown. A longer survival is achieved if treatment is started before the onset of severe anemia. (E) MSCs were isolated from Apcdel/+mice ∼2 months post-pIpC-induced deletion and before development of disease. MSCs were treated with or without 50 ng/mL Wnt3a ± 50 nM PT, as indicated, for 16 hours. A representative immunoblot of nuclear and cytoplasmic fractions immunoblotted with Ctnnb1, β-actin (cytoplasmic), and Hdac1 (nuclear) is shown. In 3 independent experiments, PT treatment decreased Wnt3a-mediated elevation of Ctnnb1 by 56% ± 11.5% (P = .04). (F) Apcdel/+ MSCs were stimulated in vitro ± 50 ng/mL Wnt3a ± 50 nM PT for 16 hours. RNA was isolated and transcribed to cDNA, and PCRs (run in triplicate) were quantified using Fast-SYBR Green. Gene expression was normalized to Gapdh and data are presented as mean ± SEM of 3 independent experiments. **P < .001, *P < .05. NR, not reached.
Figure 6.
Figure 6.
Pyrvinium suppresses WNT activation in MSCs isolated from patients with myeloid neoplasms with a del(5q). (A) MSCs were isolated from the BM of 2 del(5q) patients with primary MDS or t-MDS and were treated in vitro with or without 50 ng/mL WNT3A ± 50 nM PT, as indicated, for 16 hours. Nuclear and cytoplasmic fractions were isolated and immunoblotted with antibodies specific for CTNNB1, β-actin, and Lamin A/C. Quantitation of the immunoblots revealed a ∼50% reduction in CTNNB1 levels in samples treated with PT. *A smaller CTNNB1 degradation product. (B) Patient MSCs were treated with WNT3A ± 50 nM PT for 16 hours. RNA was isolated and transcribed to cDNA, and PCRs (run in triplicate) were quantified using Fast-SYBR Green. Gene expression was normalized to the ACTB gene and data are presented as mean ± SEM of 1 patient sample, run in triplicate. PT significantly decreased WNT3A-mediated transcription of WNT target genes, but not the control GAPDH gene. *P < .05. Increased GAPDH may reflect emerging evidence suggesting that GAPDH gene expression can be modulated by external factors.

Comment in

  • Hacking the stem cell niche.
    Lane SW, Heidel FH. Lane SW, et al. Blood. 2017 Jun 1;129(22):2951-2952. doi: 10.1182/blood-2017-04-777789. Blood. 2017. PMID: 28572172 No abstract available.

Similar articles

Cited by

References

    1. Tefferi A, Vardiman JW. Myelodysplastic syndromes. N Engl J Med. 2009;361(19):1872-1885. - PubMed
    1. Jerez A, Gondek LP, Jankowska AM, et al. . Topography, clinical, and genomic correlates of 5q myeloid malignancies revisited. J Clin Oncol. 2012;30(12):1343-1349. - PMC - PubMed
    1. Smith SM, Le Beau MM, Huo D, et al. . Clinical-cytogenetic associations in 306 patients with therapy-related myelodysplasia and myeloid leukemia: the University of Chicago series. Blood. 2003;102(1):43-52. - PubMed
    1. Bejar R, Stevenson K, Abdel-Wahab O, et al. . Clinical effect of point mutations in myelodysplastic syndromes. N Engl J Med. 2011;364(26):2496-2506. - PMC - PubMed
    1. Haferlach T, Nagata Y, Grossmann V, et al. . Landscape of genetic lesions in 944 patients with myelodysplastic syndromes. Leukemia. 2014;28(2):241-247. - PMC - PubMed

MeSH terms