. 2017 Jun;27(6):934-946.
doi: 10.1101/gr.213983.116. Epub 2017 Mar 27.

Combinatorial DNA methylation codes at repetitive elements

Affiliations

Combinatorial DNA methylation codes at repetitive elements

Christophe Papin et al. Genome Res. 2017 Jun.

Abstract

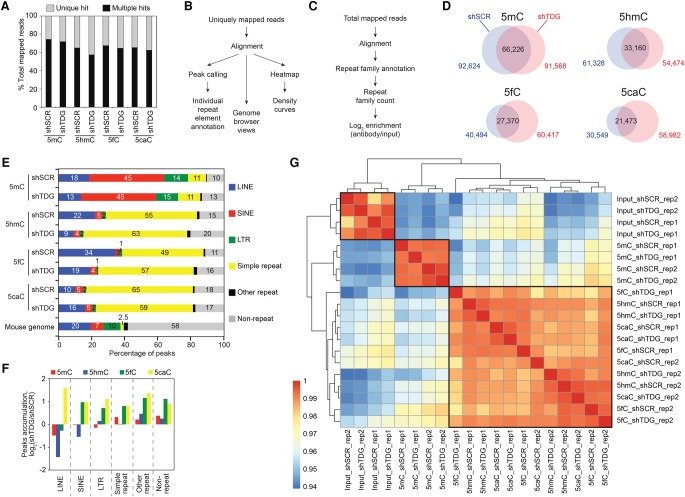
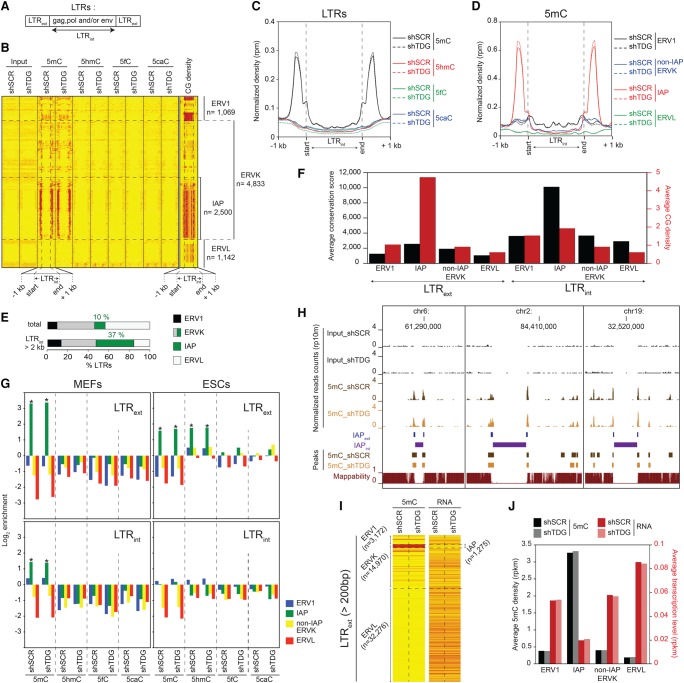
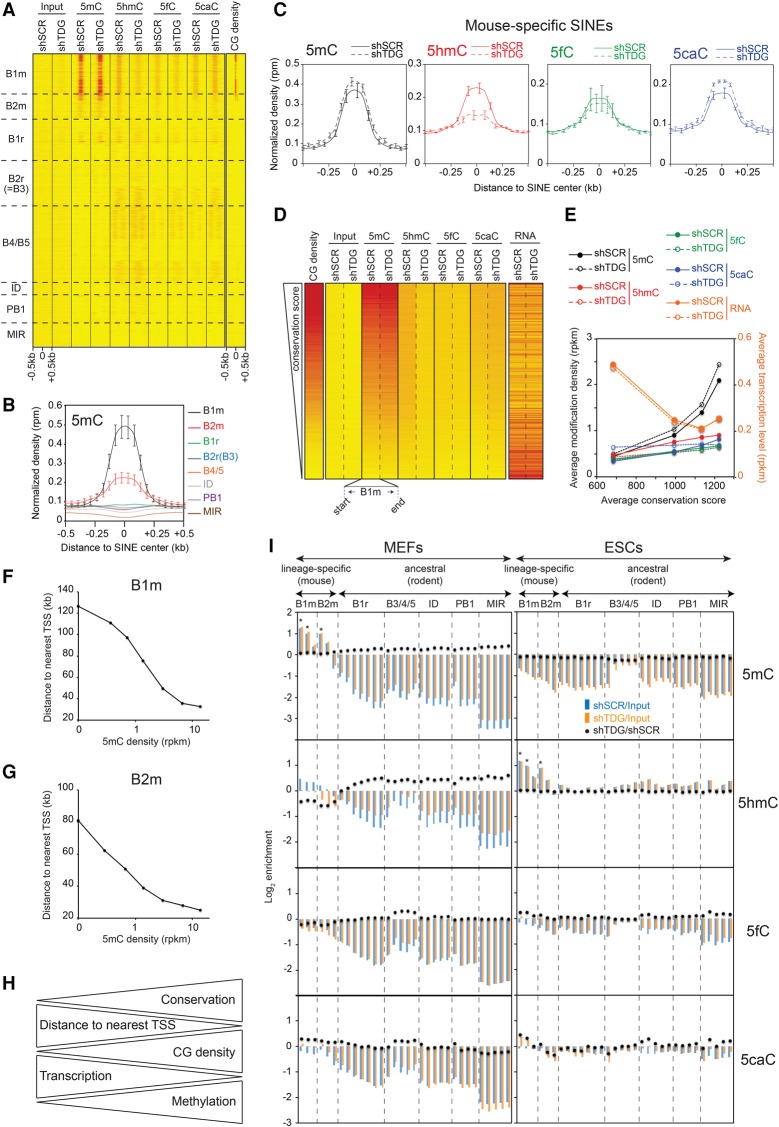
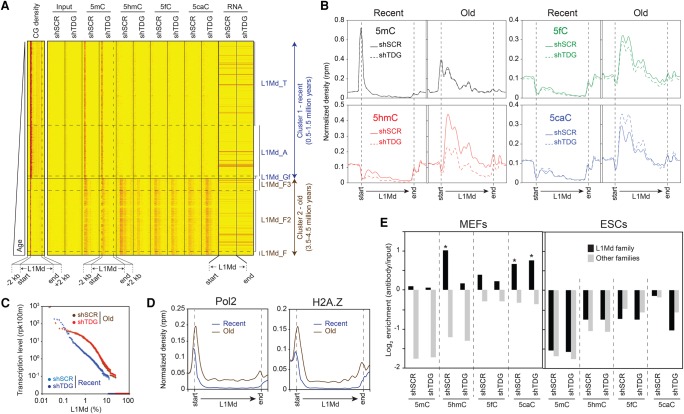
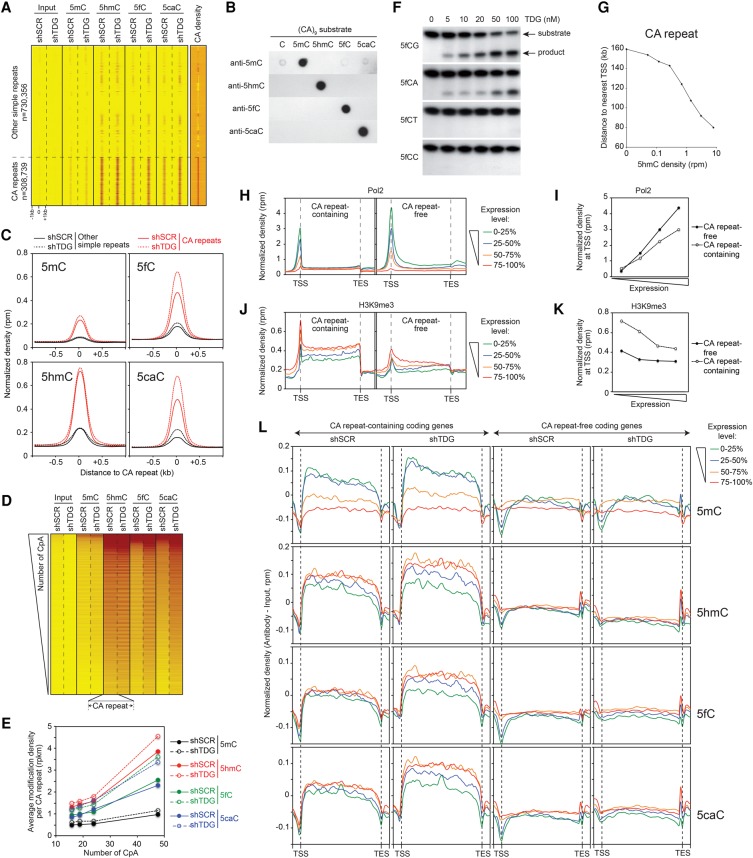
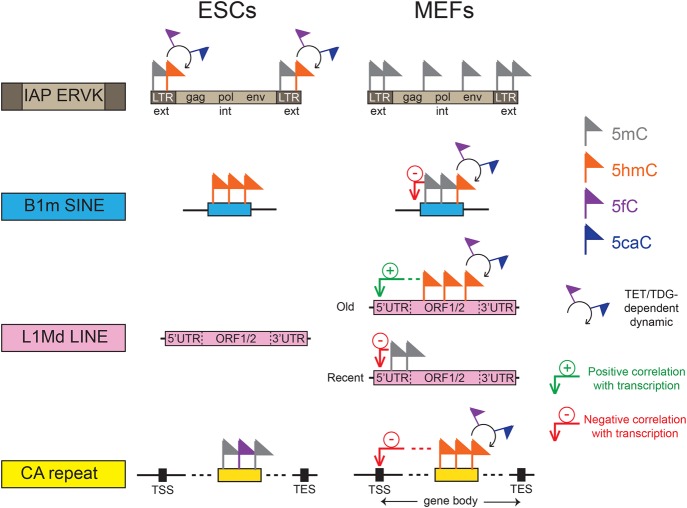
DNA methylation is an essential epigenetic modification, present in both unique DNA sequences and repetitive elements, but its exact function in repetitive elements remains obscure. Here, we describe the genome-wide comparative analysis of the 5mC, 5hmC, 5fC, and 5caC profiles of repetitive elements in mouse embryonic fibroblasts and mouse embryonic stem cells. We provide evidence for distinct and highly specific DNA methylation/oxidation patterns of the repetitive elements in both cell types, which mainly affect CA repeats and evolutionarily conserved mouse-specific transposable elements including IAP-LTRs, SINEs B1m/B2m, and L1Md-LINEs. DNA methylation controls the expression of these retroelements, which are clustered at specific locations in the mouse genome. We show that TDG is implicated in the regulation of their unique DNA methylation/oxidation signatures and their dynamics. Our data suggest the existence of a novel epigenetic code for the most recently acquired evolutionarily conserved repeats that could play a major role in cell differentiation.


Figures

Figure 1.
Figure 1.
Preferential accumulation of 5mC, 5hmC, 5fC, and 5caC at repetitive elements in MEFs. (A) Percentages of uniquely mapped and multihit reads in total mapped reads (average of two replicates). (B,C) Flowchart of computational analyses used in this study using uniquely mapped reads (B) and including multihit mapped reads (C). (D) Venn diagrams showing the overlap between 5mC, 5hmC, 5fC, and 5caC peaks in control (shSCR) and Tdg-deficient MEFs (shTDG). (E) Percentages of peaks overlapping with repetitive elements using the UCSC RepeatMasker database. (F) Bar graph representation of the peak accumulation (fold change, fc = log2-ratio shTDG/shSCR) at repetitive elements in response to Tdg knockdown in MEFs. (G) Heatmaps with hierarchical clustering showing Spearman's rank correlations between all pairwise comparisons. Spearman correlations were calculated using the raw read count across all types of repeats analyzed. Note that the 5hmC, 5fC and 5caC profiles were closely clustered.
Figure 2.
Figure 2.
Specific DNA methylation profiles at recently integrated IAP LTRs in MEFs and ESCs. (A) RepeatMasker database distinguishes within the LTR family elements corresponding to the external terminal repeats (LTRext) from those corresponding to the internal coding regions (LTRint). (B) Heatmaps of 5mC/5hmC/5fC/5caC/CG densities at full-length LTRs (LTRint > 2 kb) in control and Tdg-deficient MEFs. Tag densities were collected in 50-bp sliding windows spanning 1 kb (divided in 15 bins) of the length-normalized LTRint (divided in 30 bins). LTR retroelements were sorted by families. (C) Average 5mC/5hmC/5fC/5caC signals in control and Tdg-deficient MEFs at LTRs. (D) 5mC densities for the indicated LTR families in control and Tdg-deficient MEFs. (E) Distribution of LTR classes in the mouse genome (total or full-length retroelements). (F) Average conservation score (black columns) and CG density (number of CpG dinucleotides per 100 bases, red columns) of LTRext (left) and LTRint (right) elements. (G) Relative enrichment for each cytosine modification in MEFs (left) and ESCs (right) at the indicated LTR families (LTRext regions, upper; LTRint regions, lower). Note the significant enrichment of 5hmC at LTRext IAP in ESCs. (*) P-value <0.05. (H) Genome browser views showing the lack of mappability at IAPint elements. (I) Heatmaps of average 5mC densities and transcription levels at LTRext elements (length >200 bp) in control and Tdg-deficient MEFs. (J) Histogram showing the negative correlation between methylation density and transcription level of LTRext elements in control and Tdg-deficient MEFs.
Figure 3.
Figure 3.
Specific TDG-dependent DNA methylation dynamics at the evolutionarily youngest SINEs. (A) Heatmaps of 5mC/5hmC/5fC/5caC/CG densities at SINEs (n = 1,511,580), sorted by family. Tags were counted within 500 bp around the SINE center. (B) 5mC densities in control MEFs for the indicated SINE families. (C) Average 5mC/5hmC/5fC/5caC signals in control and Tdg-deficient MEFs at mouse-specific SINEs. (B,C) Values represent means of two biological replicates. Error bars represent the range of the duplicate values. (D) Heatmaps of average 5mC/5hmC/5fC/5caC/CG densities and transcription levels in control and Tdg-deficient MEFs at B1m retroelements ranked by conservation score (n = 185,667). (E) Curves representing cytosine modification densities and transcription levels of B1m SINEs as a function of their conservation. B1m retroelements were sorted into quartiles based on their conservation score. Note the negative correlation between the methylation density and the transcription level of B1m SINEs. (F,G) Average distance to TSS of B1m (F) and B2m (G) elements as a function of their 5mC density. (H) Diagram illustrating the relationship between DNA methylation, CG density, transcription level, and distance to TSS for the mouse-specific B1m and B2m families. (I) Relative enrichment for each cytosine modification at each SINE subfamily in control and Tdg-deficient MEFs (left) and ESCs (right). SINE subfamilies were sorted in two groups relative to their appearance in the rodent lineage, the mouse-specific group and the ancestral group (common in rodents). Note that mouse-specific SINEs are specifically hypermethylated in MEFs but hydroxymethylated in ESCs. (*) P-value <0.05.
Figure 4.
Figure 4.
Distinct TDG-dependent DNA methylation patterns at full-length L1Md. (A) Heatmaps of 5mC/5hmC/5fC/5caC/CG densities and transcription levels in control and Tdg-deficient MEFs at full-length L1Md elements (length > 5 kb, n = 12,916), sorted relative to their appearance in the mouse genome. Tag densities were collected in 50-bp sliding windows spanning 2 kb (divided in 10 bins) of the length-normalized L1Md (divided in 40 bins). Two distinct clusters are identified: cluster 1, containing the youngest subfamilies L1Md_T, L1Md_A, and L1Mf_Gf (0.5–1.5 million years old); and cluster 2, containing the oldest subfamilies L1Md_F, L1Md_F2, and L1Md_F3 (3.5–4.5 million years old). (B) Average 5mC/5hmC/5fC/5caC signals at L1Md in control and Tdg-deficient MEFs reveal two distinct profiles. The evolutionarily recent L1Md subfamilies contain a hypermethylated 5′ UTR region, whereas the oldest subfamilies show a TDG-dependent dynamic of 5mC oxidation derivatives along their coding sequence. (C) Transcription levels of each individual element of the recent and old L1Md subfamilies in control and Tdg-deficient MEFs. (D) Normalized densities of Pol2 (left), H2A.Z (right) at recent (T/A/Gf), and old (F/F2/F3) L1Md subfamilies. (E) Relative enrichment for each cytosine modification at indicated LINE families in control and Tdg-deficient MEFs (left) and ESCs (right). (*) P-value <0.05.
Figure 5.
Figure 5.
DNA methylation dynamics at CA repeats. (A) Heatmaps of 5mC/5hmC/5fC/5caC/CA densities in control and Tdg-deficient MEFs at simple repeats sorted by family. Note the specific enrichment of 5mC oxidation derivatives at CA repeats. Tags were counted within 1 kb around the simple repeat center. (B) Anti-5mC, anti-5hmC, anti-5fC, and anti-5caC antibodies do not recognize CA repeats nonspecifically. Dot blot assays showing that 5mC, 5hmC, 5fC, and 5caC antibodies specifically recognize 5mC, 5hmC, 5fC, and 5caC-containing substrates, respectively in (CA)9 repeat contexts. (C) Average 5mC/5hmC/5fC/5caC signals at CA repeats reveal a specific accumulation of 5fC and 5caC in the absence of TDG. (D) Heatmaps of 5mC/5hmC/5fC/5caC levels in control and Tdg-deficient MEFs at CA repeats ranked in descending order based on their number of CpA dinucleotides. (E) Curves showing the positive correlation between cytosine modification densities and CA densities at CA repeats. CA repeats were sorted in quartiles based on their number of CpA dinucleotides. (F) In vitro glycosylase assays revealing that the recombinant protein TDG excises formylcytosine exclusively in a CpG or CpA context. (G) Average distance to TSS of CA repeats as a function of their 5hmC level. (HK) Normalized densities of Pol2 (H,I) and H3K9me3 (J,K) within gene bodies (H,J) or at TSSs (I,K) expressed at different levels. Genes were sorted into two groups according to the presence or the absence of CA repeats (length >100 bp) within their gene body (CA repeat-containing and CA repeat-free, respectively). Tag densities were collected in 100-bp sliding windows spanning 2 kb (divided in 10 bins) of the length-normalized gene bodies (divided in 40 bins). Within both groups, genes were then sorted in quartiles according to their expression level. (L) Average 5mC/5hmC/5fC/5caC signals in control and Tdg-deficient MEFs within CA repeat-containing and CA repeat-free gene bodies expressed at different levels. Tag densities were collected in 100-bp sliding windows spanning 2 kb (divided in five bins) of the length-normalized gene bodies (divided in 50 bins).
Figure 6.
Figure 6.
Combinatorial DNA methylation code at repetitive elements. Diagram summarizing the TDG-dependent DNA methylation dynamics at repetitive elements in MEFs and ESCs, which affect essentially both the CA repeats and the evolutionarily youngest mouse-specific transposable elements including IAP LTRs, B1m SINEs, and L1Md LINEs.

References

    1. Anders S, Huber W. 2010. Differential expression analysis for sequence count data. Genome Biol 11: R106. - PMC - PubMed
    1. Baba Y, Huttenhower C, Nosho K, Tanaka N, Shima K, Hazra A, Schernhammer ES, Hunter DJ, Giovannucci EL, Fuchs CS, et al. 2010. Epigenomic diversity of colorectal cancer indicated by LINE-1 methylation in a database of 869 tumors. Mol Cancer 9: 125–141. - PMC - PubMed
    1. Burns KH, Boeke JD. 2012. Human transposon tectonics. Cell 149: 740–752. - PMC - PubMed
    1. Castro-Diaz N, Ecco G, Coluccio A, Kapopoulou A, Yazdanpanah B, Friedli M, Duc J, Jang SM, Turelli P, Trono D. 2014. Evolutionally dynamic L1 regulation in embryonic stem cells. Genes Dev 28: 1397–1409. - PMC - PubMed
    1. Cordaux R, Batzer MA. 2009. The impact of retrotransposons on human genome evolution. Nat Rev Genet 10: 691–703. - PMC - PubMed

Publication types

MeSH terms