Review
. 2017 Oct 3;7(10):a029702.
doi: 10.1101/cshperspect.a029702.

Rate Coding and the Control of Muscle Force

Affiliations
Review

Rate Coding and the Control of Muscle Force

Roger M Enoka et al. Cold Spring Harb Perspect Med. .

Abstract

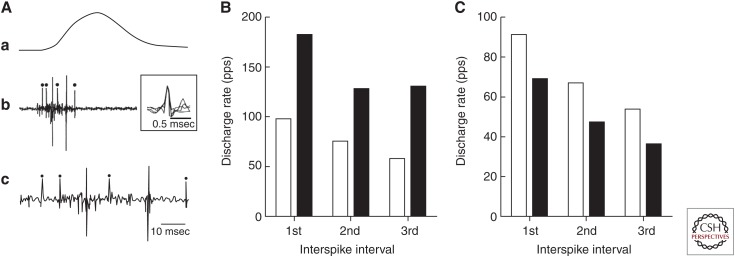
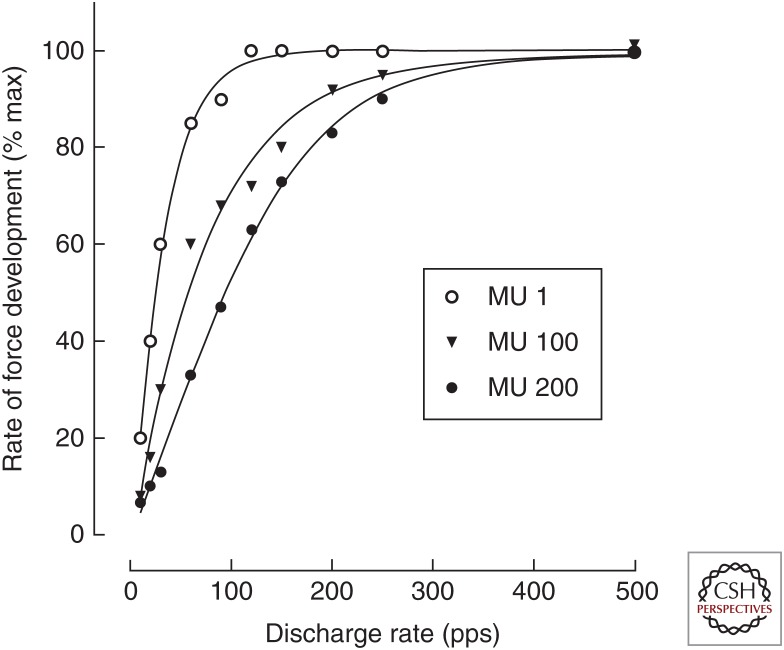
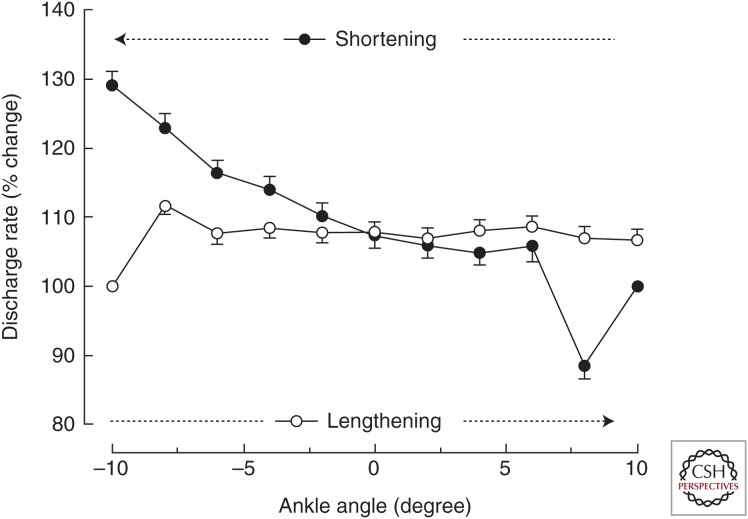
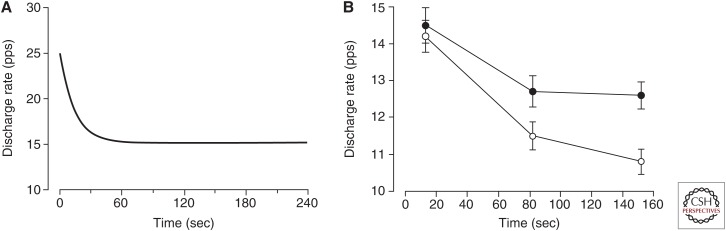
The force exerted by a muscle during a voluntary contraction depends on the number of motor units recruited for the action and the rates at which they discharge action potentials (rate coding). Over most of the operating range of a muscle, the nervous system controls muscle force by varying both motor unit recruitment and rate coding. Except at relatively low forces, however, the control of muscle force depends primarily on rate coding, especially during fast contractions. This review provides five examples of how the modulation of rate coding influences the force exerted by muscle during voluntary actions. The five examples comprise fast contractions, lengthening and shortening contractions, steady isometric contractions, fatiguing contractions, and contractions performed after a change in the daily level of physical activity.


Figures

Figure 1.
Figure 1.
Discharge rates of motor units during ballistic contractions. (A) Action potentials discharged by a single motor unit in tibialis anterior during a ballistic contraction with the ankle dorsiflexor muscles by an untrained subject. The peak force achieved during the submaximal contraction was ∼40% of maximal voluntary contraction (MVC). Traces correspond to the ankle dorsiflexor force (a) and intramuscular electromyogram (EMG) plotted at slow (b) and fast (c) speeds. The typical discharge times for tibialis anterior motor units in an untrained person comprised a brief interval between the first two action potentials followed by longer interspike intervals. The dots indicate the discharge of the same motor unit as indicated by the superimposed traces (b). (B) Average maximal discharge rates for the first three interspike intervals (see trace c in panel A) during ballistic contractions for tibialis anterior motor units before (white bar) and after 3 months of training (black bar) with rapid contractions (data from Van Cutsem et al. 1998). (C) Average maximal discharge rate for the first three interspike intervals during ballistic contractions for the tibialis anterior motor units in young (white bar) and older adults (black bar) (data from Klass et al. 2008a). pps, Pulses per second.
Figure 2.
Figure 2.
Simulated relations between motor unit discharge rate and maximal rate of force development for motor units (MUs) in the tibialis anterior muscle. The model comprised 200 motor units. The data indicate the relations for the smallest (MU 1), largest (MU 200), and middle (MU 100) motor units. The simulation was based on a model developed by Fuglevand et al. (1993) with the contractile properties of the motor units adjusted to match values measured experimentally for tibialis anterior (Van Cutsem et al. 1998). The force generated by each motor unit was simulated for four successive discharge times generated at constant frequencies ranging from 10 to 500 pps before the first derivative was computed to obtain the maximal rate of force development (data from Duchateau and Baudry 2014). pps, Pulses per second.
Figure 3.
Figure 3.
Average (±SEM) discharge rate of motor units (n = 63) in tibialis anterior during slow (10 degrees/sec) shortening and lengthening contractions. The shortening contraction (filled circles) began from a long muscle length (10 degrees), whereas the lengthening (open circles) contraction began from a short muscle length (–10 degrees). Each action began with an isometric contraction before the torque motor that controlled the angular displacement of a footplate either allowed the dorsiflexors to shorten or generated a torque that was sufficient to lengthen the activated muscles. The discharge rate at each joint angle averaged more than 0.2-sec bins for all motor units and was expressed relative to the value recorded during the initial isometric contraction (data from Pasquet et al. 2006).
Figure 4.
Figure 4.
Declines in motor unit discharge rate during prolonged activation. (A) Decrease in discharge rate for a cat motor neuron that was activated by sustained intracellular current injection. The motor neuron innervated the medial gastrocnemius muscle. The injected current was ∼5 nA greater than the amplitude required to elicit the repetitive discharge of action potentials. The gradual decline in discharge rate that began a few seconds after the onset of stimulation and lasted for ∼30 sec is known as “late adaptation” (Kernell and Monster 1982). (B) Decrease in discharge for motor units in biceps brachii (n = 64) during submaximal isometric contractions with the elbow flexor muscles. Average target force was ∼25% maximal voluntary contraction (MVC). In one condition (filled circles), the participant was required to match the target force displayed on a monitor for a prescribed duration. In the other condition (open circles), the participant generated the same net muscle torque about the elbow joint and was required to maintain a constant elbow joint angle for the same duration by matching the measured joint angle to the target displayed on the monitor (data from Mottram et al. 2005 and Gould et al. 2016). pps, Pulses per second.
Figure 5.
Figure 5.
Adaptations in the contractile properties of motor units after several weeks of limb immobilization. (A) Relation between peak force and time to peak force for motor units in the first dorsal interosseus muscle as estimated with spike-triggered averaging before (control) and after 6–8 wk of immobilization (immob.). Each relation comprises 100 units based on experimental measurements (Duchateau and Hainaut 1990). (B) Comparison of the simulated maximal voluntary contraction (MVC) force before (control) and after (a and b) the immobilization intervention. The simulation was based on the model developed by Fuglevand et al. (1993) and comprised motor units with properties shown in A. The simulated forces indicate (a) the reduction in MVC force caused by the decrease of maximal discharge rate alone, and (b) the decline in MVC force caused by the decrease in motor unit force and maximal discharge rate (data from Duchateau and Enoka 2002).

References

    1. Almuklass A, Davis L, Vieira T, Botter A, Derqaoui K, Hamilton L, Hebert JR, Vollmer TL, Alvarez E, Enoka RM. 2016a. Neuromuscular determinants for walking performance in individuals with multiple sclerosis. Med Sci Sports Exerc 48: 712.
    1. Almuklass AM, Price RC, Gould JR, Enoka RM. 2016b. Force steadiness as a predictor of time to complete a pegboard test of dexterity in young men and women. J Appl Physiol 120: 1410–1417. - PubMed
    1. Altenburg TM, de Ruiter CJ, Verdijk PW, van Mechelen W, de Haan A. 2009. Vastus lateralis surface and single motor unit electromyography during shortening, lengthening and isometric contractions corrected for mode-dependent differences in force-generating capacity. Acta Physiol (Oxford) 196: 315–328. - PubMed
    1. Aston-Jones G, Waterhouse B. 2016. Locus coeruleus: From global projection system to adaptive regulation of behavior. Brain Res 1645: 75–78. - PMC - PubMed
    1. Bailey EF, Rice AD, Fuglevand AJ. 2007. Firing patterns of human genioglossus motor units during voluntary tongue movement. J Neurophysiol 97: 933–936. - PubMed

LinkOut - more resources