. 2017 Apr 11;114(15):3933-3938.
doi: 10.1073/pnas.1614894114. Epub 2017 Mar 27.

Myosin-1E interacts with FAK proline-rich region 1 to induce fibronectin-type matrix

Affiliations

Myosin-1E interacts with FAK proline-rich region 1 to induce fibronectin-type matrix

Joel B Heim et al. Proc Natl Acad Sci U S A. .

Abstract

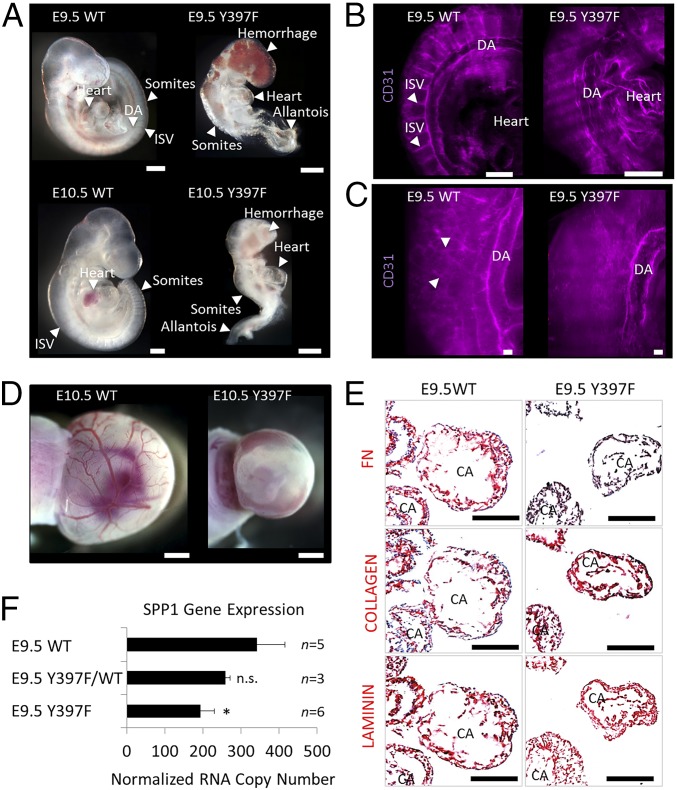
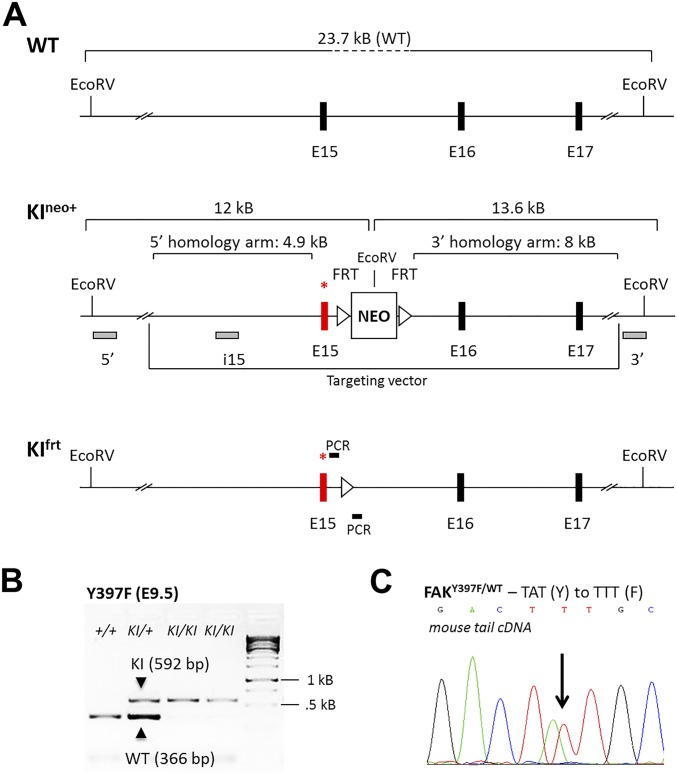
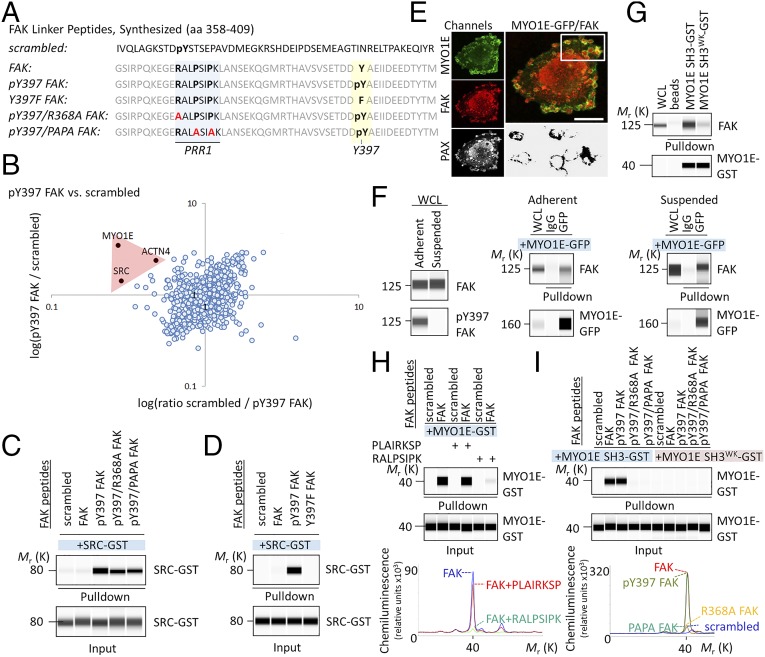
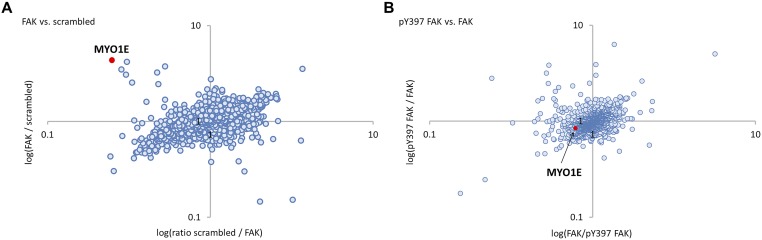
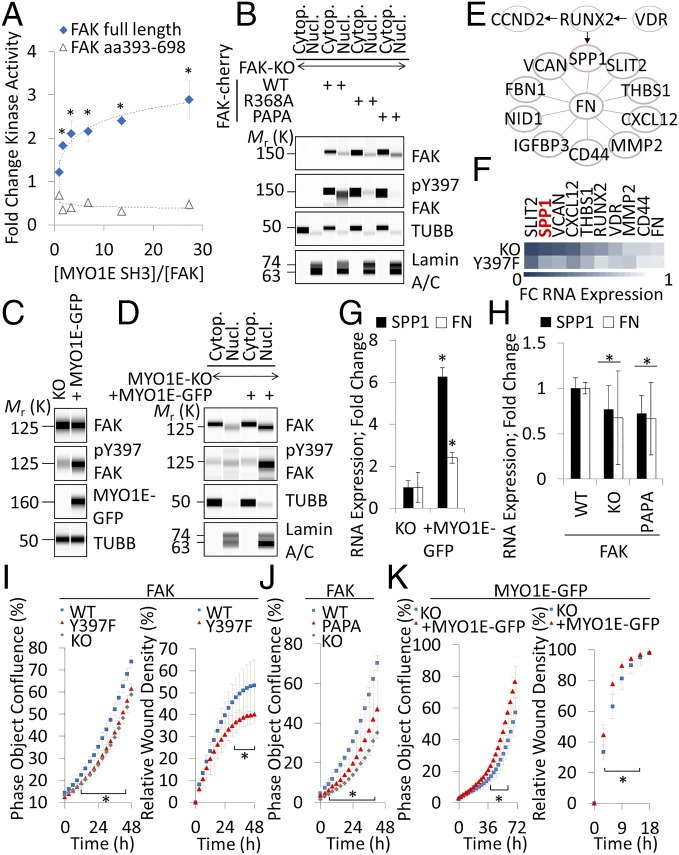
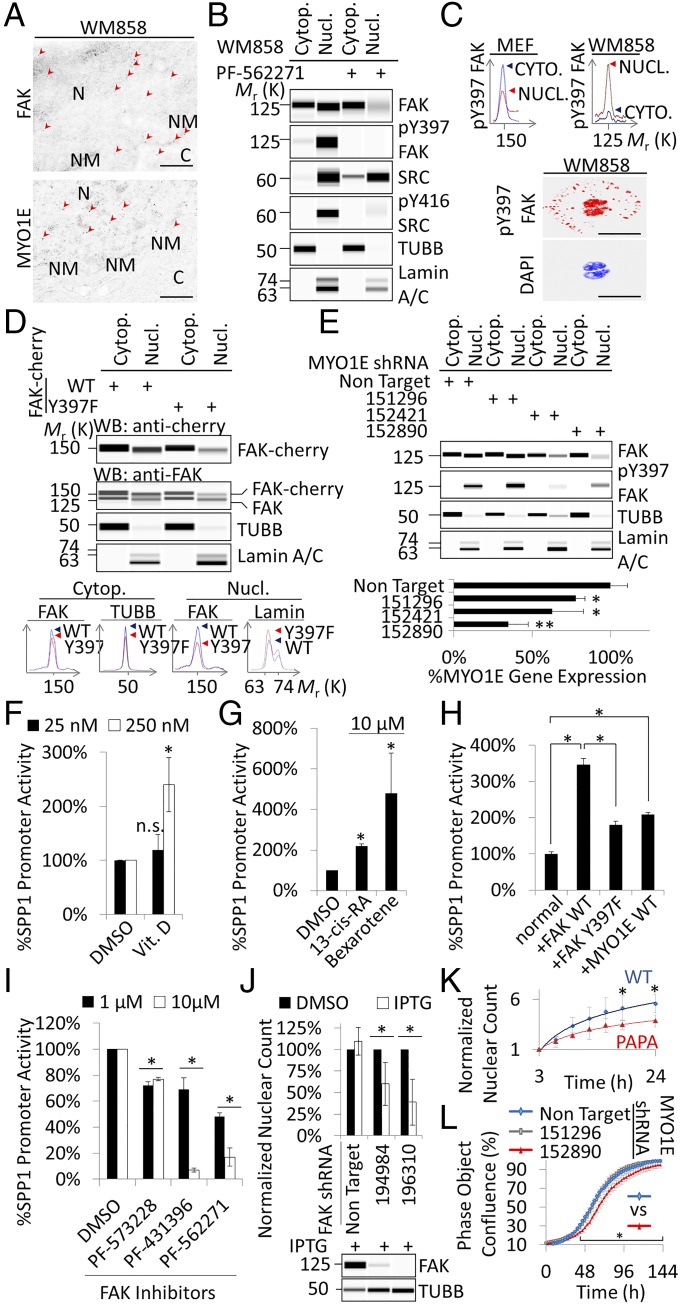
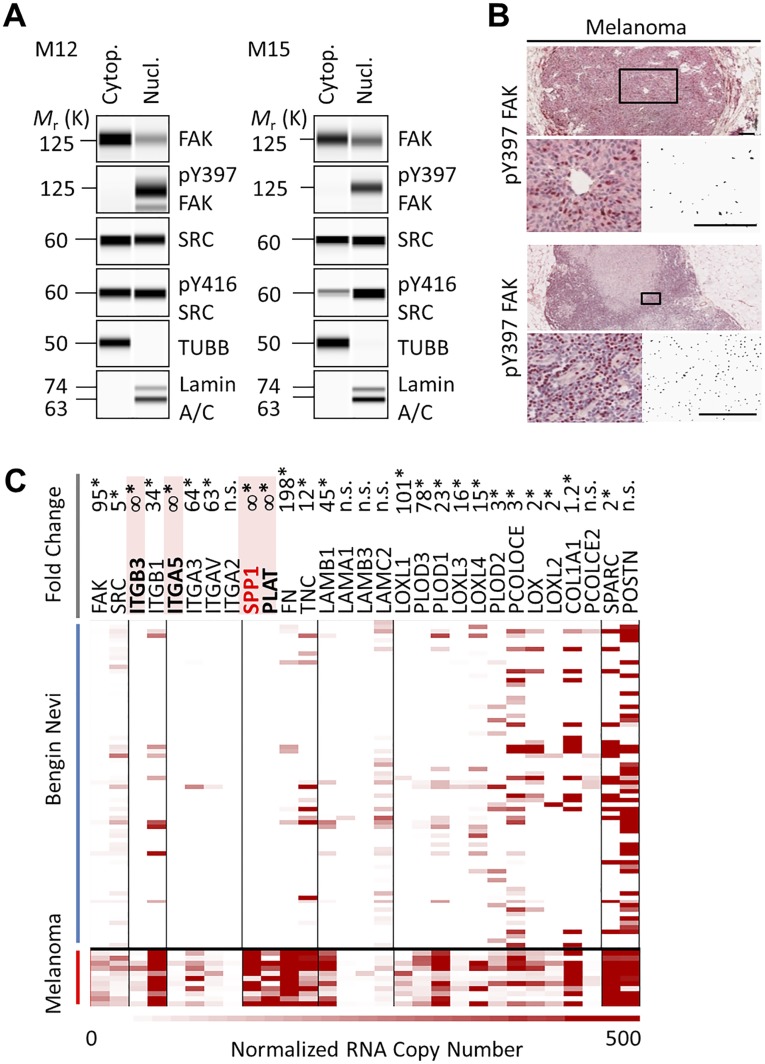
Focal adhesion kinase (FAK) is a nonreceptor tyrosine kinase involved in development and human disease, including cancer. It is currently thought that the four-point one, ezrin, radixin, moesin (FERM)-kinase domain linker, which contains autophosphorylation site tyrosine (Y) 397, is not required for in vivo FAK function until late midgestation. Here, we directly tested this hypothesis by generating mice with FAK Y397-to-phenylalanine (F) mutations in the germline. We found that Y397F embryos exhibited reduced mesodermal fibronectin (FN) and osteopontin expression and died during mesoderm development akin to FAK kinase-dead mice. We identified myosin-1E (MYO1E), an actin-dependent molecular motor, to interact directly with the FAK FERM-kinase linker and induce FAK kinase activity and Y397 phosphorylation. Active FAK in turn accumulated in the nucleus where it led to the expression of osteopontin and other FN-type matrix in both mouse embryonic fibroblasts and human melanoma. Our data support a model in which FAK Y397 autophosphorylation is required for FAK function in vivo and is positively regulated by MYO1E.

Keywords: cancer; fibronectin; focal adhesion; melanoma; myosin.


Conflict of interest statement

The authors declare no conflict of interest.

Figures

Fig. 1.
Fig. 1.
FAK Y397F mutation is early embryonic lethal. (A) Bright-field images of E9.5 and E10.5 wild-type (WT) and Y397F embryos. DA, dorsal aorta; ISV, intersomitic vessel. (B) Whole-mount pictures of E9.5 WT and Y397F embryos stained for CD31 (purple). (C) Higher magnification of CD31-stained vasculature. Arrowheads point to a web of small vessels in WT embryos. (D) E10.5 control and Y397F yolk sacs. (E) Immunohistochemistry staining of E9.5 embryo frozen sections using the indicated antibodies. CA, cardiac mesoderm. (F) SPP1 RNA copy numbers as determined by quantitative PCR in E9.5 whole-embryo–derived RNA. *P = 0.002, Student’s t test. n.s., not significant. (Scale bars, 200 μm.)
Fig. S1.
Fig. S1.
Generation of FAKY397F knock-in (KI) mice. (A) Partial map of the FAK allele. Exon 15 (E15), which contains mutated Y397, is marked by an asterisk, before (KIneo+) and after (KIfrt) flippase-mediated deletion of the flirted (FRT) neocassette. The DNA fragment sizes obtained after EcoRV restriction digest, as well as probes (5′ and 3′ probes external to the targeting vector and the i15 internal probe) used for Southern blotting are shown. Filled boxes indicate exons, and triangles indicate FRT sites. Location of PCR primers for KIfrt mice genotyping is depicted: forward, GCTTTAGAGCACATCTGTCAC; reverse, CTGGGCTGCTTGAATAGTGGG. NEO, neomycin resistance gene; WT, wild-type. (B) Representative PCR genotyping of KIfrt embryos at E9.5 using primers flanking the FRT site. The expected PCR product size is 592 bp for the KI allele and 366 bp for the WT allele. PCR results from WT embryos (+/+), heterozygous embryos (KI/+) and homozygous embryos (KI/KI) are shown for both of the Y397F KIs. kB, kilobase. (C) Sanger sequencing of cDNA derived from the tails of heterozygous KI mice. Double peaks are indicative of base pair changes in the respective KI alleles. Y, tyrosine codon sequence; F, phenylalanine codon sequence.
Fig. 2.
Fig. 2.
MYO1E binds FAK at PRR1. (A) Amino acid (aa) sequence of synthesized FAK peptides. (B) Scatter plot of phospho-Y397 FAK peptide versus scrambled peptide pull-down results. The log SILAC ratio of proteins identified with at least two unique peptides in each mass spectrometry run is plotted as the forward pull-down (x axis) against the reverse labeling pull-down (y axis). Specific interaction partners show inverse ratios between forward and reverse experiments, grouping them into the upper left quadrant. (C and D) Pull-down of recombinant SRC-GST by FAK peptides. (E) Immunostaining of MYO1E-GFP–expressing WM858 cells. (Lower Right) Area of MYO1E/FAK colocalization. (Scale bars, 10 μm.) (F) Coimmunoprecipitation of FAK by MYO1E-GFP from whole-cell lysates (WCL) of adherent or suspended WM858 cells. (G) Pull-down assay demonstrating MYO1E SH3 binding to FAK. A tryptophan (W) to lysine (K) mutation at position 1088 (W1088K; WK) in MYO1E SH3 prevented MYO1E SH3 binding to FAK. (H) FAK PRR1 peptide RALPSIPK, but not scrambled PLAIRKSP, blocks FAK interaction with MYO1E SH3. Chemiluminescence spectra for the indicated pull-downs are shown. (I) Pull-down of recombinant MYO1E SH3-GST by FAK peptides. Chemiluminescence spectra are shown. Immunoblots are pseudoimages generated by ProteinSimple Compass software.
Fig. S2.
Fig. S2.
MYO1E binds equally well to Y397-phosphorylated FAK peptide and nonphosphorylated FAK peptide. (A) Scatter plot of nonphosphorylated FAK FERM-kinase domain linker peptide versus scrambled peptide pull-down results using WM858 melanoma cell lysate. The log SILAC ratio of proteins identified with at least two unique peptides in each mass spectrometry run is plotted as the forward pull-down (x axis) against the reverse labeling pull-down (y axis). MYO1E binds with a high ratio to nonphosphorylated WT FAK peptide over scrambled peptide. (B) Scatter plot of Y397-phosphorylated FAK FERM-kinase domain linker peptide versus nonphosphorylated FAK peptide pull-down results using WM858 melanoma cell lysate. Forward and reverse pull-downs result in MYO1E SILAC ratios around 1, indicating equal binding of MYO1E to both peptides.
Fig. S3.
Fig. S3.
Assessment of folding of recombinant MYO1E SH3 domains by circular dichroism and NMR. (A) Circular dichroism spectra of recombinant WT and W1088K MYO1E SH3 domains (after GST-tag removal). Results indicate folded proteins. (B and C) Assignment of the tryptophane side-chain imine peaks: NMR spectra of MYO1E SH3 WT (black), W1088A (blue), 1088K (green), and 1089A (red) in the absence of peptide. (B) Overlay of the spectra in the imino region demonstrates that the bottom imino peak is absent in the spectra of W1088A and W1088K, thus indicating that this peak corresponds to W1088. Vice versa, the top imino peak is absent in W1089A. In this mutant, the W1088A peak displays peak splitting, which can be attributed to the poorer spectral quality of this mutant. (C) Overlay of the whole spectra of Myo-1E SH3 WT and tryptophane mutants. The spectra of W1088A and W1088K display well-dispersed peaks that partially overlap with the WT protein. This finding indicates that these mutants are well folded and adopt the same fold as the WT protein. The spectrum of W1089A (red) displays poorer spectral quality and some peak splitting.
Fig. S4.
Fig. S4.
Analytical SEC demonstrates complex formation between the recombinant MYO1E-SH3 domain (after GST-tag removal) and RALPSIK peptide in solution.
Fig. 3.
Fig. 3.
Structural analysis of the RALPSIPK–MYO1E interaction. (A) Quantification of CSPs as determined by NMR during peptide titration based on four resonances (L1070, G1091, N1003, and T1067). The combined fit yields an affinity of Kd = 51 μM. (B) ITC experiment of MYO1E SH3 with RALPSIPK peptide. The experimental Kd determined by ITC is 22 ± 1 μM with thermodynamic parameters of dH = −43.0 ± 2.2 kJ/mol (n = 0.94 ± 0.02) and dS = −55 ± 8 J/(mol * K). (C) CSPs on MYO1E SH3 upon binding of RALPSIPK peptide and modeled class 1 peptide. CSPs are mapped on the crystal structure of MYO1E SH3 (PDB ID code 2XMF). Increasing color and diameter of the cartoon indicate higher CSP of the corresponding backbone amide. Additionally, the CSP of the tryptophane imides is depicted as the color of the surface representation. Prolines are depicted in gray because they do not appear in the NMR 1H15N spectra. The position of the depicted class 1 peptide is derived from the structure of chicken SRC SH3 domain in complex with a proline-rich peptide by superimposing the MYO1E SH3 with the chicken SRC SH3 domain (PDB ID code 1RLQ).
Fig. 4.
Fig. 4.
MYO1E activates FAK to induce SPP1 expression in fibroblasts. (A) In vitro FAK kinase activity of full-length recombinant FAK versus FAK kinase domain only (aa 393–698) in the presence or absence of 1:2 titrated recombinant MYO1E SH3 (mean ± SEM, n = 4; *P < 0.05 versus no MYO1E SH3). (B) Effects of FAK PRR1 mutations on nuclear (Nucl.) and cytoplasmic (Cytop.) FAK in transiently transfected fibroblasts. (C) Immunodetection of the indicated antigens in stably MYO1E-GFP–reconstituted MYO1E-null mouse embryonic fibroblasts. (D) Nuclear versus cytoplasmic localization of FAK in MYO1E-null (KO) or WT MYO1E-GFP–reconstituted fibroblasts. (E) Network of differentially regulated FN-associated genes. Arrows and lines indicate a functional relationship as determined by STRING. (F) Color-coded ratios of mRNA expression as quantified by RNA sequencing in FAK-null (KO) or Y397F-reconstituted fibroblasts over WT. FC, fold change. RNA expression of the indicated genes in MYO1E-null (KO) or WT MYO1E-GFP–reconstituted fibroblasts (G) or FAK-null fibroblasts transiently reconstituted with WT or PAPA FAK (H) is shown. Gene expression was determined by quantitative PCR (mean ± SD, n ≥ 4; *P < 0.05). (IK) Phase object confluence or Matrigel invasion of the indicated reconstituted and nonreconstituted KO fibroblasts (mean ± SD, n = 4; *P < 0.05, Student’s t test). Immunoblots are pseudoimages generated by ProteinSimple Compass software.
Fig. 5.
Fig. 5.
MYO1E/FAK drives SPP1 expression and proliferation in melanoma cells. (A) Immunogold electron microscopy micrographs of WM858 cells. Arrowheads point to areas of electron-dense immunolabeling. C, cytoplasm; N, nucleus; NM, nuclear membrane. (Scale bar, 0.5 μm.) (B) Analysis of nuclear and cytoplasmic protein extracts from WM858 cells in the presence or absence of 2.5 μM PF-562271. (C, Top) Phospho-Y397 FAK chemiluminescence spectra of fractionated lysates of the indicated cell types. MEF, mouse embryonic fibroblast. (C, Bottom) WM858 cell stained for phospho-Y397. Note high levels of phospho-Y397 FAK in the nucleus. (Scale bars, 40 μm.) (D) Analysis of nuclear and cytoplasmic protein extracts from WM858 cells carrying stable WT or Y397F FAK-cherry. Chemiluminescence spectra for the indicated subcellular fractions, antibodies, and cells are shown. WB, Western blot. (E) Effects of MYO1E shRNA-mediated knockdowns on FAK levels in WM858 cells. Knockdown efficacy was determined by quantitative PCR (mean ± SD, n = 3; *P < 0.05, **P < 0.001 versus nontargeting shRNA). SPP1 promoter activity after overnight exposure of Dual-Glo cells to vitamin (Vit.) D (F) or retinoids (G) is shown (mean ± SD, n = 3; *P < 0.05). n.s., not significant. (H) SPP1 promoter activity in normal (unmodified) Dual-Glo cells or cells with stable expression of the indicated FAK or MYO1E constructs (mean ± SD, n = 16; *P < 0.001). (I) SPP1 promoter activity after exposure of Dual-Glo cells to FAK inhibitors (mean ± SD, n = 3; *P < 0.05). (J) Proliferation of WM858 cells as determined by automated counting of fluorescent nuclei in the presence or absence of shRNA targeting FAK, inducible by isopropyl β-d-1-thiogalactopyranoside (IPTG) (mean ± SD, n = 3; *P < 0.05). TUBB, β-tubulin. (K) Proliferation of WM858 cells depleted of endogenous FAK by shRNA TRCN196310 and transiently reconstituted with murine FAK-cherry (mean ± SD, n ≥ 3; *P < 0.05). (L) Proliferation of WM858 cells in the presence or absence of MYO1E shRNA (mean ± SEM, n = 12; *P < 0.05). Immunoblots are pseudoimages generated by ProteinSimple Compass software.
Fig. S5.
Fig. S5.
(AC) Nuclear localization of phospho-Y397 FAK correlates with FN-type gene expression in melanoma. Cytop. cytoplasm; Nucl., nuclear.
Fig. S6.
Fig. S6.
FAK ChIP-seq in WM858 melanoma cells. We sought to determine whether FAK associates with specific promoters in WM858 cells by using ChIP-seq. Three FAK antibodies detected 182 partially overlapping peaks in six ChIP-seq experiments, and 74 were detected in two independent experiments. (A) Exemplary promoter regions identified with high fidelity and within 2 kb of the transcription start site are shown and include the RPS6KB1 promoter. Based on 182 peaks detected, we determined the following consensus binding sequence: GCGC[AC]TGCGC. This binding sequence is highly similar to the optimal binding site for nuclear respiratory factor 1 (NRF1), (T/C)GCGCA(C/T)GCGC(A/G), which activates the expression of key metabolic genes. (B) To test whether the RPS6KB1 gene product, ribosomal S6 Kinase 1 (S6K1), helps drive SPP1 promoter activity, we exposed WM858 Dual-Glo cells to N-p-Tosyl-l-phenylalanine chloromethyl ketone (TPCK), a p70S6 kinase inhibitor. TPCK inhibited SPP1 promoter activity by ∼40%. SPP1 promoter activity after overnight TPCK treatment of WM858 cells is shown (mean ± SD; n = 3; **P < 0.001). (C) Likewise, two of five RPS6KB1-directed TRC shRNAs significantly inhibited SPP1 promoter activity. Effects of various TRC clone-derived RPS6KB1 shRNAs on SPP1 promoter activity are shown (mean ± SD; n = 2; *P < 0.05). n.s., not significant.
Fig. S7.
Fig. S7.
MAPK pathway does not drive SPP1 expression in WM858 melanoma cells. SPP1 promoter activity after exposure of WM858 Dual-Glo cells to SRC inhibitors (A), MAPK/MEK inhibitors (B), or RAF inhibitors (C) overnight is shown (mean ± SD; n = 3; *P < 0.05). A brief description of compounds used is provided. P values, Student’s t test.

Similar articles

Cited by

References

    1. Ilić D, et al. Reduced cell motility and enhanced focal adhesion contact formation in cells from FAK-deficient mice. Nature. 1995;377:539–544. - PubMed
    1. Schiller HB, Friedel CC, Boulegue C, Fässler R. Quantitative proteomics of the integrin adhesome show a myosin II-dependent recruitment of LIM domain proteins. EMBO Rep. 2011;12:259–266. - PMC - PubMed
    1. Lim ST, et al. Nuclear FAK promotes cell proliferation and survival through FERM-enhanced p53 degradation. Mol Cell. 2008;29:9–22. - PMC - PubMed
    1. Serrels A, et al. Nuclear FAK controls chemokine transcription, Tregs, and evasion of anti-tumor immunity. Cell. 2015;163:160–173. - PMC - PubMed
    1. Lim ST, et al. Knock-in mutation reveals an essential role for focal adhesion kinase activity in blood vessel morphogenesis and cell motility-polarity but not cell proliferation. J Biol Chem. 2010;285:21526–21536. - PMC - PubMed

Publication types

MeSH terms