. 2017 Apr 11;114(15):3861-3866.
doi: 10.1073/pnas.1617526114. Epub 2017 Mar 27.

Communicating the deadly consequences of global warming for human heat stress

Affiliations

Communicating the deadly consequences of global warming for human heat stress

Tom K R Matthews et al. Proc Natl Acad Sci U S A. .

Abstract

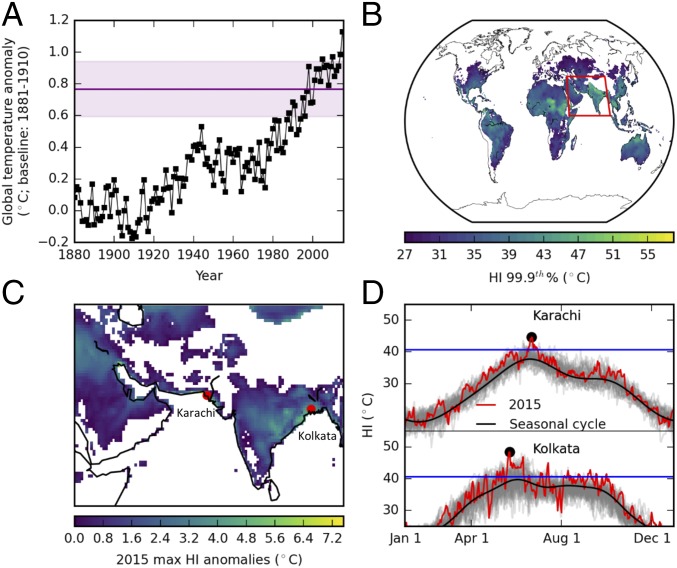
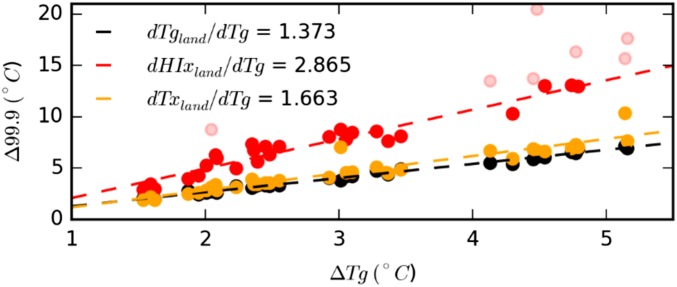
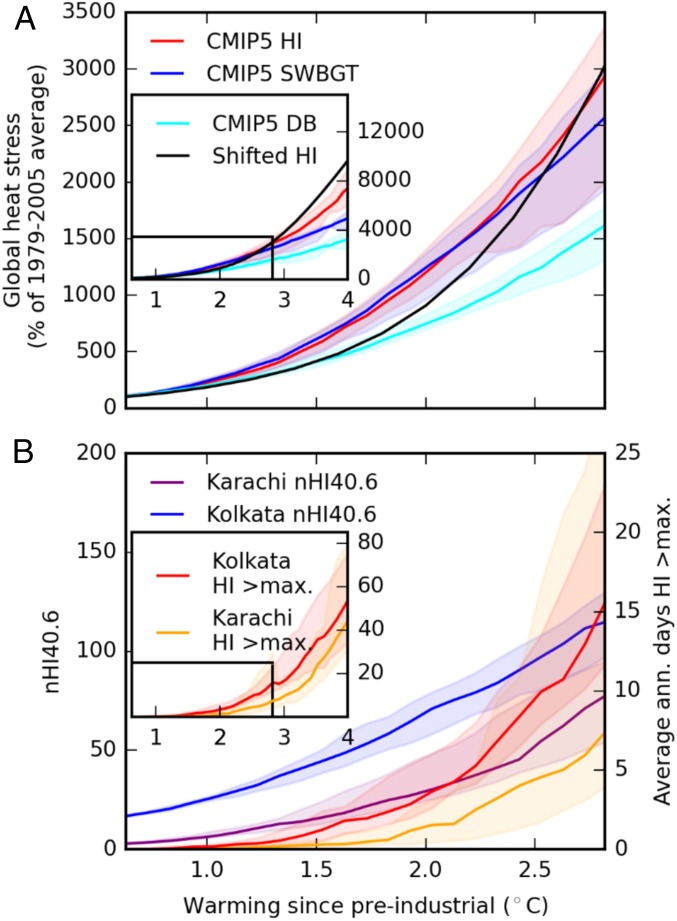
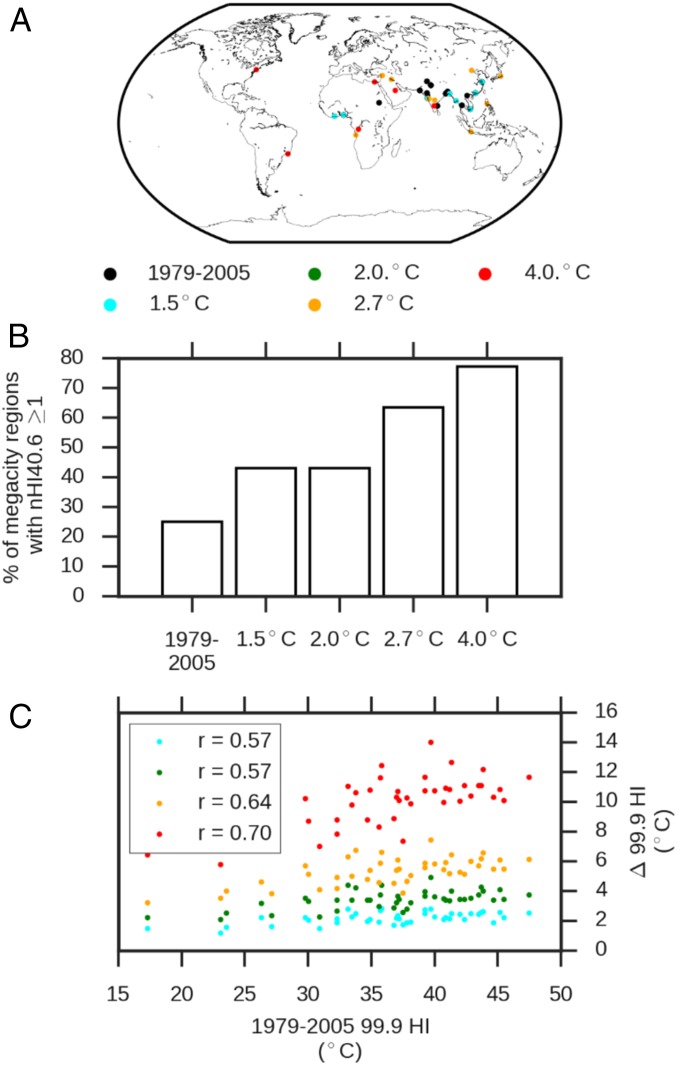
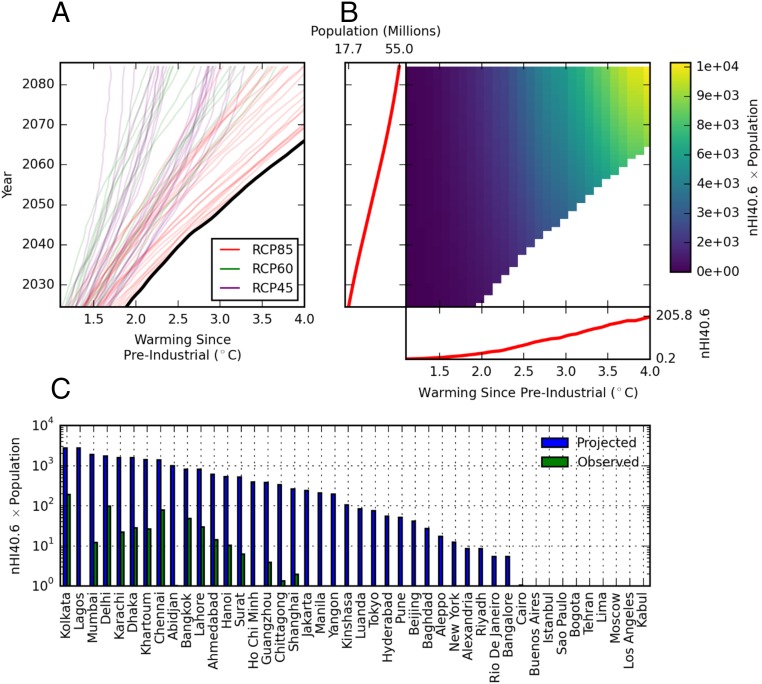
In December of 2015, the international community pledged to limit global warming to below 2 °C above preindustrial (PI) to prevent dangerous climate change. However, to what extent, and for whom, is danger avoided if this ambitious target is realized? We address these questions by scrutinizing heat stress, because the frequency of extremely hot weather is expected to continue to rise in the approach to the 2 °C limit. We use analogs and the extreme South Asian heat of 2015 as a focusing event to help interpret the increasing frequency of deadly heat under specified amounts of global warming. Using a large ensemble of climate models, our results confirm that global mean air temperature is nonlinearly related to heat stress, meaning that the same future warming as realized to date could trigger larger increases in societal impacts than historically experienced. This nonlinearity is higher for heat stress metrics that integrate the effect of rising humidity. We show that, even in a climate held to 2 °C above PI, Karachi (Pakistan) and Kolkata (India) could expect conditions equivalent to their deadly 2015 heatwaves every year. With only 1.5 °C of global warming, twice as many megacities (such as Lagos, Nigeria, and Shanghai, China) could become heat stressed, exposing more than 350 million more people to deadly heat by 2050 under a midrange population growth scenario. The results underscore that, even if the Paris targets are realized, there could still be a significant adaptation imperative for vulnerable urban populations.

Keywords: CMIP5; climate change; extreme heat; heat stress; megacities.


Conflict of interest statement

The authors declare no conflict of interest.

Figures

Fig. 1.
Fig. 1.
Mean air temperatures and recent HI extremes. (A) Global mean air temperature series defined as the average of the BEST, HadCRUT4, and GISTEMP records. The purple line gives the 1986–2015 mean, with the shaded area representing ±1 SD. (B) The 99.9th percentiles of daily HI values, with values <27 °C masked (the lower limit of the HI warning category indicating “caution” to heat stress). (C) HI anomaly of 2015 relative to the mean of the annual maximums 1979–2015; negative anomalies are masked as are positive anomalies where absolute HI <27 °C. Note that the domain of C is indicated in B by the red box. (D) Daily mean HI values for the respective regions (1979–2015). Gray curves are individual years 1979–2014; red is 2015.
Fig. 2.
Fig. 2.
Relationship between CMIP5 modeled changes in global mean air temperature (ΔTg) and changes in mean air temperature over land (Tgland), extreme temperatures over land (Txland), and HI values over land (HIxland). Extremes are defined as the 99.9th percentile, and the changes are calculated by differencing the respective values in the last decade of model simulations (2090–2099) relative to the simulated values over the period 1979–1988. Note that we mask HI values >50 °C when computing the regression slope (shown in lighter shading), because this value is the upper limit of the range considered by ref. .
Fig. 3.
Fig. 3.
Global and regional heat stress projected as a function of global warming amounts. (A) Global (land) heat stress sensitivity to global air temperature changes, in which lines are medians calculated from the CMIP5 ensemble and the shaded regions span the 25th–75th percentiles. Note that heat stress is defined here as the mean annual number of days exceeding a threshold temperature (40.6 °C, 35 °C, and 37.6 °C for the HI, SWBGT, and DB temperatures, respectively). At this global scale, these metrics are area-averaged. A, Inset continues the curves to 4 °C warming above PI, with limits in A indicated by the black box. (B) The same as in A but for the named locations, with different units on the y axes. Series on B, Inset axes continues the respective curves from B to 4 °C.
Fig. 4.
Fig. 4.
Changes in heat stress for global city regions under various scenarios of global warming. (A) City regions experiencing annual heat stress (nHI40.6 ≥ 1) for the first time under different warming amounts according to the CMIP5 ensemble median. Black circles mark locations already experiencing heat stress during the 1979–2005 reference period. Note that the names of these cities are available in Tables S1–S4. (B) CMIP5 ensemble median percentage of megacities experiencing common heat stress under the respective warming amounts. (C) Changes in the CMIP5 ensemble median 99.9th HI percentile as a function of the observed 99.9th HI percentile during the 1979–2005 reference period. Values for HI > 50 °C have been masked out of this plot and the correlations in Inset (see Fig. 2 legend). These correlations (r values) quantify the strength of the positive relationship plotted. Note that the critical r value for rejection of the null hypothesis (r = 0) is ±0.30 for 42 df at the 0.05 level; hence, all reported values are interpreted as significant.
Fig. 5.
Fig. 5.
Population-weighted heat stress throughout the 21st century. (A) Running 30-y means of CMIP5 warming since PI. The fastest warming series is plotted with a heavy black line. Warming rates in excess of this are masked in B, which shows an example [for Lagos (Nigeria) under SSP2] of the ensemble median HSB for all other combinations of global warming amounts and running 30-y population averages; Insets attached to the respective axes show the evolution of the respective variables that are multiplied together to form the matrix. (C) The mean HSB projected over the 21st century across all SSP matrices for the respective cities. The reference HSB is computed using HI values for 1979–2005 along with the 1995 population estimate; details of these calculations are in Materials and Methods.

References

    1. Hansen J, Sato M, Ruedy R. Perception of climate change. Proc Natl Acad Sci USA. 2012;109(37):E2415–E2423. - PMC - PubMed
    1. Fischer EM, Knutti R. Anthropogenic contribution to global occurrence of heavy-precipitation and high-temperature extremes. Nat Clim Chang. 2015;5(6):560–564.
    1. Sheridan SC, Allen MJ. Changes in the frequency and intensity of extreme temperature events and human health concerns. Curr Clim Change Rep. 2015;1(3):155–162.
    1. Dunne JP, Stouffer RJ, John JG. Reductions in labour capacity from heat stress under climate warming. Nat Clim Chang. 2013;3(6):563–566.
    1. Willett KM, Sherwood S. Exceedance of heat index thresholds for 15 regions under a warming climate using the wet-bulb globe temperature. Int J Climatol. 2012;32(2):161–177.

Publication types