. 2017 Apr 11;114(15):E3041-E3050.
doi: 10.1073/pnas.1618008114. Epub 2017 Mar 27.

Structural basis of mitochondrial dysfunction in response to cytochrome c phosphorylation at tyrosine 48

Affiliations

Structural basis of mitochondrial dysfunction in response to cytochrome c phosphorylation at tyrosine 48

Blas Moreno-Beltrán et al. Proc Natl Acad Sci U S A. .

Abstract

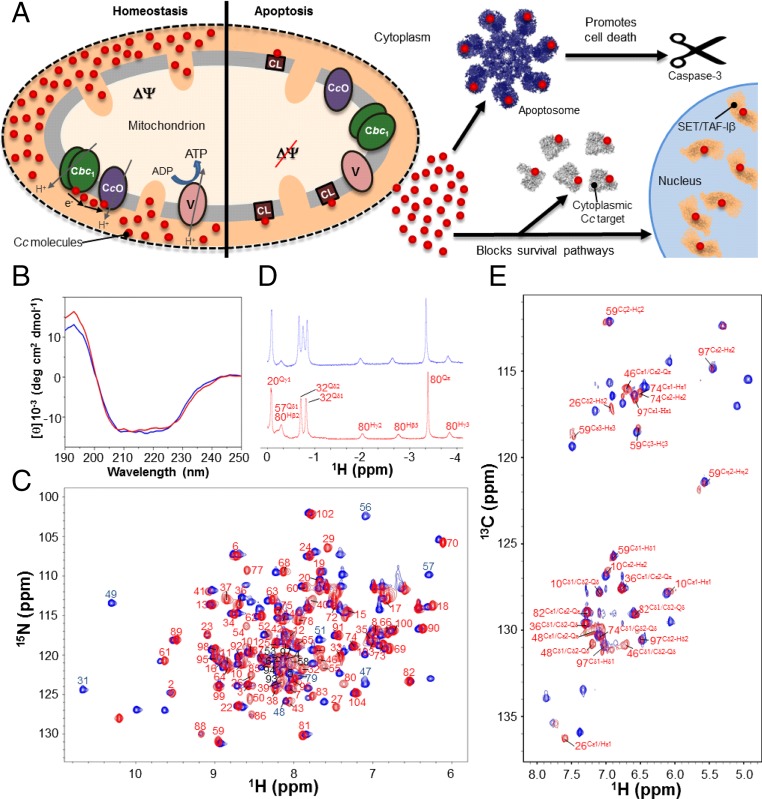
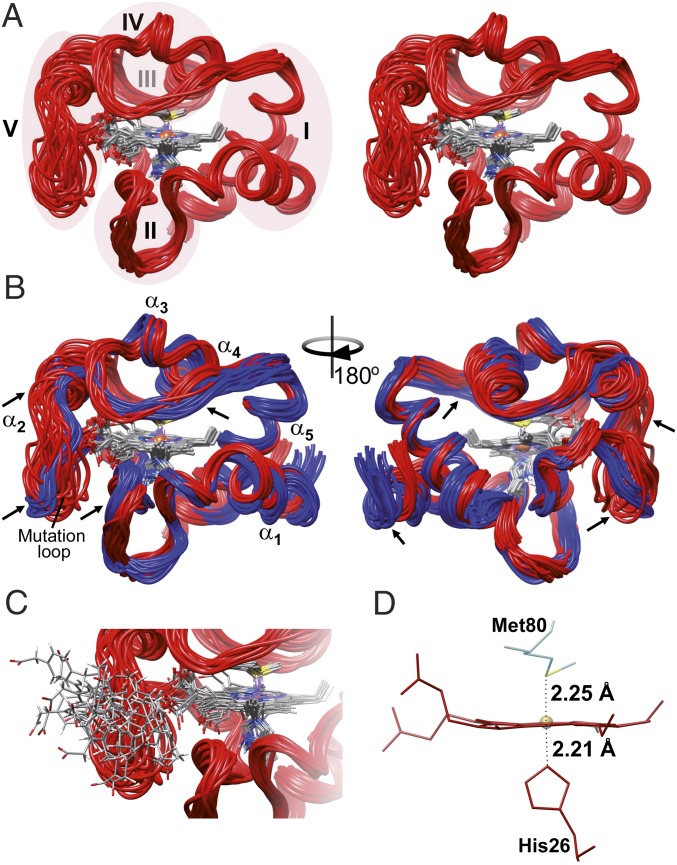
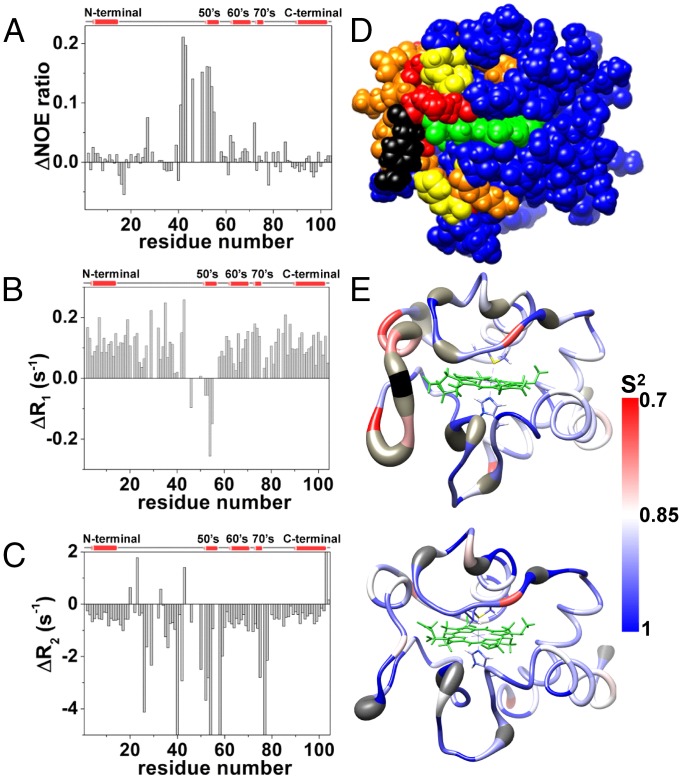
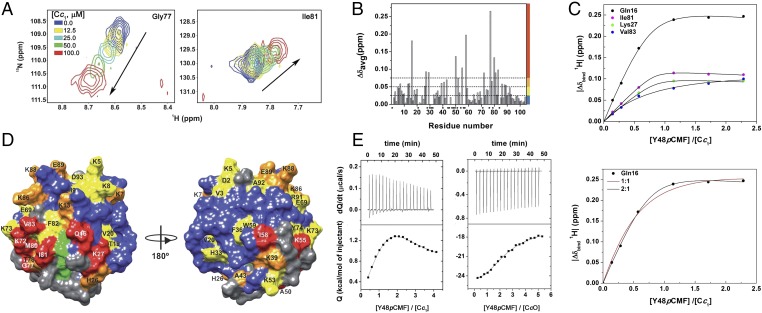
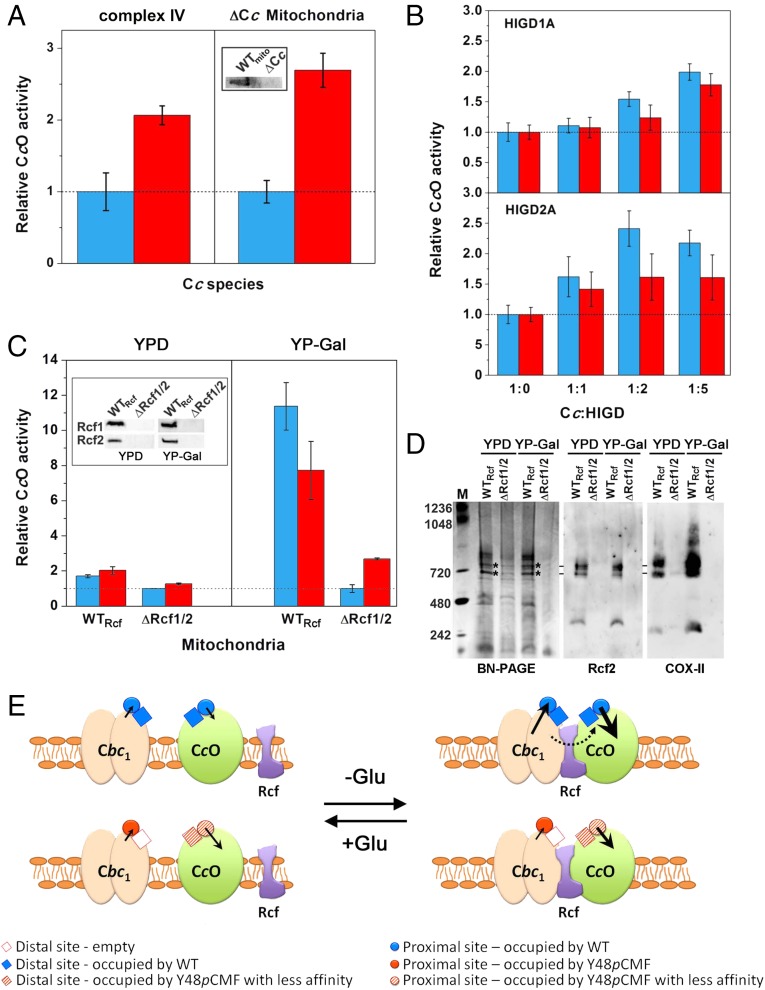
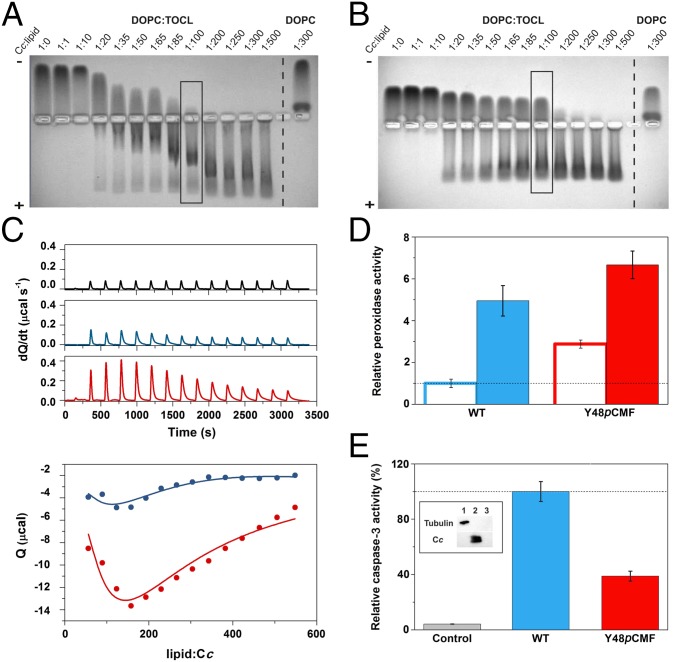
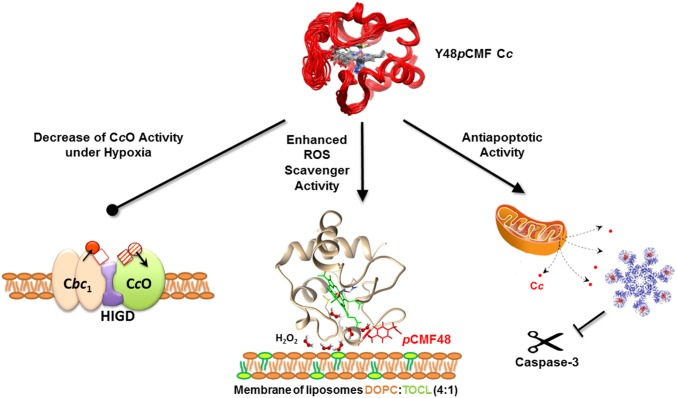
Regulation of mitochondrial activity allows cells to adapt to changing conditions and to control oxidative stress, and its dysfunction can lead to hypoxia-dependent pathologies such as ischemia and cancer. Although cytochrome c phosphorylation-in particular, at tyrosine 48-is a key modulator of mitochondrial signaling, its action and molecular basis remain unknown. Here we mimic phosphorylation of cytochrome c by replacing tyrosine 48 with p-carboxy-methyl-l-phenylalanine (pCMF). The NMR structure of the resulting mutant reveals significant conformational shifts and enhanced dynamics around pCMF that could explain changes observed in its functionality: The phosphomimetic mutation impairs cytochrome c diffusion between respiratory complexes, enhances hemeprotein peroxidase and reactive oxygen species scavenging activities, and hinders caspase-dependent apoptosis. Our findings provide a framework to further investigate the modulation of mitochondrial activity by phosphorylated cytochrome c and to develop novel therapeutic approaches based on its prosurvival effects.

Keywords: cytochrome c; mitochondrial dysfunction; nuclear magnetic resonance; phosphorylation; respiratory supercomplexes.


Conflict of interest statement

The authors declare no conflict of interest.

Figures

Fig. 1.
Fig. 1.
Control of human cell fate by the Cc-based signalosome, and biophysical and structural characterization of the Y48pCMF variant of Cc. (A) Diagram of the role of Cc in homeostasis and apoptosis. (A, Left) Under homeostatic conditions, Cc (red circles) transfers electrons from the cytochrome bc1 complex (Cbc1) to the cytochrome c oxidase complex (CcO). (A, Right) Upon apoptotic stimuli, Cc is released to the cytosol to induce apoptosome formation and block prosurvival pathways. A portion of Cc remains bound to cardiolipin. (B) Far-UV CD spectra of the reduced forms of WT (blue) and Y48pCMF Cc (red). The same color code is maintained in the following panels. (C) Superimposition of the 1H–15N HSQC spectra of uniformly 15N-labeled forms of WT and Y48pCMF Cc. Backbone amide resonances of Y48pCMF Cc are labeled in red and black. Particular amide resonances of WT Cc are labeled in blue. (D) Detailed view of the 1H NMR spectra of WT and Y48pCMF Cc at negative ppm values. Resonances for Met80 side-chain protons are shown for both Cc species. Assigned signals of all residues within this region are displayed for Y48pCMF Cc. The extra signal of WT Cc corresponds to the Qδ1 protons of Ile53. (E) Superimposition of the aromatic region of the 1H–13C HSQC spectra of WT and Y48pCMF Cc acquired in 13C natural abundance. Assigned aromatic resonances of Y48pCMF Cc are displayed in red.
Fig. 2.
Fig. 2.
NMR solution structure of the Y48pCMF variant of Cc. (A) Stereoview ribbon representation of the 20 best conformers of Y48pCMF Cc. Heme group atoms are displayed for all conformers. Ribbons are colored in red, whereas atoms from the heme group are colored following the CPK (Robert Corey, Linus Pauling, and Walter Koltun) color scheme. Foldons of Y48pCMF Cc are shadowed and marked with roman numerals, except for foldon III, which is located behind foldon IV. (B) Comparison between the NMR solution structures of WT Cc (PDB ID code 1J3S) (33) and Y48pCMF Cc (this work). The ribbon for WT Cc is in blue. The five α-helices of both Cc species, as well as the mutation-containing loop of Y48pCMF Cc, are marked. Arrows point to the regions on the Y48pCMF Cc ribbon with substantial structural changes compared with the WT form. (C) Detailed view of the loop harboring the pCMF48 residue. pCMF48 atoms follow the CPK color scheme. Protein structures are presented by UCSF Chimera software (41). (D) Detail of the heme group and axial ligands. Labels display iron-to-axial ligand distances for the Y48pCMF mutant obtained from the EXAFS analysis (SI Appendix, Fig. S5).
Fig. 3.
Fig. 3.
Relaxation NMR measurements and dynamic properties of WT and Y48pCMF Cc. (AC) Differences in heteronuclear NOE (A), relaxation rate R1 (B), and relaxation rate R2 (C) between the experimental values for the reduced forms of WT and Y48pCMF Cc, plotted as a function of the residue number. Gaps in data result from overlapping resonances, broadened resonances beyond the detection limit, and unassigned resonances. A scheme of the secondary structure elements is included (Top). (D) Map of the Y48pCMF Cc residues colored according to their dynamic properties. Affected residues in the heteronuclear NOE and relaxation rate R2 parameters are colored in yellow and orange, respectively. Residues with backbone amide resonances that are undetectable in the 1H–15N HSQC spectrum of Y48pCMF Cc but detectable in the 1H–15N HSQC spectrum of WT Cc are colored in red. pCMF48 is shown in black, and the heme group is in green. Unaffected, unassigned, and proline residues are in blue. (E) Internal mobility comparison between Y48pCMF and WT Cc. S2-order parameter values per residue for Y48pCMF (Upper) and WT (Lower) Cc are represented on the respective NMR ribbon structures using a blue–red scale. Undetectable backbone resonances are in gray. Heme atoms are in green, with the axial ligands depicted as sticks.
Fig. 4.
Fig. 4.
Binding assays between Y48pCMF Cc and its respiratory partners. (A) Overlay of selected residues of 1H–15N HSQC spectra of 15N-labeled Y48pCMF Cc along with titration with Cc1. Signals corresponding to different titration steps are colored according to the code indicated. (B) Plot of chemical-shift perturbations of 15N-labeled Y48pCMF Cc as a function of residue number. Proline and nonassigned residues are marked by asterisks. Color bars stand for the Δδavg categories: insignificant Δδavg < 0.025 ppm, blue; small 0.025 ≤ Δδavg < 0.050 ppm, yellow; medium 0.050 ≤ Δδavg < 0.075 ppm, orange; and large ≥ 0.075 ppm, red. (C, Upper) Curves representing the best global fit of several amide signals in the 1H dimension to a 2:1 ratio for the Y48pCMF Cc–Cc1 binding model with two different global KD values. (C, Lower) Binding curves of Gln16. Lines represent the best fit to 1:1 (red) and 2:1 (black) binding models. (D) CSP map of reduced Y48pCMF Cc upon addition of reduced Cc1 at a 1:1 ratio. Residues are colored according to Δδavg categories, as indicated in B. Proline and nonassigned residues are in gray. (E) ITC measurements of the Y48pCMF Cc–Cc1 and Y48pCMF Cc–CcO complexes in their reduced states. Experimental data were fitted to a 2:1 binding model. Thermograms (Upper); binding isotherms (Lower).
Fig. 5.
Fig. 5.
CcO activity with WT or Y48pCMF Cc as the electron donor. (A) CcO activity of isolated complex IV and of mitochondria lacking Cc (ΔCc) upon addition of exogenous WT (blue bars) or Y48pCMF Cc (red bars). Western blot results confirmed the lack of endogenous Cc in ΔCc mitochondria (Inset). (B) In vitro modulation of CcO activity by HIGD1A and HIGD2A. WT Cc (blue bars) or Y48pCMF Cc (red bars), along with HIGD1A or HIGD2A at the indicated ratios, was added to isolated complex IV. (C) Effect of the modulators Rcf1 and Rcf2 on the CcO activity of mitochondria isolated from yeasts grown in YPD or YP-Gal media with either WT Cc (blue bars) or Y48pCMF Cc (red bars). All data represent the mean ± SD of three independent experiments. In all cases, CcO activity was detected only upon addition of exogenous Cc but not with endogenous Cc. (C, Inset) Western blots of WTRcf mitochondria (lane 1) and mitochondria lacking Rcf1 and Rcf2 (ΔRcf1/2) (lane 2). (D) BN/PAGE and Western blots of mitochondria from WTRcf and ΔRcf1/2 strains, using antibodies against Rcf2 and COX-II. Bands submitted to tryptic digestion (SI Appendix, Fig. S11D) are highlighted by asterisks. (E) Scheme of the interactions within the electron transport chain involving Cbc1, CcO, Rcf proteins, and WT or Y48pCMF Cc, as a function of glucose (Glu) availability. The Rcf proteins facilitate the interaction between Cbc1 and CcO to form OxPhos supercomplexes, mainly under glucose deprivation (Right). The thickness of solid arrows refers to the electron transfer rate at the Cc-binding proximal sites of Cbc1 and CcO by WT or Y48pCMF Cc—the longer and thicker the arrow, the more efficient the electron transfer. The dashed line highlights the channeling of WT Cc molecules.
Fig. 6.
Fig. 6.
Liposome-binding assays with caspase-3 activity induced by WT and Y48pCMF Cc. (A and B) EMSA of Cc in the presence of increasing concentrations of lipids. DOPC:TOCL (4:1) or DOPC liposomes were incubated with WT (A) or Y48pCMF (B) Cc. Note that free Cc species moved to the cathode, whereas liposome-bound Cc migrated to the anode. Lanes marked by rectangles correspond to the Cc:lipid ratio at which the peroxidase activity was determined (see below). (C) Calorimetric assays for lipid binding to Cc. (C, Upper) ITC thermograms, corresponding to titrations of DOPC:TOCL 4:1 liposomes (black), WT Cc (blue), or Y48pCMF Cc (red). (C, Lower) Binding isotherms with WT Cc (blue dots) or Y48pCMF Cc (red dots). Continuous lines represent the best fits to a sequential binding, as computed with NanoAnalyze software (TA Instruments) with a stoichiometry of 30 molecules of lipid per molecule of Cc. All data represent the mean ± SD of three independent experiments. (D) Relative peroxidase activities of WT Cc (blue) or Y48pCMF Cc (red) in the presence of liposomes containing DOPC (empty bars) or DOPC:TOCL (4:1) (filled bars). (E) Relative caspase-3 activity in HEK293 cell extracts devoid of endogenous Cc upon addition of exogenous WT Cc (blue) or Y48pCMF Cc (red). A lack of caspase autoactivation was verified in a run without the addition of Cc (gray). Western blots confirmed the lack of endogenous Cc in cytoplasmic cell extracts after immunoblotting with anti–α-tubulin (cytosolic marker) and anti-Cc antibodies (Inset). Lane 1, cytoplasmic cell extracts; lane 2, Cc; lane 3, BSA as a negative control. All data represent the mean ± SD of three independent experiments.
Fig. 7.
Fig. 7.
Schematic diagram illustrating the changes induced in cell function by phosphomimetic Y48pCMF Cc. The negative charge at position 48 decreases CcO activity by disrupting Cc channeling in OxPhos supercomplexes (Left), enhances ROS scavenger activity by increasing the peroxidase activity of CL-bound Cc (Middle), and promotes the antiapoptotic function of Y48pCMF Cc by inhibiting its ability to activate the caspase-3 cascade (Right).

Similar articles

Cited by

References

    1. Papa S. Molecular mechanism of proton translocation by the cytochrome system and the ATPase of mitochondria. Role of proteins. J Bioenerg Biomembr. 1982;14:69–86. - PubMed
    1. Turrens JF. Mitochondrial formation of reactive oxygen species. J Physiol. 2003;552:335–344. - PMC - PubMed
    1. Lenaz G, Genova ML. Structure and organization of mitochondrial respiratory complexes: A new understanding of an old subject. Antioxid Redox Signal. 2010;12:961–1008. - PubMed
    1. Ray PD, Huang BW, Tsuji Y. Reactive oxygen species (ROS) homeostasis and redox regulation in cellular signaling. Cell Signal. 2012;24:981–990. - PMC - PubMed
    1. Hou T, Wang X, Ma Q, Cheng H. Mitochondrial flashes: New insights into mitochondrial ROS signalling and beyond. J Physiol. 2014;592:3703–3713. - PMC - PubMed

Publication types

MeSH terms

Associated data

LinkOut - more resources