Comparative Study
. 2017 May 1;198(9):3480-3493.
doi: 10.4049/jimmunol.1601955. Epub 2017 Mar 27.

Bonobos Maintain Immune System Diversity with Three Functional Types of MHC-B

Affiliations
Comparative Study

Bonobos Maintain Immune System Diversity with Three Functional Types of MHC-B

Emily E Wroblewski et al. J Immunol. .

Abstract

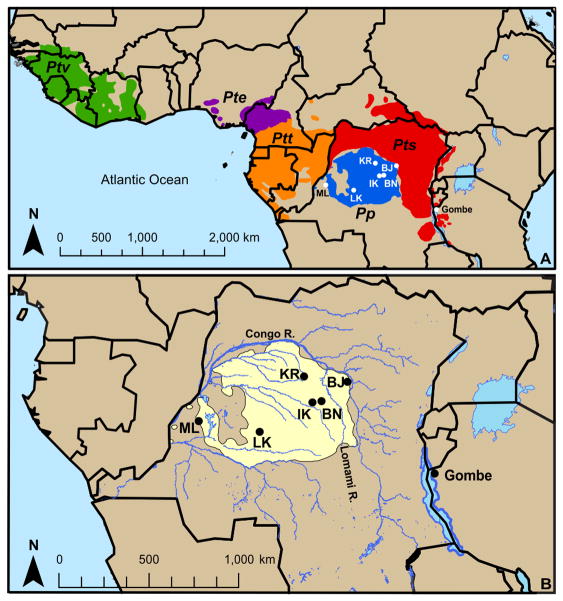
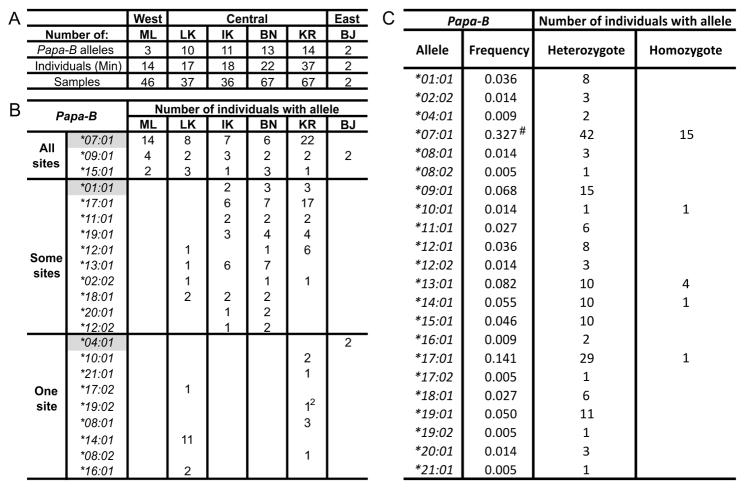
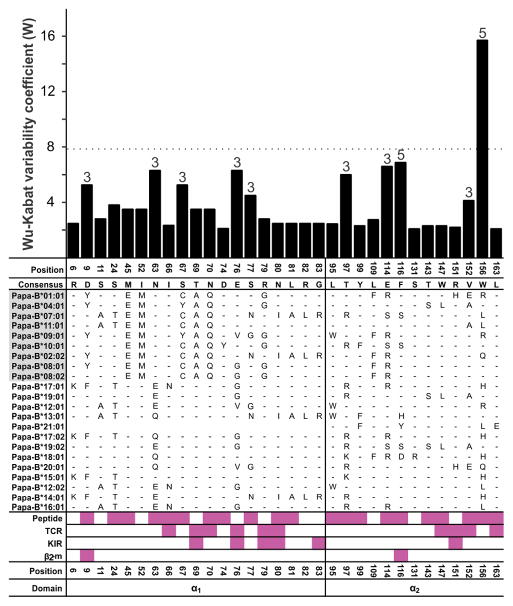
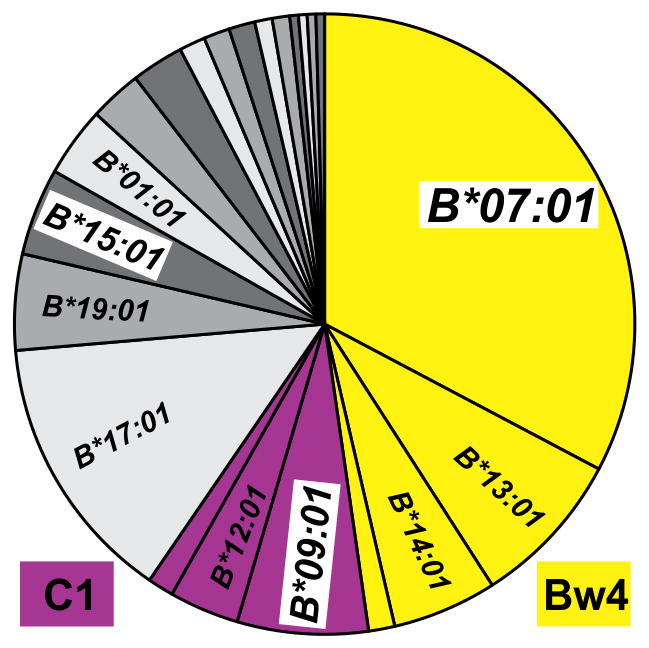
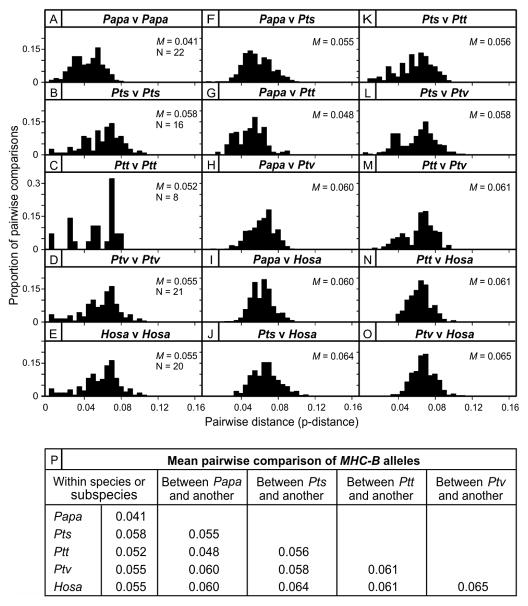
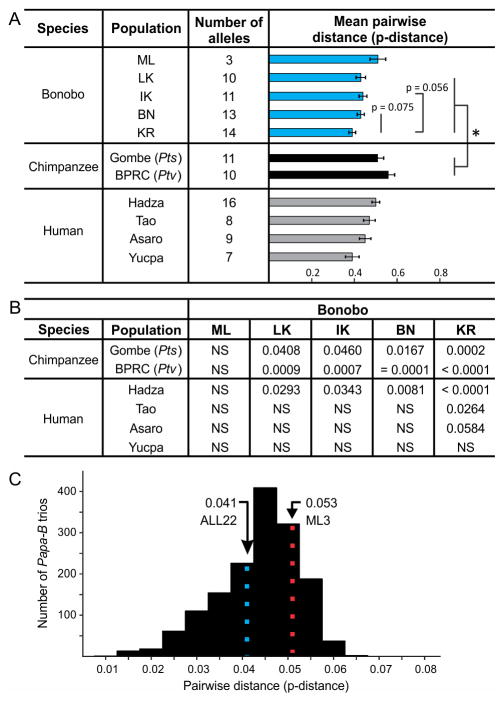
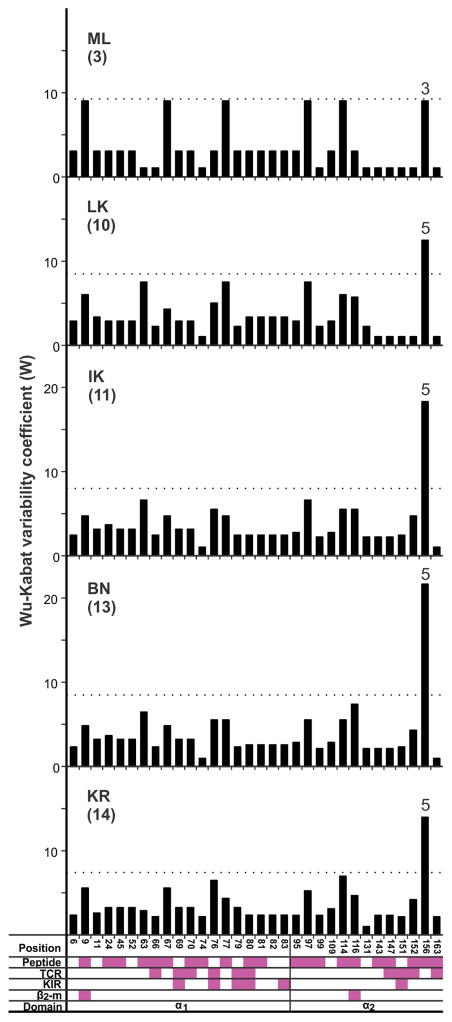
Fast-evolving MHC class I polymorphism serves to diversify NK cell and CD8 T cell responses in individuals, families, and populations. Because only chimpanzee and bonobo have strict orthologs of all HLA class I, their study gives unique perspectives on the human condition. We defined polymorphism of Papa-B, the bonobo ortholog of HLA-B, for six wild bonobo populations. Sequences for Papa-B exon 2 and 3 were determined from the genomic DNA in 255 fecal samples, minimally representing 110 individuals. Twenty-two Papa-B alleles were defined, each encoding a different Papa-B protein. No Papa-B is identical to any chimpanzee Patr-B, human HLA-B, or gorilla Gogo-B. Phylogenetic analysis identified a clade of MHC-B, defined by residues 45-74 of the α1 domain, which is broadly conserved among bonobo, chimpanzee, and gorilla. Bonobo populations have 3-14 Papa-B allotypes. Three Papa-B are in all populations, and they are each of a different functional type: allotypes having the Bw4 epitope recognized by killer cell Ig-like receptors of NK cells, allotypes having the C1 epitope also recognized by killer cell Ig-like receptors, and allotypes having neither epitope. For population Malebo, these three Papa-B are the only Papa-B allotypes. Although small in number, their sequence divergence is such that the nucleotide diversity (mean proportional distance) of Papa-B in Malebo is greater than in the other populations and is also greater than expected for random combinations of three Papa-B Overall, Papa-B has substantially less diversity than Patr-B in chimpanzee subspecies and HLA-B in indigenous human populations, consistent with bonobo having experienced narrower population bottlenecks.


Figures

Figure 1
Figure 1. The bonobo range and locations of the populations studied
(A) Map of Africa showing the range of bonobos (Pan paniscus, Pp) and the four chimpanzee subspecies (Pan troglodytes verus (Ptv, western), ellioti (Pte, Nigeria-Cameroon), troglodytes (Ptt, central), and schweinfurthii (Pts, eastern)). Location of the six bonobo study sites within the Democratic Republic of the Congo are shown by white circles and labeled with their two-letter codes: Malebo (ML), Lui-Kotale (LK), Ikela (IK), Balanga (BN), Kokolopori (KR), and Bayandjo (BJ)). The sites are separated by distance of approximately 30–1000 km. Also marked is the location of the wild Pts chimpanzee population in Gombe National Park, Tanzania. (B) Shown is an enlarged view of the six bonobo study sites (black circles) labeled with their two-letter codes and the Gombe Pts chimpanzee population. The bonobo range is highlighted in yellow, and blue lines show the rivers of the Democratic Republic of the Congo.
Figure 2
Figure 2. Summary of fecal sampling and Papa-B genotyping results
(A) For each population is given: the number of Papa-B alleles; the minimum estimate of the number of individuals sampled, as determined by the combination of mitochondrial haplotypes and microsatellite and Papa-B genotypes (Individuals (Min)); and the number of fecal samples genotyped (Samples). West, Central and East denote the three regional bonobo populations, as defined by FST distances based on mitochondrial haplotype (70). (B) Distribution of Papa-B alleles among individuals in the six study sites. The alleles are grouped according to their presence in all sites (top), two or three sites (middle) and one site (bottom). Alleles found in a single individual at one site were detected either from one sample (1) or two (12). Previously identified Papa-B alleles are highlighted in gray. (C) Papa-B allele frequencies in the total study population of 110 bonobos are given in numerical order, along with the number of bonobos that possess the allele as heterozygotes or homozygotes. #Papa-B*07:01 is more frequent than the other alleles (Fisher’s exact test, p < 0.0001). Papa-B*07:01 appears to have an excess of homozygotes, but this is because of the large number of homozygotes expected and observed in the ML population, which only has three Papa-B alleles.
Figure 3
Figure 3. Two trans-species clades of MHC-B alleles
Shown are neighbor-joining phylogenetic trees constructed from the sequences of exon 2 (A), which encodes the α1 domain, and exon 3 (B), which encodes the α2 domain. Included are all bonobo Papa-B, chimpanzee Patr-B, and gorilla Gogo-B alleles, and representative human HLA-B alleles. Allele names are colored blue for Papa-B and black for Patr-B. When known, Patr-B are colored according to subspecies: western Ptv (green), central Ptt (orange), and eastern Pts (red). Representative HLA-B alleles are in bold black and gorilla Gogo-B alleles in purple. Nodal bootstrap values are based on 1000 replications. Nodes with less than 50% support were collapsed (Full trees are shown in Supplemental Fig. 2.). The brackets in (A) show two trans-species clades of alleles. Clade 1 contains HLA-B, Patr-B, and Gogo-B alleles (Hosa-Patr-Gogo). Clade 1 was identified previously (28, 32) and contains alleles associated with control of HIV-1 progression (HLA-B*57:01) and SIVcpz (Patr-B*06:03) infection (, , –63). Clade 2, defined in this study, includes HLA-B, Patr-B, Papa-B, and Gogo-B alleles (Hosa-Patr-Papa-Gogo). HLA-B*27:05, in Clade 2, also associates with control of HIV-1 progression (61), however its inclusion in the clade is supported weakly. HLA-B*27:05 differs from the clade Papa-B and Patr-B allotypes at key functional positions (63 and 70), which contribute to differences in their position 2 (P2) peptide-binding motif (C). Because arginine is the P2 residue of the HIV Gag KK10 epitope targeted by HLA-B*27:05 (80, 81), the associated protective effects of HLA-B*27:05 are unlikely to be preserved by Clade 2 bonobo and chimpanzee alleles, which are likely to bind peptides with P2 proline. (C) Table of amino-acid sequence differences in residues 45–74 of the MHC-B α1 domain. Representatives of each sequence motif within this region for the alleles of tree A are included in the upper part (The full allele set is given in Supplemental Table 1H.). Allotype names are colored according to species or subspecies, as in (A). Identity to the consensus is denoted by a dash. Highlighted in tan are the regions containing motifs that define Clade 1, positions 62–74 (28, 32) and Clade 2, positions 45–74 (Supplemental Fig. 3). Additional HLA-B sequences with the Clade 2 motif are given in the lower portion. Black-filled boxes between the two sets of sequences show which positions contribute to binding sites for peptide, TCR, and KIR. Positions 45, 63, 66, 67, and 70 contribute to the B pocket of the MHC-B molecule, which binds the anchor residue, typically at position 2 (P2), of nonamer peptides. Under “Anchor” are listed the P2 residues for each MHC-B allotype (compiled from the SYFPEITHI database of MHC ligands and peptide motifs, http://www.syfpeithi.de/ (82) and de Groot et al. (31)). MHC-B P2 residues that were inferred from known ligands are italicized and in gray.
Figure 4
Figure 4. High amino acid sequence variability in Papa-B focuses on position 156 in the α2 domain
Plotted in the upper panel is the coefficient of amino acid sequence variability, W, for Papa-B allotypes. Only polymorphic positions are shown. The horizontal dotted line marks the value of W that is twice the mean value for W at all polymorphic positions. For positions that are not dimorphisms, the observed number of alternative amino acids is given above the bar. The lower panel shows amino-acid sequence differences that distinguish the Papa-B allotypes. Identity to the consensus is denoted by a dash. Based on the criteria for phasing exon 2 and exon 3 sequences, Papa-B*21:01 could not be assigned an α1 (exon 2) sequence (see Materials and Methods for details) (Supplemental Fig. 1). Clade 2 allotypes (Hosa-Patr-Papa-Gogo) are highlighted in gray. Pink-filled boxes denote positions that contribute to binding sites for peptide, TCR, KIR, and β2-microglobulin (β2-m), the invariant subunit of MHC class I.
Figure 5
Figure 5. Pie chart of Papa-B allele frequencies in the study population of 110 bonobos
Alleles encoding the Bw4 KIR ligand are colored yellow, and those encoding the C1 KIR ligand are colored purple. Alleles that do not encode a KIR ligand are in shades of gray. Alleles present at more than 3% in the population are labeled. Papa-B*07:01, B*09:01, and B*15:01, highlighted by white boxes, are present in all five well-sampled bonobo populations.
Figure 6
Figure 6. Bonobo Papa-B has less nucleotide sequence diversity than chimpanzee Patr-B and human HLA-B
(A-O) Within-group comparisons of p-distances for MHC-B alleles (exons 2 and 3) are plotted as histograms. (F-O) Between-group comparisons. Mean p-distances (M) are given in the individual panels (A-O) and are also summarized in panel (P); N gives the number of alleles (A-O). See Supplemental Table 1I for statistical results. Papa: Pan paniscus; Pts: Pan troglodytes (P. t.) schweinfurthii; Ptt: P. t. troglodytes; Ptv: P. t. verus; Hosa: Homo sapiens.
Figure 7
Figure 7. Comparison of MHC-B amino acid sequence variability in bonobo, chimpanzee, and humans
Plots of the coefficient of amino-acid sequence variability, W, for MHC-B allotypes within bonobo (A), Pts chimpanzees (B), Ptv chimpanzees (C), three indigenous human populations (D-F), and two urban human populations (G,H). N gives the number of allotypes for each population. Black vertical bars represent positions with no sequence variability; gray bars represent dimorphic positions; and blue bars represent polymorphic positions. The horizontal dotted line is set at twice the mean value of W for all variable positions within a population. The pink-filled boxes show which positions contribute to binding sites for peptide, TCR, KIR, the invariant subunit β2-microglobulin (β2-m), and CD8 T-cell co-receptor (CD8). The Hadza (52), Tao (53, 54), and Yucpa (56) are indigenous populations from Africa (Tanzania), Asia (Taiwan), and South America (Venezuela), respectively; Bergamo and Kampala are admixed urban populations from Europe (Italy) and Africa (Uganda) (53, 54), respectively.
Figure 8
Figure 8. Comparison of Papa-B diversity in the five bonobo populations
(A) Shown are the number of alleles and mean p-distances (+/− standard error of the mean) for MHC-B in the five bonobo populations and their comparison with chimpanzee and human populations. Representing chimpanzee are the wild Gombe Pts (32) and captive BPRC Ptv (31) populations. The p-values shown are from unpaired t tests. *Statistical results of comparisons between bonobo populations and those of chimpanzees and humans are given in (B). The indigenous human populations represent Africa (Hadza, Tanzania) (52), East Asia (Tao, Taiwan) (53, 54), Melanesia (Asaro, Papua New Guinea) (55), and South America (Yucpa, Venezuela) (56). (B) P-values from comparisons of the p-distances of populations in (A) (unpaired t tests). (C) Distribution of mean p-distances for all possible trios of Papa-B alleles that can be permuted from the set of 22 Papa-B (N = 1540). The colored, vertical and dotted lines show the means for all possible Papa-B trios (ALL22, blue dots) and for the three Papa-B alleles of the ML population (ML3, red dots).
Figure 9
Figure 9. Comparison of Papa-B amino acid sequence variability in five bonobo populations
Plots of the coefficient of amino-acid sequence variability, W, for the Papa-B allotypes of the five bonobo populations (numbers of allotypes are given in parentheses). The horizontal dotted line marks the value for W that is twice the mean W value for the polymorphic positions in each population. Above position 156 is given the number of alternative amino acid residues occurring at that position. The pink-filled boxes denote positions that contribute to binding sites for peptide, TCR, KIR, and the invariant subunit β2-microglobulin (β2-m).
Figure 10
Figure 10. MHC-B allele distribution in bonobo, chimpanzee, and human populations
(A) Pie charts for each population showing the proportions of Papa-B alleles that encode the Bw4 epitope (shades of yellow) or the C1 epitope (shades of purple). Alleles not encoding Bw4 or C1 are shaded gray. Each pie segment corresponds to a different allele. Segments in different pies that have identical yellow or purple color denote the same allele, but alleles in the same shade of gray are not necessarily the same allele. Shown for each population are the frequencies, as percentages, for the alleles encoding an epitope recognized by KIR (Bw4 or C1) and alleles that encode neither epitope (None). (B) Pie charts for each population showing frequencies of the 22 Papa-B alleles. Each allele is defined by a different color that is maintained between pies. Segments are organized in order of decreasing frequency. (C) Comparison of the distributions of MHC-B allele frequency distributions in five bonobo populations (upper panels), two chimpanzee (lower panels, left), and four human populations (lower panels, right). The bars give the MHC-B allele frequencies in order of decreasing frequency (top to bottom). The bar graphs for the bonobo populations use the same color scheme to distinguish the Papa-B alleles as in (B). For the chimpanzee and human, each population is distinguished by bars of a different color, but within a population all alleles are colored identically. The Gombe chimpanzees are of the Pts subspecies (red) (32), and the BPRC population is of the Ptv subspecies (green) (31). HLA-B allele frequencies are also shown for the Hadza (52), Tao, Kampala, and Bergamo human populations (black) (53, 54). The Hadza and Tao are indigenous populations from Africa (Tanzania) and Asia (Taiwan), respectively; Kampala and Bergamo are admixed urban populations from Africa (Uganda) and Europe (Italy), respectively. N gives the number of individuals analyzed. Allele frequencies were compared using Fisher’s exact tests. The narrower black brackets (ML, BPRC, Hadza, Tao) show that the most common allele is significantly more frequent than the second-most common allele; the wider black brackets (KR, Gombe) show that the two most common alleles are significantly more frequent than the third-most common allele, but do not differ significantly from each other (p-values given below the bracket (p < 0.0001 applies to both high-frequency Gombe alleles)). In LK, the most common allele is significantly more frequent than the third-most common allele; gray brackets (LK, KR) note alleles that were of nearly significantly different frequencies (p-values < 0.1).

References

    1. Kelley J, Walter L, Trowsdale J. Comparative genomics of major histocompatibility complexes. Immunogenetics. 2005;56:683–695. - PubMed
    1. Brown JH, Jardetzky T, Saper MA, Samraoui B, Bjorkman PJ, Wiley DC. A hypothetical model of the foreign antigen binding site of Class II histocompatibility molecules. Nature. 1988;332:845–850. - PubMed
    1. Villadangos JA. Presentation of antigens by MHC class II molecules: getting the most out of them. Mol Immunol. 2001;38:329–346. - PubMed
    1. Colonna M, Samaridis J. Cloning of immunoglobulin-superfamily members associated with HLA-C and HLA-B recognition by human natural killer cells. Science. 1995;268:405–408. - PubMed
    1. Zinkernagel RM, Doherty PC. Restriction of in vitro T cell-mediated cytotoxicity in lymphocytic choriomeningitis within a syngeneic or semiallogeneic system. Nature. 1974;248:701–702. - PubMed

Publication types

Substances