. 2017 Mar 28:8:14782.
doi: 10.1038/ncomms14782.

Endocannabinoid signalling modulates susceptibility to traumatic stress exposure

Affiliations

Endocannabinoid signalling modulates susceptibility to traumatic stress exposure

Rebecca J Bluett et al. Nat Commun. .

Abstract

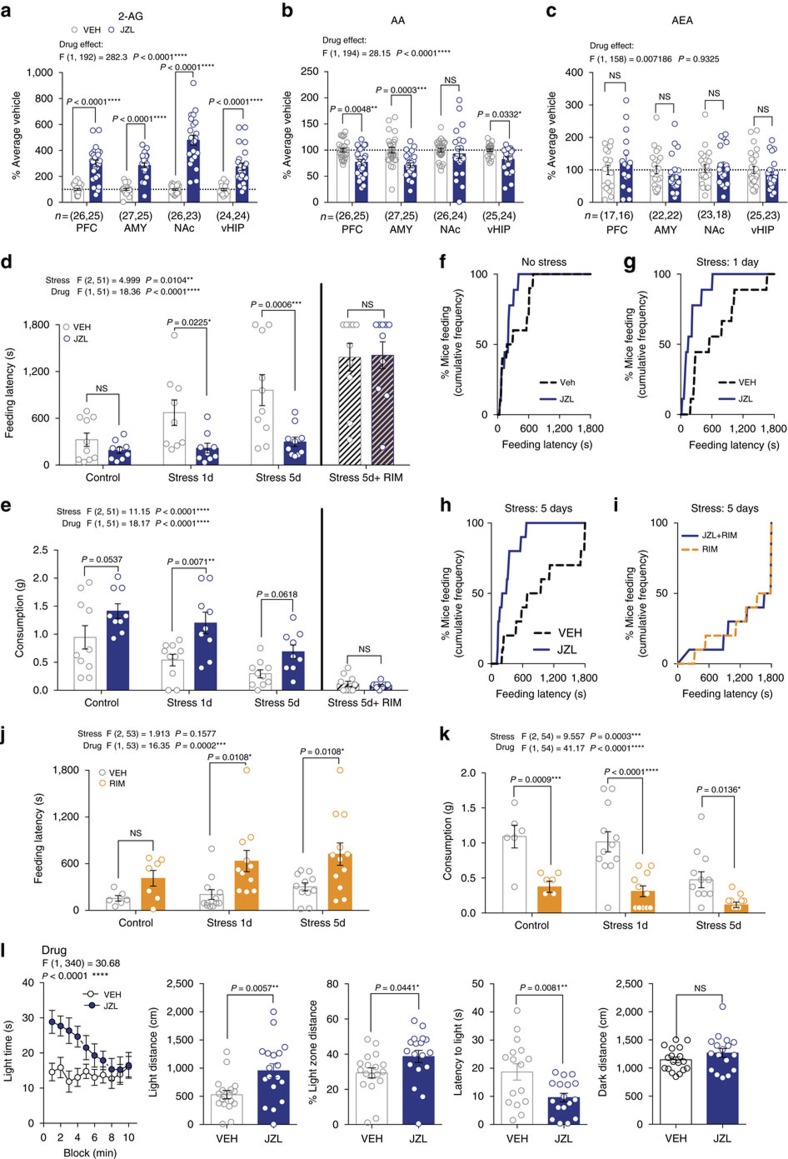
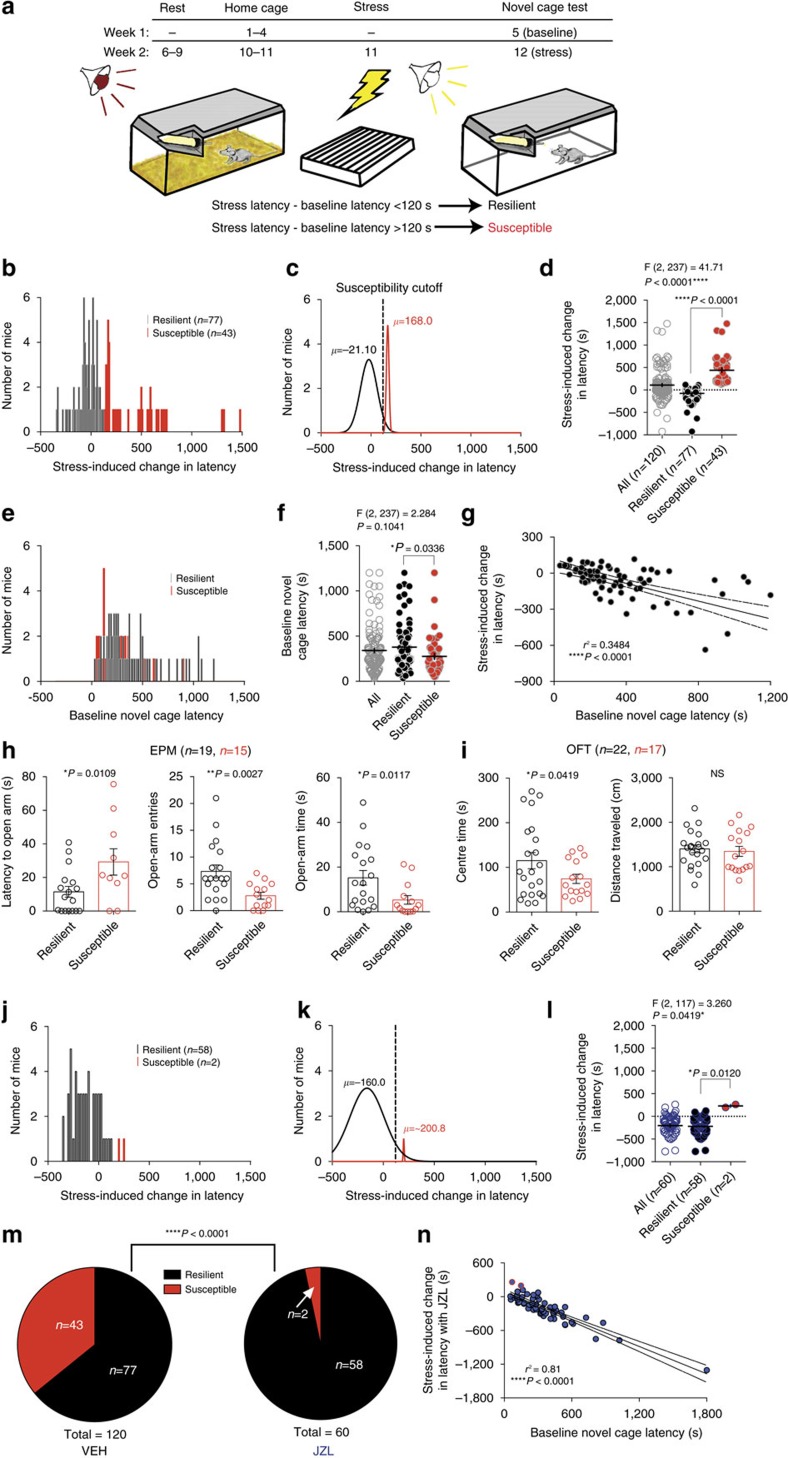
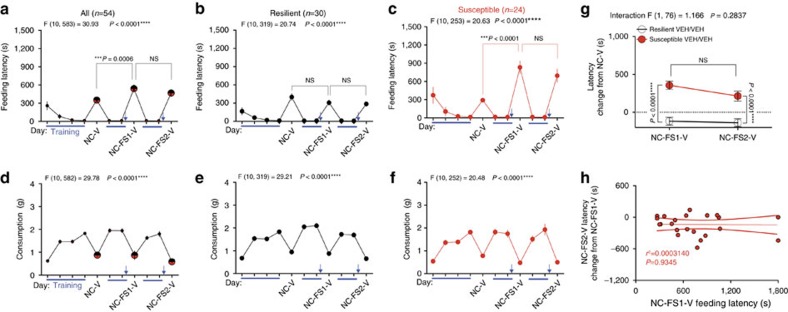
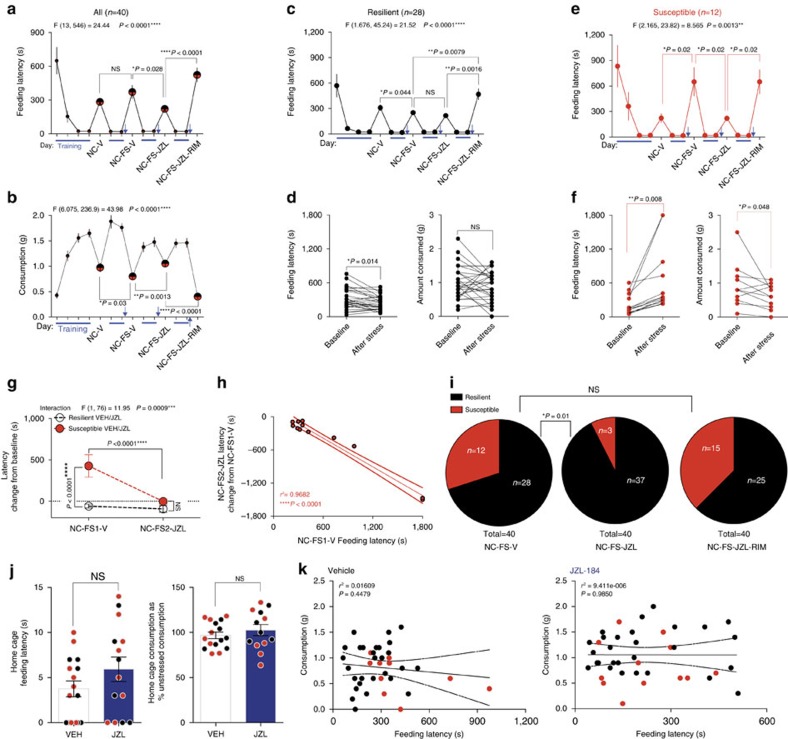
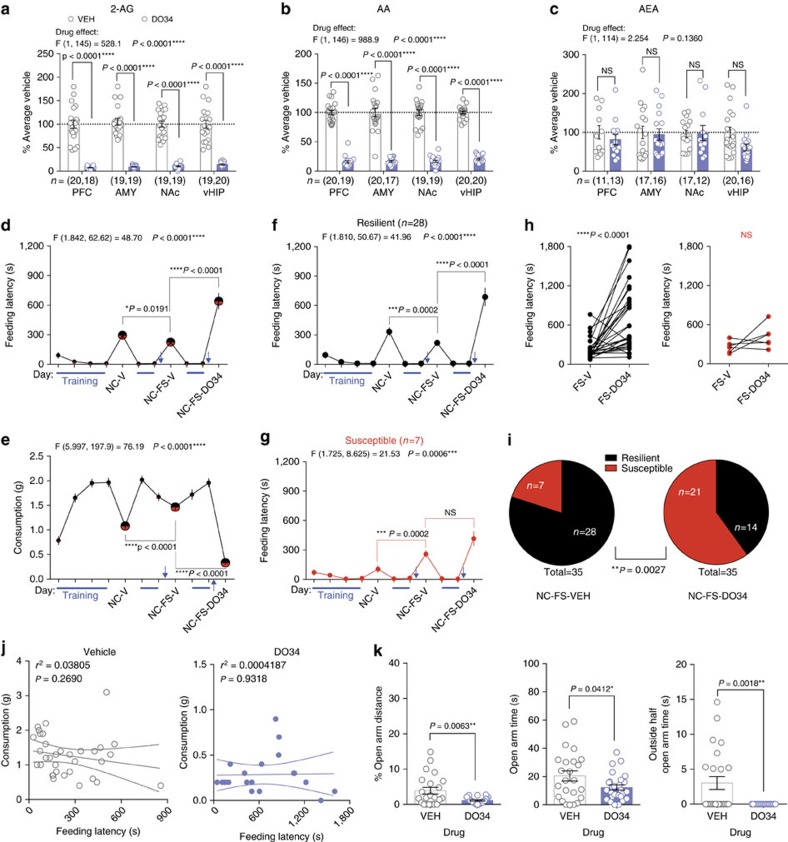
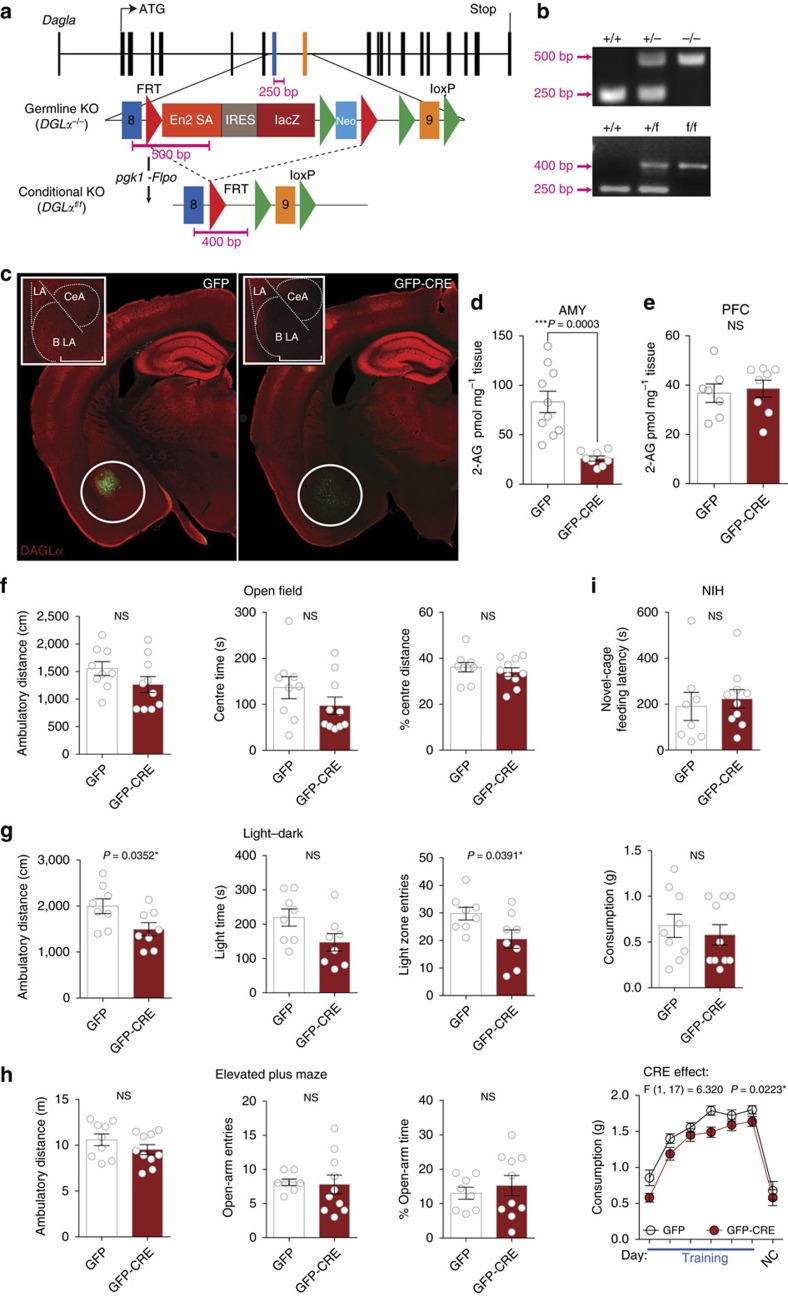
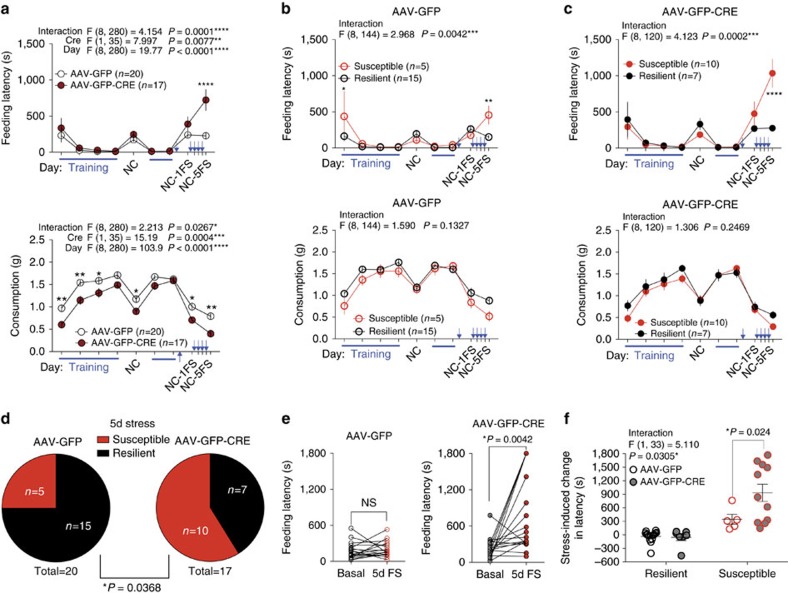
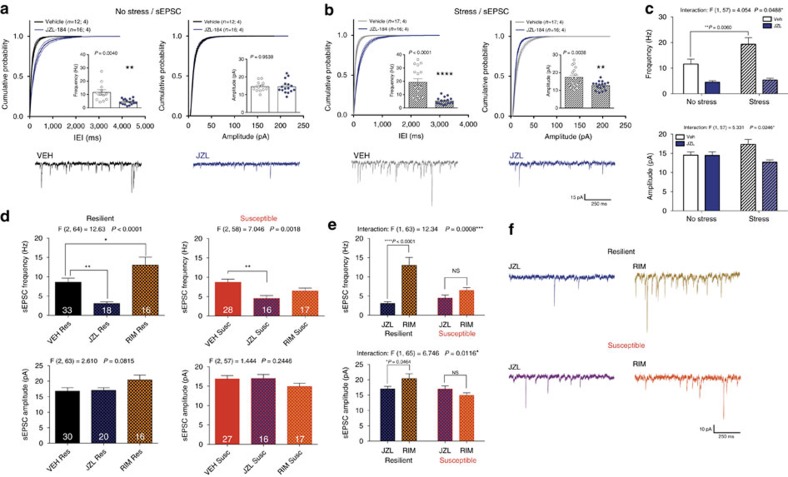
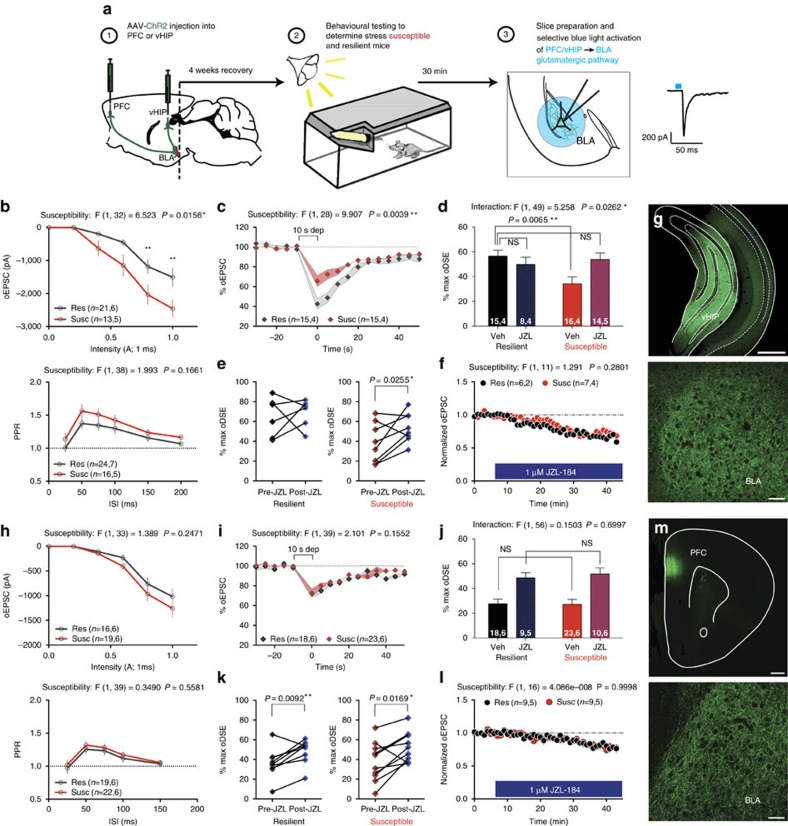
Stress is a ubiquitous risk factor for the exacerbation and development of affective disorders including major depression and posttraumatic stress disorder. Understanding the neurobiological mechanisms conferring resilience to the adverse consequences of stress could have broad implications for the treatment and prevention of mood and anxiety disorders. We utilize laboratory mice and their innate inter-individual differences in stress-susceptibility to demonstrate a critical role for the endogenous cannabinoid 2-arachidonoylglycerol (2-AG) in stress-resilience. Specifically, systemic 2-AG augmentation is associated with a stress-resilient phenotype and enhances resilience in previously susceptible mice, while systemic 2-AG depletion or CB1 receptor blockade increases susceptibility in previously resilient mice. Moreover, stress-resilience is associated with increased phasic 2-AG-mediated synaptic suppression at ventral hippocampal-amygdala glutamatergic synapses and amygdala-specific 2-AG depletion impairs successful adaptation to repeated stress. These data indicate amygdala 2-AG signalling mechanisms promote resilience to adverse effects of acute traumatic stress and facilitate adaptation to repeated stress exposure.


Conflict of interest statement

S.P. and L.M. have an active collaborative research contract with Lundbeck Pharmaceuticals, however, the work presented in the paper was supported solely by the NIH, the Brain & Behavior Research Foundation, and Vanderbilt University.

Figures

Figure 1
Figure 1. Modulation of stress-induced anxiety-like behaviour by 2-AG signalling.
(ac) Effects of JZL-184 (8 mg kg−1; blue) on 2-arachidonoylglycerol (2-AG), arachidonic acid (AA), and anandamide (AEA) in the prefrontal cortex (PFC), amygdala (AMY), nucleus accumbens (NAc), and ventral hippocampus (vHIP). Data combined from two independent experiments. (d,e) Effects of JZL-184 treatment on feeding latency (top) and consumption (bottom) in the novelty-induced hypophagia test (NIH) without stress, after 1 or 5 days of foot-shock stress, and after 5 days of stress in combination with the CB1R inverse agonist Rimonabant (RIM; 1 mg kg−1). (fi) Cumulative feeding latency distributions of vehicle and JZL-184-treated mice without stress, after 1 or 5 days of foot-shock stress, and after 5 days of stress in combination with Rimonabant. (j,k) Effects of Rimonabant (orange) on feeding latency and consumption in NIH without stress, and after 1 and 5 days of foot-shock stress. (i) Effects of JZL-184 treatment in the light-dark box test after 1 day of foot-shock stress. F and P values for two-way ANOVA shown above (ae,jl). P values shown for pairwise comparisons derived from Holm-Sidak multiple comparisons test after ANOVA or unpaired two-tailed t-test (l). Data are presented as mean±s.e.m.
Figure 2
Figure 2. Elevating 2-AG shifts the distribution of stress-susceptibility toward resilience.
(a) Schematic of behavioural paradigm. (b) Histogram of stress-induced change in latency (stress latency minus baseline latency) to consume in the NIH novel-cage test. (c) Gaussian curves fitting the resilient (black) and susceptible (red) subpopulations. Dashed line indicates 120-second post-stress latency increase susceptibility cutoff. (d) Stress-induced change in latency in the whole population and split into susceptible and resilient subgroups. (e) Histogram of pre-stress novel cage latencies categorized by resilience. (f) Individuals' pre-stress novel-cage latencies. (g) Correlation of resilient subpopulation's baseline and post-stress changes in latency. (h) Elevated plus maze (EPM) and (i) open-field test (OFT) measured 24 h after foot-shock stress, one week after susceptibility characterization. (j) Histogram of 24 h post-stress changes in latency with JZL-184 treatment 2 h before testing. (k) Gaussian distributions for resilient and susceptible subpopulations with JZL-184 treatment. (l) Stress-induced change in latency in the whole population and split into susceptible and resilient subgroups with JZL-184 treatment. (m) Proportion of susceptible and resilient mice after either vehicle (VEH) or JZL-184 treatment. (n) Correlation between pre-stress latencies and stress-induced changes in latency with JZL-184. Data in ag was aggregated from 3 cohorts of 40 mice that were used for subsequent experiments (see Methods for details). F and P values for one-way ANOVA shown above (d,f,l). P values shown for pairwise comparisons derived from Sidak multiple comparisons test after ANOVA (d,f,l) or unpaired one-tailed t-test (h,i) shown in each panel. R2 and P value for linear regression reported in g,n. P value from chi-squared test reported with susceptibility ratios (m). Data are presented as mean±s.e.m.
Figure 3
Figure 3. Stress susceptibility is a stable trait.
(ac) Home cage training (blue lines) and novel cage (NC-V) latencies and (df) consumption across one baseline and two novel-cage foot-shock stress tests (NC-FS1-V and NC-FS2-V) with vehicle treatment. (g) Direct comparison of the latency change from baseline between the two post-stress NIH novel cage tests. (h) Correlation between the first stress-test latency and the change in latency between the 2nd and 1st stress novel-cage tests for susceptible individuals. Blue arrows indicate foot-shock stress exposure. F and P values for one-way (af) or two-way (g) ANOVA shown above individual panels. P values shown for pairwise comparisons from Holm-Sidak multiple comparisons test after ANOVA. R2 and P value for linear regression shown in h. Data are presented as mean±s.e.m.
Figure 4
Figure 4. 2-AG augmentation promotes resilience to acute stress-induced anxiety-like behaviour.
(a) Home cage training (blue lines) and novel cage (NC) latencies and (b) consumption before (NC-V) and after (NC-FS-V) foot-shock stress with vehicle (V), JZL-184, and JZL-184+Rimonabant (RIM) treatment. (c) Resilient subgroup latencies separated from a. (d) Resilient individuals' baseline and post-stress latencies and consumption. (e) Susceptible subgroup latencies separated from a. (f) Susceptible individuals' baseline and post-stress latencies and consumption. (g) Direct comparison of changes in latency from baseline between the 2nd stress test with JZL-184 (NC-FS2-JZL) and the first stress test with vehicle (NC-FS1-V). (h) Correlation between stress-test latency and change in latency between JZL-184 and vehicle treatment for susceptible individuals. (i) Stress-susceptibility ratios for the same cohort of mice across three weeks after vehicle, JZL-184, or JZL-184+Rimonabant treatment. (j) Home cage testing latency (left) and consumption as % of previous day's home cage/no stress consumption (right) 24 h after stress exposure with resilient (black circles) and susceptible (red circles) individuals treated with vehicle (VEH) or JZL-184 (blue) one week after susceptibility categorization. (k) Whole population correlations between post-stress novel cage test feeding latency and consumption with vehicle and JZL-184 treatment. Blue arrows indicate foot-shock stress exposure. F and P values for one-way (ac,e) or two-way (g) ANOVA shown above individual panels. P values for pairwise comparisons derived from Holm-Sidak multiple comparisons test after ANOVA, unpaired two-tailed t-test (j), or paired two-tailed t-test (d,f) shown in panels. R2 and P value for linear regression shown in h,k. P values from chi-squared tests reported in i. Data are presented as mean±s.e.m.
Figure 5
Figure 5. 2-AG depletion increases susceptibility to acute stress-induced anxiety-like behaviour.
(ac) Effects of DO34 (50 mg kg−1; purple) on 2-arachidonoylglycerol (2-AG), arachidonic acid (AA), and anandamide (AEA) in the prefrontal cortex (PFC), amygdala (AMY), nucleus accumbens (NAc), and ventral hippocampus (vHIP). (d) Home cage training (blue lines) and novel cage (NC) latencies and (e) consumption before (NC-V) and after (NC-FS-V) foot-shock stress with vehicle (V) or DO34 treatment. (f) Resilient and (g) susceptible subgroup latencies separated from d. (h) Effects of DO34 on feeding latency relative to vehicle treatment in resilient (black) and susceptible (red) mice. (i) Stress-susceptibility ratios for the same cohort of mice across two weeks after vehicle or DO34 treatment. (j) Resilient population correlations between novel cage test feeding latency and consumption with vehicle and DO34 treatment. (k) Elevated plus maze 24 h after stress exposure with resilient individuals treated with vehicle (VEH) or DO34 (purple) one week after susceptibility categorization. Blue arrows indicate foot-shock stress exposure. F and P values for one-way (dg) or two-way (ac) ANOVA shown above individual panels. P values for pairwise comparisons derived from Holm-Sidak multiple comparisons test after ANOVA, unpaired two-tailed t-test (k), or paired two-tailed t-test (h) shown in panels. R2 and P value for linear regression shown in j. P value from chi-squared test reported in i. Data are presented as mean±s.e.m.
Figure 6
Figure 6. Conditional DAGLα knockout mice and BLA-specific DAGLα deletion.
(a) Diagram of targeting construct and strategy for the generation of DAGLαf/f mouse. Mice harboring dagla gene-trap cassette were crossed to pgk-Flpo mice to generate conditional knockouts with loxP sites flanking exon 9. (b) PCR products for genotyping of germline (DAGLα−/−) and conditional (DAGLαf/f) knockouts. Primer binding sites shown in a. (c) Representative coronal brain slices from DAGLαf/f mouse after BLA-AAV-GFP (left) and BLA-AAV-GFP-CRE (right) injection, and 20X magnification of BLA-DAGLα immunoreactivity of BLA-GFP control and BLA-GFP-CRE injected mice (square insets). White circles represent typical brain punch dissections for mass spectrometry. Inset scale bars are 500 μm. (d) Amygdala 2-AG levels after AAV-GFP and AAV-GFP-CRE BLA-injection from punch biopsies as indicated by white circles in c. (e) PFC 2-AG levels after BLA-AAV-GFP and BLA-AAV-GFP-CRE injection. (f) Effect of AAV-GFP vs. AAV-GFP-CRE BLA-injection on behaviour in open-field, (g) light-dark box, and (h) elevated plus-maze. (i) Effect of AAV-GFP vs. AAV-GFP-CRE BLA-injection on baseline novelty-induced hypophagia (NIH) testing. P values shown for unpaired one-tailed t-test above each di. F and P values for two-way ANOVA shown in i. Data are presented as mean±s.e.m.
Figure 7
Figure 7. BLA-2-AG signalling is required for resilience to repeated traumatic stress.
(a) Effect of AAV-GFP vs. AAV-GFP-CRE BLA-injection on home cage NIH training (blue lines) and novel cage latency (top) and consumption (bottom) with no stress (NC), 24 h after 1 day of stress (NC-1FS), and 24 h after a 5th day of stress (NC-5FS). (b) AAV-GFP latency (top) and consumption (bottom) from a split into resilient (black) and susceptible (red) groups. (c) AAV-GFP-CRE latency (top) and consumption (bottom) from a split into resilient (black) and susceptible (red) groups. (d) 5-day stress susceptibility ratios for BLA AAV-GFP and AAV-GFP-CRE injected groups. (e) Paired individual baseline and post-stress latencies in AAV-GFP and AAV-GFP-CRE BLA-injected groups. (f) Direct comparison of stress-induced changes in latency in resilient and susceptible AAV-GFP vs. AAV-GFP-CRE BLA-injected mice. Data combined from 2 independent cohorts. Blue arrows in ac indicate stress exposure, which occurred once per day for 5 consecutive days. F and P values for two-way ANOVA shown above individual (ac,f). P values for pairwise comparisons derived from Holm-Sidak multiple comparisons test after ANOVA, paired two-tailed t-test (e), and chi-squared test reported (d) in each panel. Data are presented as mean±s.e.m.
Figure 8
Figure 8. Stress-induced increases in sEPSC frequency in the BLA are eliminated by JZL-184 incubation.
(a) Effect of JZL-184 incubation on the inter-event interval (IEI; left), frequency (left inset) and amplitude (right) of spontaneous excitatory postsynaptic currents (sEPSCs) onto BLA pyramidal cells in control non-stressed mice, and (b) 24 h after foot-shock stress exposure. (c) Direct comparison of stress effect and JZL-184 effect from a and b. (d) Direct comparison of resilient (left; black) and susceptible (right; red) BLA sEPSC frequency (top) and amplitude (bottom) with vehicle (VEH) and either JZL-184 (blue hash) or Rimonabant (RIM; orange hash) incubation. (e) Direct comparison of the dynamic range of eCB signalling (defined as the difference in sEPSC frequency (top) and amplitude (bottom) between JZL-184 and Rimonabant conditions shown in d with representative traces in f. Number of cells is shown for each group. Number of (cells; animals) are reported in a and b. Number of cells reported in d. F and P values for one-way (d) or two-way (c,e) ANOVA shown above individual panels. P value for pairwise comparisons derived from Holm-Sidak multiple comparison test after ANOVA (ce) or unpaired t-test (a,b) shown in individual panels. Data are presented as mean±s.e.m.
Figure 9
Figure 9. Stress-resilience is associated with greater 2-AG modulation of vHIP-BLA glutamatergic synapses.
(a) Schematic of the experimental procedure for optogenetic recordings. (bg) Optogenetic recordings at vHIP-BLA synapses. (hm) Optogenetic recordings at PFC-BLA synapses. (b,h) Optically evoked input-output curves and paired pulse ratio. (c,i) Depolarization-induced suppression of excitation (oDSE) in susceptible and resilient population. (d,j) Direct comparison of the effect of JZL-184 on the magnitude of oDSE in resilient versus susceptible groups. (e,k) Paired comparison of % maximal oDSE in the same cell pre- and post-JZL-184 incubation for resilient and susceptible groups. (f,l) 1 μM JZL-184-induced depression of optically evoked EPSCs. (g,m) Representative images of the vHIP and PFC injection sites, and the corresponding BLA recording sites. Number of (cells, animals) are presented within each panel. F and P values for two-way ANOVA shown above individual (bd,f,hj,l). P values shown for pairwise comparisons derived from Holm-Sidak multiple comparisons test after ANOVA or paired two-tailed t-test (e,k). Data are presented as mean±s.e.m. Scale bars are 500 μm for vHIP and PFC images, 50 μm for BLA.

References

    1. McEwen B. S. Brain on stress: how the social environment gets under the skin. Proc. Natl Acad. Sci. USA 109, 17180–17185 (2012). - PMC - PubMed
    1. Sharma S., Powers A., Bradley B. & Ressler K. Gene x environment determinants of stress- and anxiety-related disorders. Annu. Rev. Psychol. 67, 239–261 (2015). - PMC - PubMed
    1. Faravelli C. Life events preceding the onset of panic disorder. J. Affect. Disord. 9, 103–105 (1985). - PubMed
    1. Kendler K. S., Karkowski L. M. & Prescott C. A. Causal relationship between stressful life events and the onset of major depression. Am. J. Psychiatry 156, 837–841 (1999). - PubMed
    1. Kessler R. C. et al.. Lifetime prevalence and age-of-onset distributions of DSM-IV disorders in the National Comorbidity Survey Replication. Arch. Gen. Psychiatry 62, 593–602 (2005). - PubMed

Publication types

MeSH terms