. 2017 Mar 27;7(1):440.
doi: 10.1038/s41598-017-00588-9.

Cooperation and competition shape ecological resistance during periodic spatial disturbance of engineered bacteria

Affiliations

Cooperation and competition shape ecological resistance during periodic spatial disturbance of engineered bacteria

Cortney E Wilson et al. Sci Rep. .

Abstract

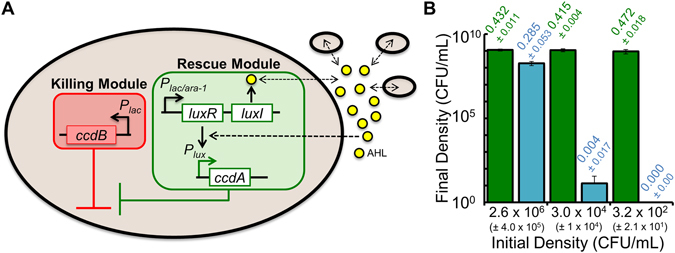
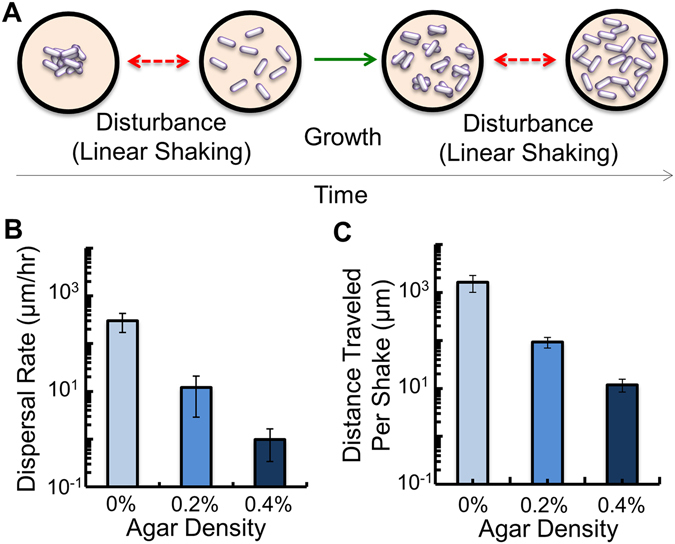
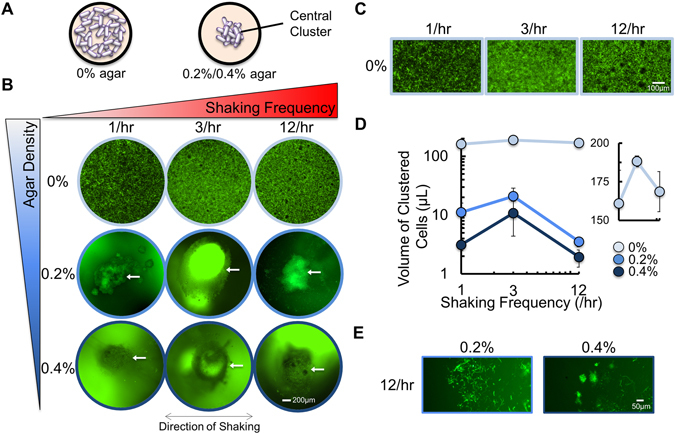
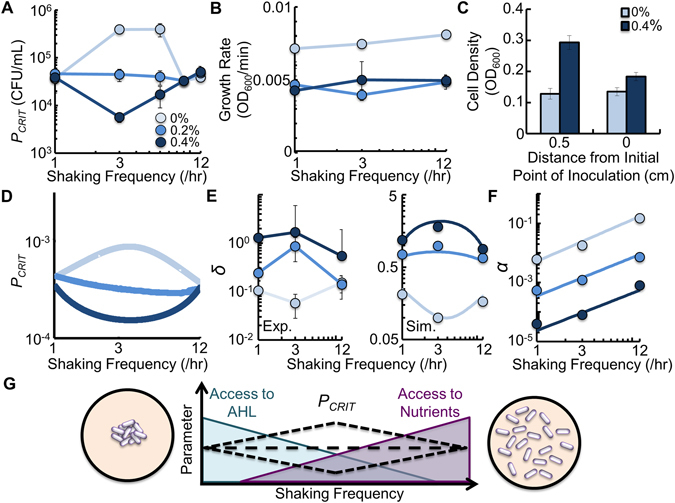
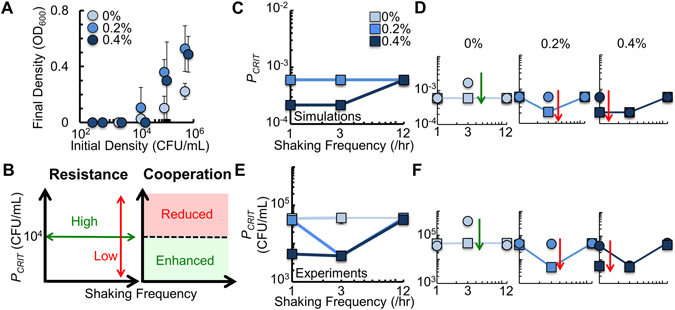
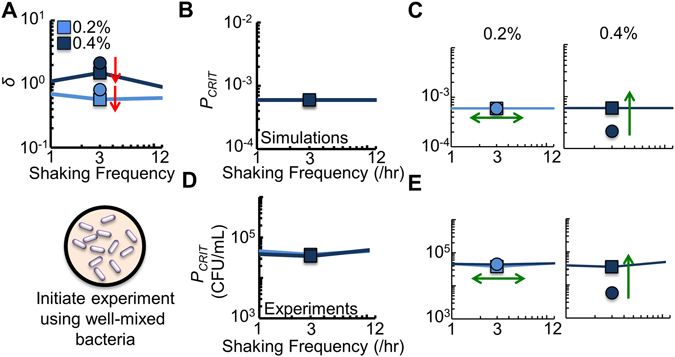
Cooperation is fundamental to the survival of many bacterial species. Previous studies have shown that spatial structure can both promote and suppress cooperation. Most environments where bacteria are found are periodically disturbed, which can affect the spatial structure of the population. Despite the important role that spatial disturbances play in maintaining ecological relationships, it remains unclear as to how periodic spatial disturbances affect bacteria dependent on cooperation for survival. Here, we use bacteria engineered with a strong Allee effect to investigate how the frequency of periodic spatial disturbances affects cooperation. We show that at intermediate frequencies of spatial disturbance, the ability of the bacterial population to cooperate is perturbed. A mathematical model demonstrates that periodic spatial disturbance leads to a tradeoff between accessing an autoinducer and accessing nutrients, which determines the ability of the bacteria to cooperate. Based on this relationship, we alter the ability of the bacteria to access an autoinducer. We show that increased access to an autoinducer can enhance cooperation, but can also reduce ecological resistance, defined as the ability of a population to resist changes due to disturbance. Our results may have implications in maintaining stability of microbial communities and in the treatment of infectious diseases.


Conflict of interest statement

The authors declare that they have no competing interests.

Figures

Figure 1
Figure 1
The engineered bacteria used in this study. (A) The gene circuit consists of two modules: a killing module (red shading) and a rescue module (green shading). The killing module contains an IPTG inducible (P lac promoter) ccdB gene from the CcdA/CcdB toxin-antitoxin system. The rescue module contains an IPTG inducible (P lac/ara-1 promoter) luxR/luxI quorum-sensing (QS) system from Vibrio fischeri and an AHL inducible (P lux promoter) ccdA from the CcdA/CcdB toxin-antitoxin system. Induction with IPTG (1 mM) causes expression of luxR/luxI and ccdB. ccdB causes cell death. However, ccdA can inhibit ccdB if luxI synthesizes a sufficient amount of AHL (yellow circles), which is dependent upon the initial density of bacteria in the population. (B) Final density of engineered bacteria (CFU/mL) in cultures incubated for 48 hours starting from different initial densities (see Methods for details) Green bars = no IPTG, circuit off. Blue bars = IPTG, circuit on. An OD600 of 0 indicates that no CFUs were detectable in the medium. Standard deviation (SD) from a minimum of three biological replicates.
Figure 2
Figure 2
Quantifying the movement of gfp-expressing bacteria during linear shaking. (A) We periodically altered the spatial distribution of the bacterial population by shaking the microplate linearly. This dispersed the bacteria away from their positions where, after a period of time, their positions were disturbed again. (B) Average dispersal rate of bacteria in medium with different agar densities, and in the absence of shaking (see Methods). p ≤ 0.03 amongst all conditions (two-tailed t-test in panels (A,B)). SD from six biological replicates. (C) Average distance travelled by the bacteria after a single shake in the microplate reader (see Methods). For all comparisons, p ≤ 0.05. SD from a minimum of three biological replicates.
Figure 3
Figure 3
Periodic shaking of gfp-expressing bacteria in a microplate reader alters their spatial distribution. (A) When gfp-expressing bacteria were grown in medium with 0% agar, bacteria were spread amongst the well. When bacteria were grown in medium with 0.2% or 0.4% agar, the majority of bacteria were confined to a central cluster at the initial point of inoculation. (B) Representative images of gfp-expressing bacteria during periodic shaking of the microplate. The central cluster is indicated with a white arrow. For panels B, C and E, images taken at 24 hours. (C) Representative images of bacteria in 0% agar with increased magnification. (D) The volume of clustered gfp-expressing bacteria. In all agar densities, the volume of bacteria was highest at an intermediate shaking frequency (3/hr). Inset: Data expanded to show trend in medium with 0% agar. p< 0.048 when 1/hr and 12/hr are compared to 3/hr demonstrating significance in biphasic trend (one-tailed t-test). Volume calculated as described in Methods. SD from a minimum of three biological replicates. (E) Representative images of bacteria outside of the central cluster. Bacteria were scattered, less numerous and formed smaller colonies.
Figure 4
Figure 4
Access to AHL and access to nutrients determines P CRIT during periodic spatial disturbance. (A) P CRIT of engineered bacteria shaken at different frequencies and agar densities. At 1/hr, 9/hr and 12/hr, P CRIT was identical in all agar densities (p ≥ 0.36). At 3/hr and 6/hr, P CRIT decreased with increasing agar density (p ≤ 0.04). Raw data in Supplementary Fig. S1. P CRIT as a function of δ in Supplementary Fig. S2. Two-tailed t-tests for P CRIT in Supplementary Tables S1 and S2. For panels with experimental data, SD from a minimum of three biological replicates. (B) Growth rate of engineered bacteria at different frequencies and agar densities. Bacteria in medium with 0% agar had a higher growth rate than bacteria in 0.2% and 0.4% agar (p ≤ 0.002, two-tailed t-test). p = 0.53 when 0.2% and 0.4% agar are compared to each other. (C) OD600 reached by bacteria after growing for 16 hours in medium obtained from previous cultures with 0% and 0.4% agar. In both cases, the medium was obtained at 0 cm and 0.5 cm from the initial point of inoculation. In 0% agar, OD600 was the same after 16 hours (p = 0.574). In 0.4% agar, OD600 was higher in the sample taken 0.5 cm away from the initial point of inoculation (p = 0.004, Methods and Supplementary Results). (D) Simulation results demonstrating how P CRIT is affected by shaking frequency (Equations (1–3), see Methods). (E) Values of δ from experimental data (left panel) and in our model (right panel, see Methods). For experimental data, p ≤ 0.05 for comparisons within and between different frequencies and agar densities except p = 0.27 when 1/hr and 12/hr are compared in medium with 0.4% agar (two-tailed t-test). (F) Values of α in our model that were qualitatively fit to Fig. 2C (see Supplementary Results). (G) Schematic of mechanism. With low shaking frequency, bacteria are clustered, increasing AHL access but reducing nutrients access through increased competition. With high shaking frequency, AHL access is reduced, but access to nutrient is increased through decreased competition. The non-linearity of these opposing trends cause changes in P CRIT at intermediate shaking frequency.
Figure 5
Figure 5
Increasing access to AHL perturbs the ability of bacteria to resist periodic spatial disturbance. (A) P CRIT of engineered bacteria grown in different agar densities but in the absence of shaking. Average P CRIT observed in all three agar densities was 4.84 × 104 ± 1.91 × 104 CFU/mL (p = 0.12, two-tailed t-test). Two-tailed t-tests for each P CRIT in Supplementary Tables S1 and S2. SD from twelve measurements, consisting of at least three biological replicates per agar density. (B) Measuring resistance and cooperation. Left: In an undisturbed environment, P CRIT was ~104 CFU/mL. If the bacteria were resistant to disturbance, P CRIT would remain at this density (green arrow). Changes in P CRIT show a decrease in resistance (red arrow). Right: Cooperation is enhanced (green) or reduced (red) if P CRIT is reduced or increased from ~104 CFU/mL, respectively. (C) Simulation results (Equations (1–3)) showing P CRIT with decreased k d. For simplicity, we show the three shaking frequencies measured experimentally. For a high-resolution simulation, consult Supplementary Fig. S5. (D) Individual simulations with decreased k d. Squares indicate simulation data performed with decreased k d. Circles indicate simulation data re-plotted from Fig. 4D. For panels (D,F), green arrows indicate increased resistance. Red arrows indicated reduced resistance. Direction of arrow indicates perturbation to P CRIT. (E) P CRIT of engineered bacteria grown in medium with pH 7.0. Two-tailed t-tests for each P CRIT in Supplementary Tables S1 and S2, including comparisons between P CRIT in medium with pH 7.4 and pH 7.0. SD from a minimum of three biological replicates. (F) Individual experiments for each agar density. Squares indicate P CRIT from bacteria grown in medium with pH 7.0. Circles are re-plotted from Fig. 4A. Raw data in Supplementary Fig. S5.
Figure 6
Figure 6
Decreasing access to AHL can increase resistance but reduces cooperation. (A) To reduce access to AHL in the model, we decreased δ by 0.7 at 3/hr (relative to δ presented in Fig. 2E). Experimentally, we mixed the bacteria in the well at the beginning of the experiment. For all panels, squares indicate decreased δ. Circles represent data re-plotted from Fig. 4. (B) Simulations results (Equations (1–3)) showing P CRIT with decreased δ. For simplicity, we show the three shaking frequencies measured experimentally. (C) The result of individual simulations for each shaking frequency examined. For panels (C,E), green arrows indicate resistance increased (single ended arrow) or remained unchanged (double ended arrow). Direction of arrow indicates perturbation to P CRIT. (D) P CRIT of engineered bacteria that were initially well-mixed in the microplate well. Two-tailed t-tests for each P CRIT in Supplementary Tables S1 and S2, including comparisons between the well-mixed and non well-mixed initial conditions. SD from a minimum of three biological replicates. (E) Individual experiments for each agar density. Raw data in Supplementary Fig. S6.

References

    1. Redfield, R. J. Is quorum sensing a side effect of diffusion sensing? Trends in Microbiology10, 365–370, doi:http://dx.doi.org/10.1016/S0966-842X(02)02400-9 (2002). - PubMed
    1. Waters CM, Bassler BL. Quorum sensing: cell-to-cell communication in bacteria. Annual Review of Cell and Developmental Biology. 2005;21:319–346. doi: 10.1146/annurev.cellbio.21.012704.131001. - DOI - PubMed
    1. Steidle A, et al. Visualization of N-acylhomoserine lactone-mediated cell-cell communication between bacteria colonizing the tomato rhizosphere. Applied and Environmental Microbiology. 2001;67:5761–5770. doi: 10.1128/AEM.67.12.5761-5770.2001. - DOI - PMC - PubMed
    1. Zhu J, et al. Quorum-sensing regulators control virulence gene expression in Vibrio cholerae. Proceedings of the National Academy of Sciences USA. 2002;99:3129–3134. doi: 10.1073/pnas.052694299. - DOI - PMC - PubMed
    1. Schmid-Hempel P, Frank SA. Pathogenesis, virulence, and infective dose. PLoS Pathogens. 2007;3:e147. doi: 10.1371/journal.ppat.0030147. - DOI - PMC - PubMed

Publication types

LinkOut - more resources