. 2017 Mar 28:8:14880.
doi: 10.1038/ncomms14880.

Plasmonic hot electron transport drives nano-localized chemistry

Affiliations

Plasmonic hot electron transport drives nano-localized chemistry

Emiliano Cortés et al. Nat Commun. .

Abstract

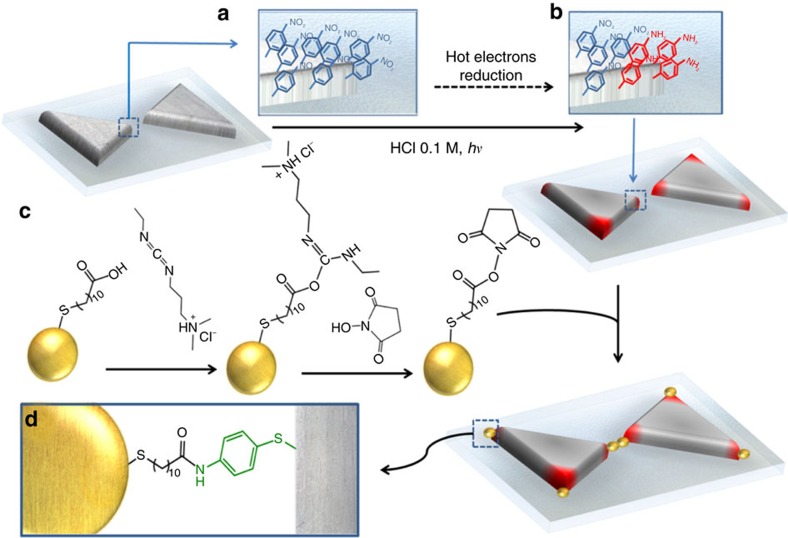
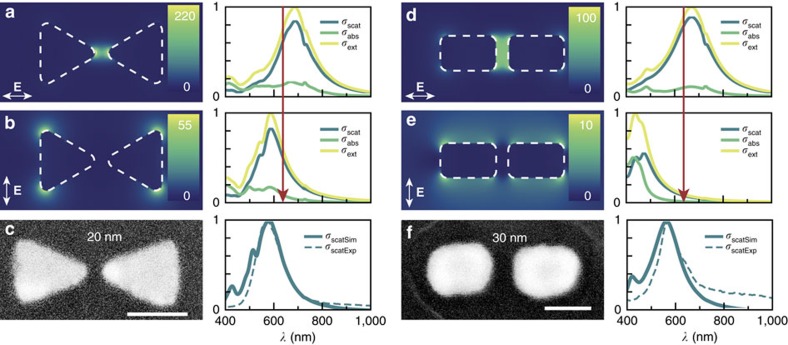
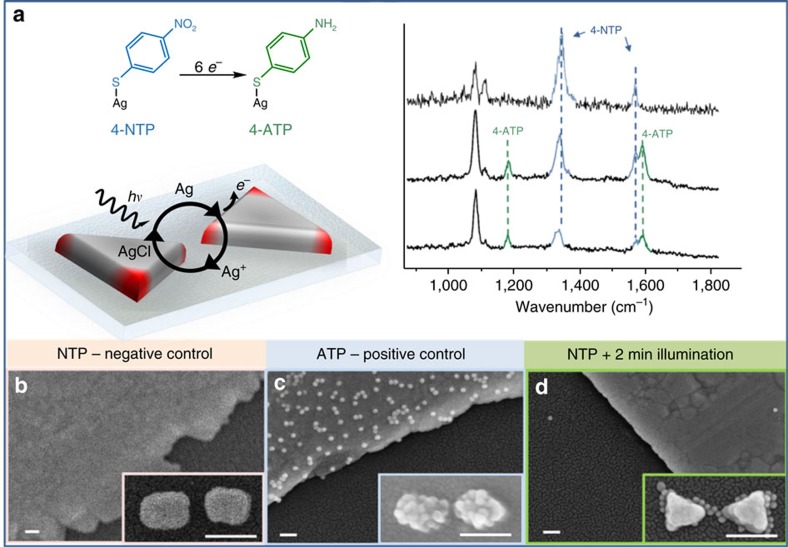
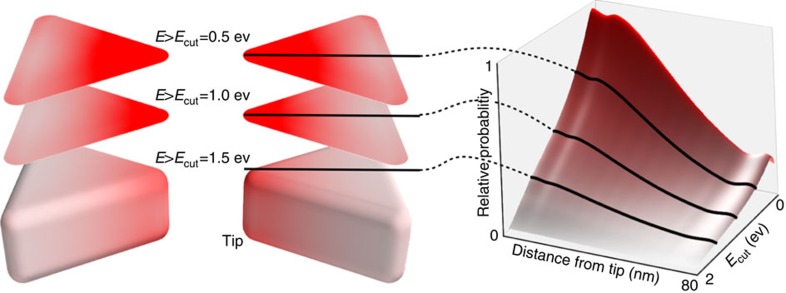
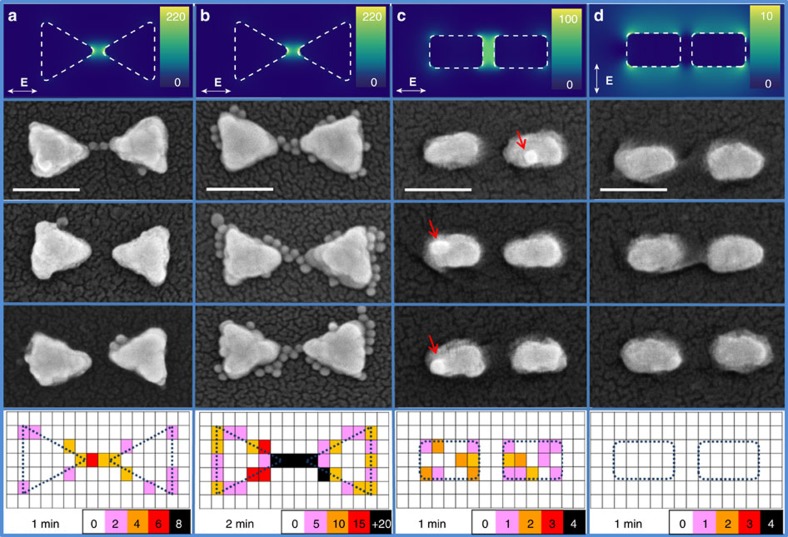
Nanoscale localization of electromagnetic fields near metallic nanostructures underpins the fundamentals and applications of plasmonics. The unavoidable energy loss from plasmon decay, initially seen as a detriment, has now expanded the scope of plasmonic applications to exploit the generated hot carriers. However, quantitative understanding of the spatial localization of these hot carriers, akin to electromagnetic near-field maps, has been elusive. Here we spatially map hot-electron-driven reduction chemistry with 15 nm resolution as a function of time and electromagnetic field polarization for different plasmonic nanostructures. We combine experiments employing a six-electron photo-recycling process that modify the terminal group of a self-assembled monolayer on plasmonic silver nanoantennas, with theoretical predictions from first-principles calculations of non-equilibrium hot-carrier transport in these systems. The resulting localization of reactive regions, determined by hot-carrier transport from high-field regions, paves the way for improving efficiency in hot-carrier extraction science and nanoscale regio-selective surface chemistry.


Conflict of interest statement

The authors declare no competing financial interests.

Figures

Figure 1
Figure 1. Scheme of the local surface chemistry modification and AuNPs tracking approach.
(a) Ag nanoantennas were modified overnight with 1 mM ethanolic solution of 4-NTP. Several ethanol/water washing steps were performed on each sample. (b) 4-NTP-coated antennas were immersed in 0.1 M HCl solution and illuminated for different times at their LSPR wavelength (633 nm) with a power density of 1 W cm−2. Samples were rinsed with water and immediately dipped in the activated AuNP suspension. (c) AuNPs (15 nm) coated with 11-mercaptoundecanoic acid (MUA) as a capping layer were suspended in HEPES buffer and mixed with 1 mM EDC and 1 mM NHS, and left to react for 30 min followed by two purification centrifugation steps. (d) The activated and purified AuNPs were left in contact with the hot-electron-converted Ag antennas to react overnight, thus creating the amide (–NH–C=O) bond. Several washing steps with HEPES buffer and water were performed before 2 nm of Pt were sputtered for SEM imaging.
Figure 2
Figure 2. Plasmonic response of Ag BTs and Ag BD antennas.
(a,b) FDTD simulations of the near-field distribution for a Ag BT antenna at 633 nm in water for parallel (a) and perpendicular (b) polarized illumination. Colour scale bars represent the field enhancement (|E|/|E0|)2 values obtained in each case. Simulated scattering (blue), absorption (green) and extinction (yellow) spectra for these polarizations are shown to the right. Red arrow highlights the laser wavelength used in the conversion experiments (633 nm). (c) SEM image of a Ag BT antenna (gap 20 nm), and simulated (full line) and measured (dotted line) single-antenna scattering spectra in air. Scale bar, 80 nm. (d,e) FDTD simulations of the near-field distribution for a Ag BD antenna at 633 nm in water for parallel (d) and perpendicular (e) polarized illumination. Colour scale bars represent the field enhancement (|E|/|E0|)2 values obtained in each case. Simulated scattering (blue), absorption (green) and extinction (yellow) spectra. Red arrow highlights the laser wavelength used in the conversion experiments (633 nm). (f) SEM image of a Ag BD antenna (gap 30 nm), and simulated (full line) and measured (dotted line) single-antenna scattering spectra in air. Scale bar, 100 nm.
Figure 3
Figure 3. In situ label-free SERS monitoring of hot-electron-mediated reduction and control experiments.
(a) Single-antenna SERS detection of hot-electron reduction from 4-NTP to 4-ATP in the presence of 0.1 M HCl, λ=633 nm, power 1 mW, integration time 5 s. Time-dependent spectra highlighting the conversion from 4-NTP (top spectrum) to 4-ATP (bottom spectra). (b) SEM images of the negative control experiment: sample was coated with 4-NTP and left to react with the activated 15 nm AuNPs. No particles were detected on either the Ag film or on the Ag antennas (inset). (c) SEM images of the positive control experiment: sample was coated with 4-ATP and left to react with the activated 15 nm AuNPs. After several washes of the sample with HEPES buffer and water, the amide reaction was detected both on the Ag film and the Ag antennas (inset). (d) SEM images of the partial-conversion experiment: Ag antennas were coated with 4-NTP and illuminated at 633 nm for 2 min in 0.1 M HCl at a power density of 1 mW cm−2. AuNPs were found attached only to the Ag antennas, whereas no particles were found on the substrate or in the Ag film. All the samples were treated under exactly the same conditions, followed by the same washing steps before 2–3 nm Pt coating for SEM imaging. Scale bars, 100 nm for all images.
Figure 4
Figure 4. Theoretical predictions for spatially resolved energy distributions of plasmonic hot carriers.
These predictions are based on ab initio calculations of hot carrier generation including phonon-assisted intraband excitations and a transport model that accounts for multiple scattering events and the energy-dependent electron mean-free path from ab initio calulations. The left panel shows the relative flux of hot electrons with energy greater than a threshold Ecut (relative to the Fermi level of silver) on the surface of a Ag BT antenna illuminated at resonance (633 nm). The right panel shows the corresponding distribution as a function of Ecut, averaged over planes of constant distance from the tip. The probability drops linearly with increasing Ecut and exponentially with distance from the tip due to the plasmon field distribution inside the metal and the transport of hot carriers from the point of generation to the surface. Higher Ecut results in lower hot carrier flux, but greater spatial resolution.
Figure 5
Figure 5. Mapping hot-electron conversion in Ag antennas for different illumination times and polarizations.
Au reporter particle binding to 4-NTP-coated Ag BTs after (a) 1 min and (b) 2 min of illumination with parallel polarization at 633 nm in 0.1 M HCl. Au reporter particle binding to 4-NTP-coated Ag BDs conversion after 1 min of (c) parallel polarized illumination and (d) perpendicular polarized illumination at 633 nm in 0.1 M HCl. (ad) Top panels show the near-field distribution calculated via FDTD simulations for each case at 633 nm. Middle panels illustrate representative SEM images of the localized 15 nm AuNPs forming an amide bond with the converted molecules on the antenna (4-ATP). Scale bars, 100 nm. Bottom panels show the histograms (collapsed localizations maps) over 100 antennas, for each experimental condition. The position of the particles and the antennas were recorded by SEM inspection. Only antennas orientated between 0° and 20° respect to the incident polarization were taken into account (see Supplementary Fig. 8). Colour bar indicates the frequency of appearance of AuNPs localized in each pixel after performing the statistical analysis (that is, summed over all the antennas under the same experimental conditions). For example, in bottom of b, 0 (white) means 0 AuNP localized in those pixels; 5 (violet) means pixels with 1 to 5 AuNPs; 10 (orange) means pixels with 6 to 10 AuNPs; 15 (red) means pixels with 11 to 15 AuNPs and +20 (black) means pixels with 16 to over 20 AuNPs. The size of the mesh (15 nm) was chosen so as to match with the size of the reporters (AuNPs).

References

    1. Giannini V., Fernández-Domínguez A. I., Heck S. C. & Maier S. A. Plasmonic nanoantennas: fundamentals and their use in controlling the radiative properties of nanoemitters. Chem. Rev. 111, 3888–3912 (2011). - PubMed
    1. Maier S. A. Plasmonics: fundamentals and Applications 1st Edn Springer US (2007).
    1. Khurgin J. B. How to deal with the loss in plasmonics and metamaterials. Nat. Nano 10, 2–6 (2015). - PubMed
    1. Shalaev V. M., Douketis C., Stuckless J. T. & Moskovits M. Light-induced kinetic effects in solids. Phys. Rev. B 53, 11388–11402 (1996). - PubMed
    1. Narang P., Sundararaman R. & Atwater H. A. Plasmonic hot carrier dynamics in solid-state and chemical systems for energy conversion. Nanophotonics 5, 96–111 (2016).

Publication types