

Specific Strains of Lactic Acid Bacteria Differentially Modulate the Profile of Adipokines In Vitro
- PMID: 28348560
- PMCID: PMC5346559
- DOI: 10.3389/fimmu.2017.00266
Specific Strains of Lactic Acid Bacteria Differentially Modulate the Profile of Adipokines In Vitro
Abstract
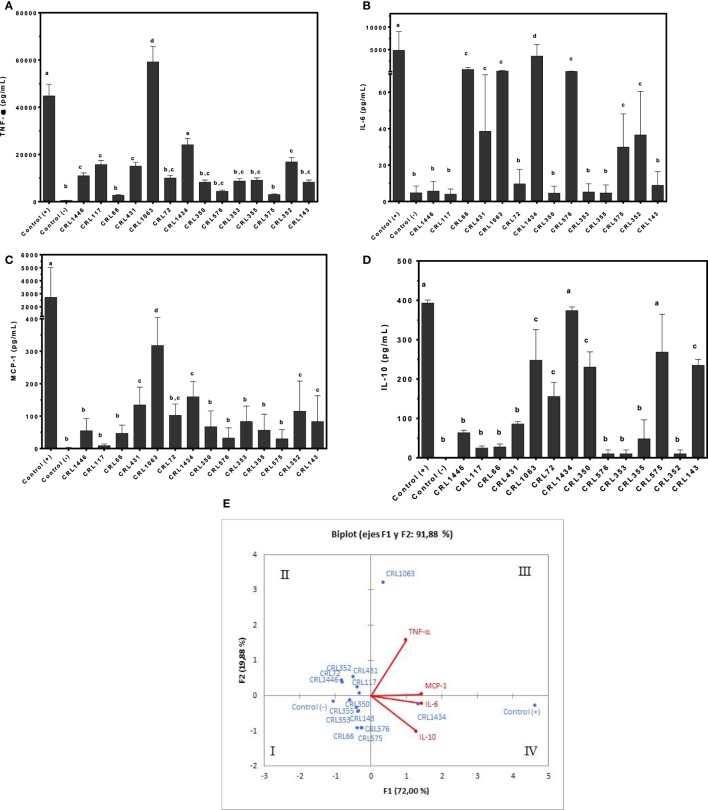
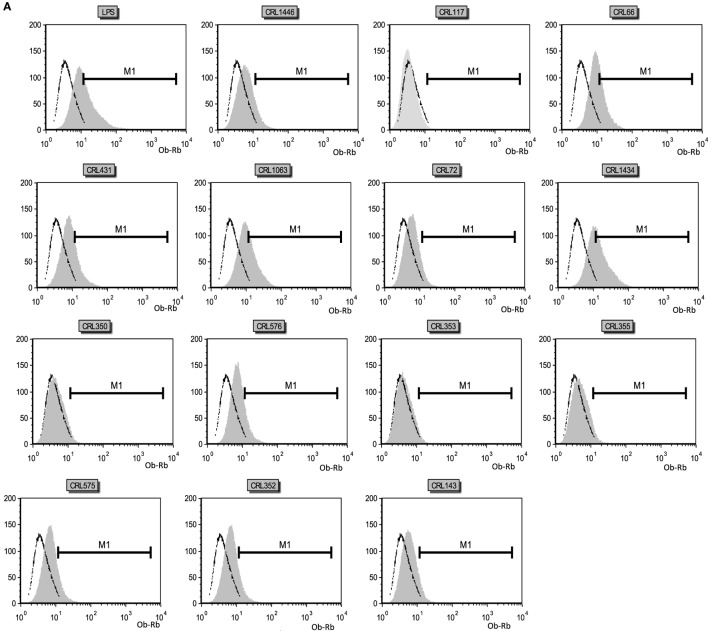
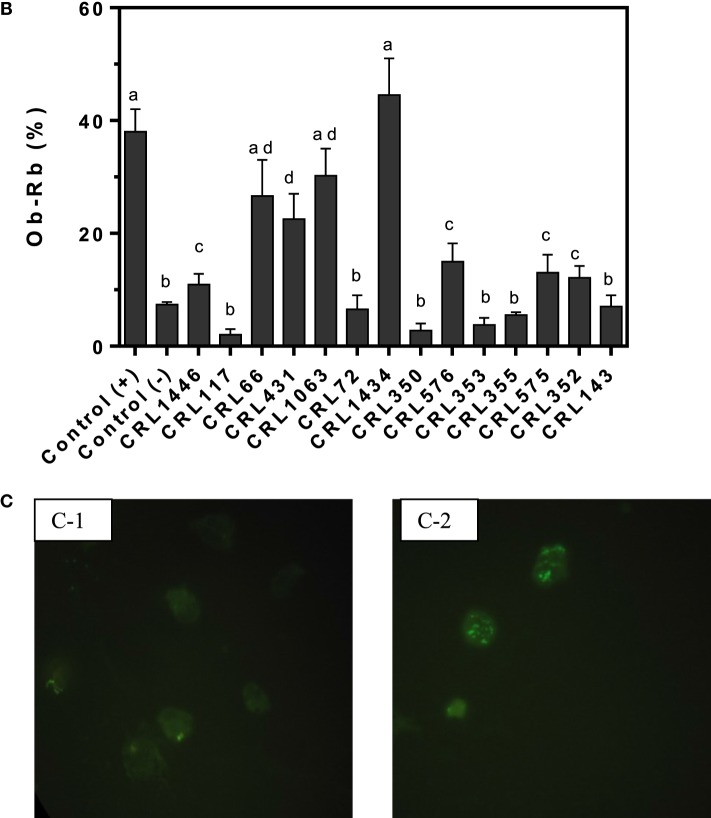
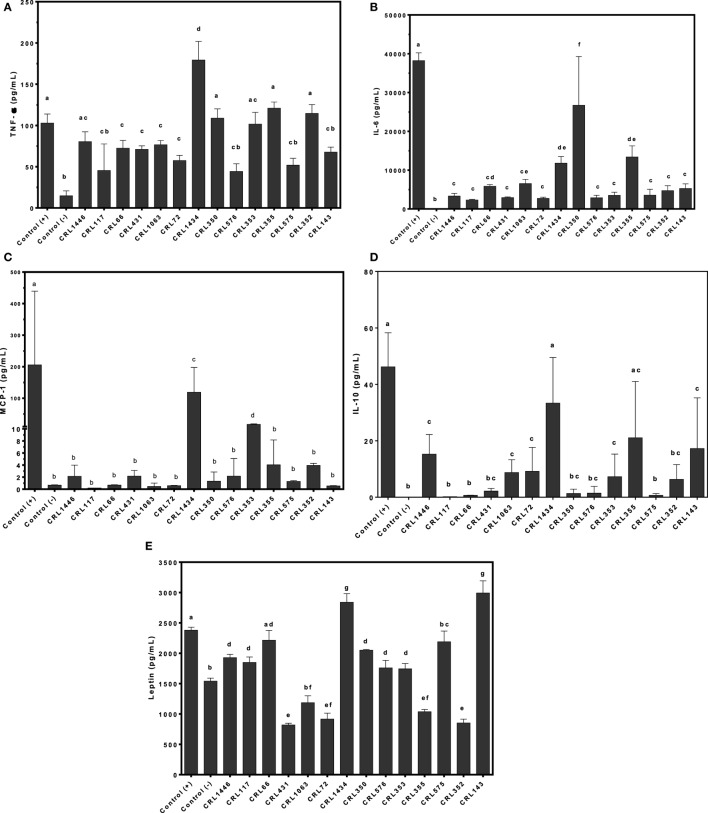
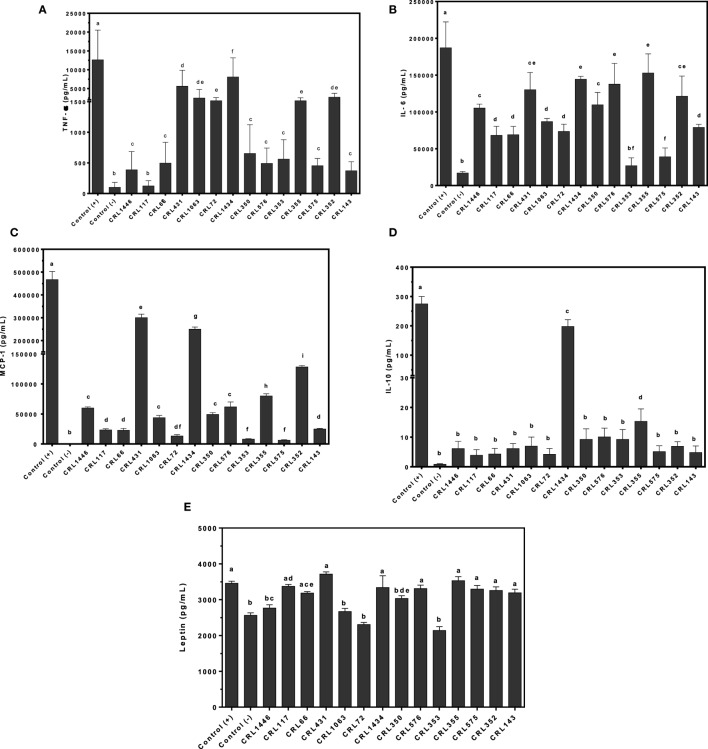
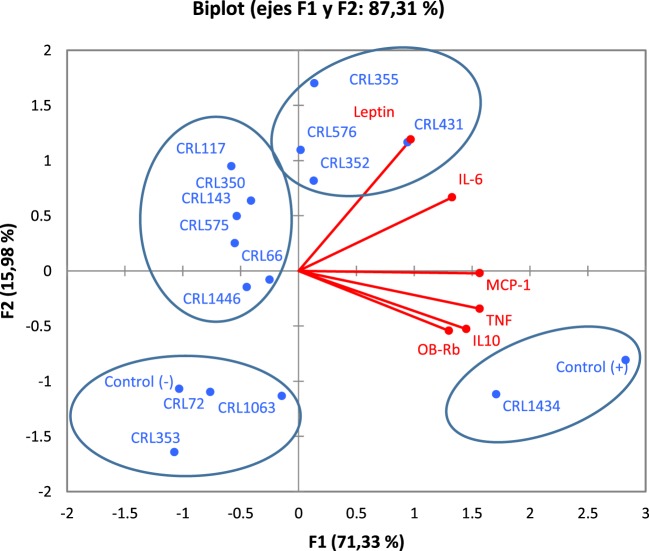
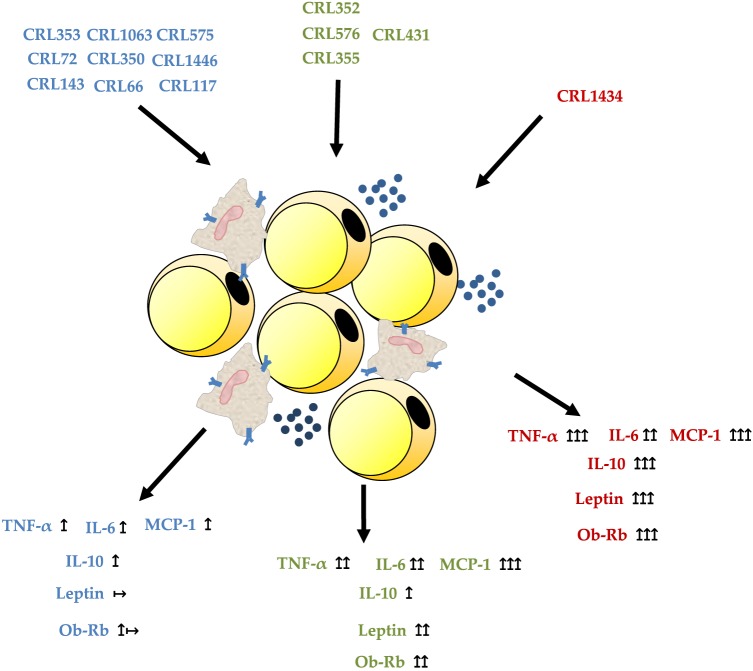
Obesity induces local/systemic inflammation accompanied by increases in macrophage infiltration into adipose tissue and production of inflammatory cytokines, chemokines, and hormones. Previous studies have shown that probiotics could improve the intestinal dysbiosis induced by metabolic diseases such as obesity, diabetes, and metabolic syndrome. Microorganisms could (directly or indirectly) affect adipokine levels due to their capacity to induce translocation of several intestinal microbial antigens into systemic circulation, which could lead to metabolic endotoxemia or produce immunomodulation in different organs. The aim of the present study was to select non-inflammatory lactic acid bacteria (LAB) strains with the capacity to modulate adipokine secretion by the adipose tissue. We wish to elucidate the role of potential probiotic strains in the regulation of the cross talking between immune cells such as macrophages and adipose cells. Mouse macrophage cell line RAW 264.7 was used for evaluating the ability of 14 LAB strains to induce cytokine production. The LAB strains were chosen based on their previously studied beneficial properties in health. Then, in murine adipocyte culture and macrophage-adipocyte coculture, we determined the ability of these strains to induce cytokines and leptin secretion. Tumor necrosis factor alpha, interleukin 6 (IL-6), IL-10, monocyte chemoattractant protein-1, and leptin levels were measured in cell supernatants. We also performed the detection and quantification of leptin receptor (Ob-Rb) expression in macrophage cell lines stimulated by these LAB strains. Differential secretion profile of cytokines in macrophage cells induced by LAB strains was observed. Also, the levels of Ob-Rb expression diverged among different LAB strains. In LAB-stimulated coculture cells (adipocytes and macrophages), we observed differential production of leptin and cytokines. Furthermore, we detected lower production levels in single culture than cocultured cells. The principal component analysis showed an association between the four clusters of strains established according to their inflammatory profiles and leptin adipocyte production and leptin receptor expression in macrophages. We conclude that coculture is the most appropriate system for selecting strains with the ability to modulate adipokine secretion. The use of microorganisms with low and medium inflammatory properties and ability to modulate leptin levels could be a strategy for the treatment of some metabolic diseases associated with dysregulation of immune response.
Keywords: adipocyte; adipokine; lactic acid bacteria; leptin; macrophage; probiotics.
Figures
Similar articles
-
Dietary flaxseed oil reduces adipocyte size, adipose monocyte chemoattractant protein-1 levels and T-cell infiltration in obese, insulin-resistant rats.Cytokine. 2012 Aug;59(2):382-91. doi: 10.1016/j.cyto.2012.04.004. Epub 2012 May 14. Cytokine. 2012. PMID: 22592037
-
Inflammatory markers and adipokines alter adipocyte-derived ASP production through direct and indirect immune interaction.Exp Clin Endocrinol Diabetes. 2013 Apr;121(4):194-200. doi: 10.1055/s-0032-1333231. Epub 2013 Feb 21. Exp Clin Endocrinol Diabetes. 2013. PMID: 23430572
-
Identification of strong interleukin-10 inducing lactic acid bacteria which down-regulate T helper type 2 cytokines.Clin Exp Allergy. 2005 Nov;35(11):1481-9. doi: 10.1111/j.1365-2222.2005.02375.x. Clin Exp Allergy. 2005. PMID: 16297146
-
Recent advances in the relationship between obesity, inflammation, and insulin resistance.Eur Cytokine Netw. 2006 Mar;17(1):4-12. Eur Cytokine Netw. 2006. PMID: 16613757 Review.
-
Hypoxia in adipose tissue: a basis for the dysregulation of tissue function in obesity?Br J Nutr. 2008 Aug;100(2):227-35. doi: 10.1017/S0007114508971282. Epub 2008 Apr 9. Br J Nutr. 2008. PMID: 18397542 Review.
Cited by
-
Characterization of autochthonous lactobacilli from goat dairy products with probiotic potential for metabolic diseases.Heliyon. 2022 Aug 28;8(9):e10462. doi: 10.1016/j.heliyon.2022.e10462. eCollection 2022 Sep. Heliyon. 2022. PMID: 36091951 Free PMC article.
-
Norepinephrine and Serotonin Can Modulate the Behavior of the Probiotic Enterococcus faecium NCIMB10415 towards the Host: Is a Putative Surface Sensor Involved?Microorganisms. 2022 Feb 22;10(3):487. doi: 10.3390/microorganisms10030487. Microorganisms. 2022. PMID: 35336063 Free PMC article.
-
Lactic Acid Bacteria Strains Differently Modulate Gut Microbiota and Metabolic and Immunological Parameters in High-Fat Diet-Fed Mice.Front Nutr. 2021 Sep 9;8:718564. doi: 10.3389/fnut.2021.718564. eCollection 2021. Front Nutr. 2021. PMID: 34568404 Free PMC article.
-
Exercise and nutrition benefit skeletal muscle: From influence factor and intervention strategy to molecular mechanism.Sports Med Health Sci. 2024 Feb 27;6(4):302-314. doi: 10.1016/j.smhs.2024.02.004. eCollection 2024 Dec. Sports Med Health Sci. 2024. PMID: 39309454 Free PMC article. Review.
-
Intestinal Immunomodulation and Shifts on the Gut Microbiota of BALB/c Mice Promoted by Two Bifidobacterium and Lactobacillus Strains Isolated from Human Samples.Biomed Res Int. 2019 Apr 18;2019:2323540. doi: 10.1155/2019/2323540. eCollection 2019. Biomed Res Int. 2019. PMID: 31119156 Free PMC article.
References
-
- Rezaee F, Dashty M. Role of adipose tissue in metabolic system disorders. J Diabetes Metab (2013) S13:2–8.10.4172/2155-6156.S13-008 - DOI
LinkOut - more resources
Full Text Sources
Other Literature Sources
Research Materials
Miscellaneous