. 2017 Mar 13:8:26.
doi: 10.3389/fgene.2017.00026. eCollection 2017.

Temporal Genetic Dynamics of an Experimental, Biparental Field Population of Phytophthora capsici

Affiliations

Temporal Genetic Dynamics of an Experimental, Biparental Field Population of Phytophthora capsici

Maryn O Carlson et al. Front Genet. .

Abstract

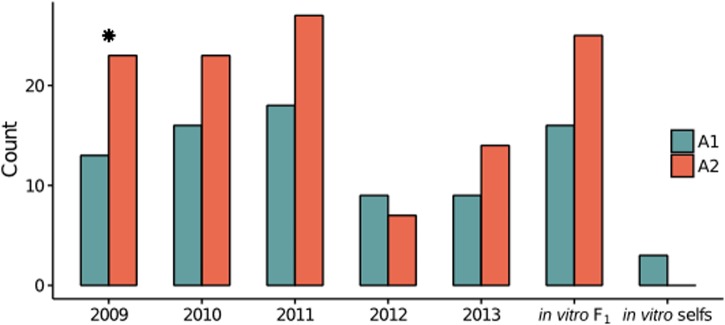
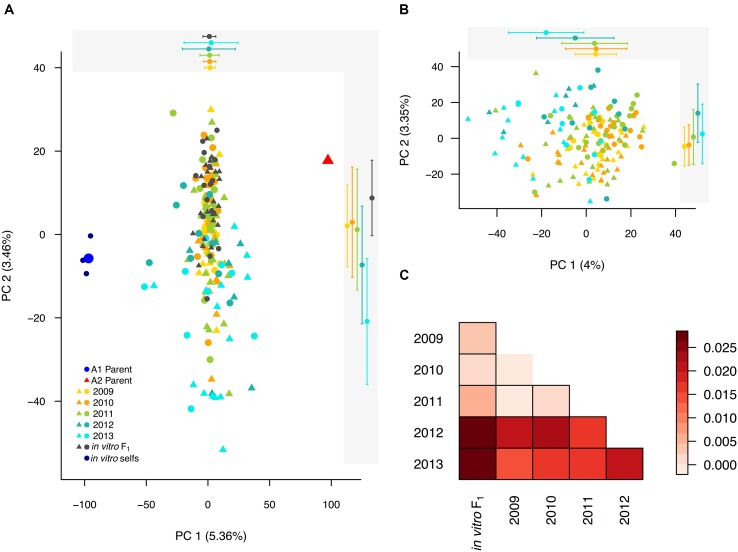
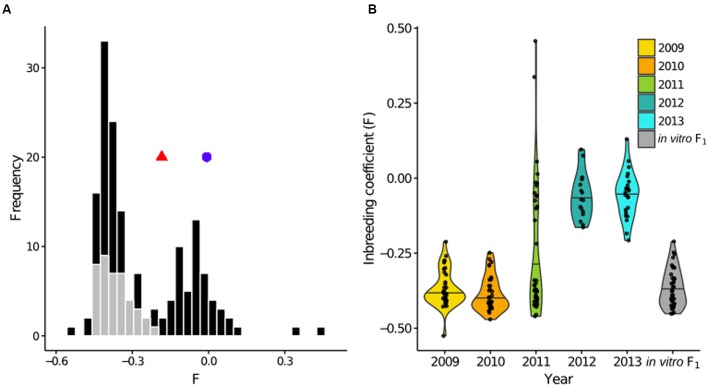
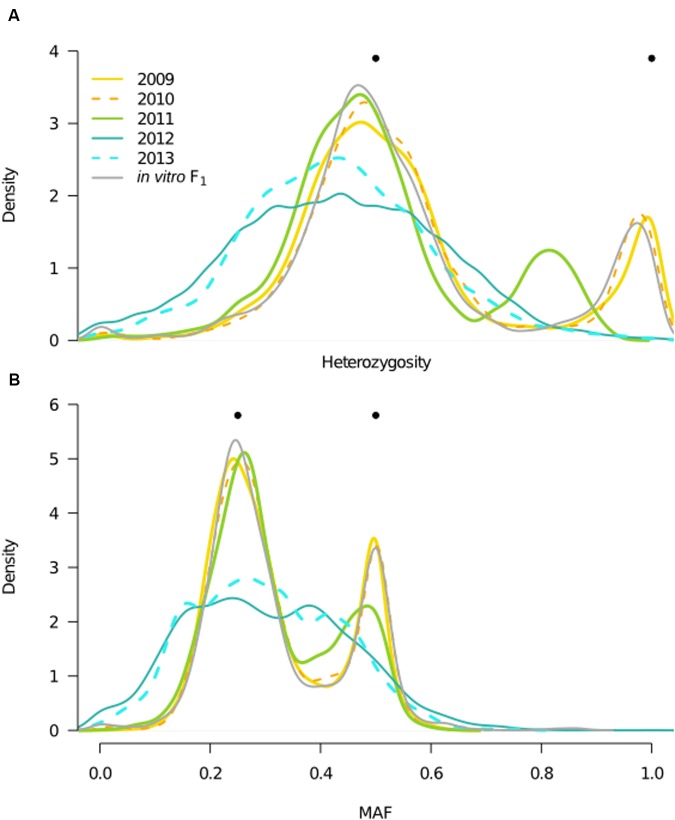
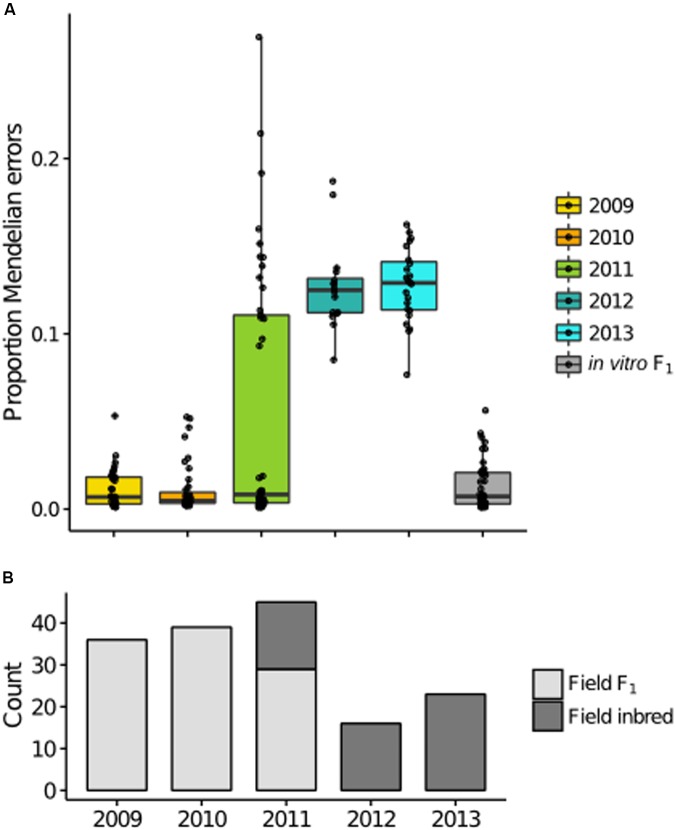
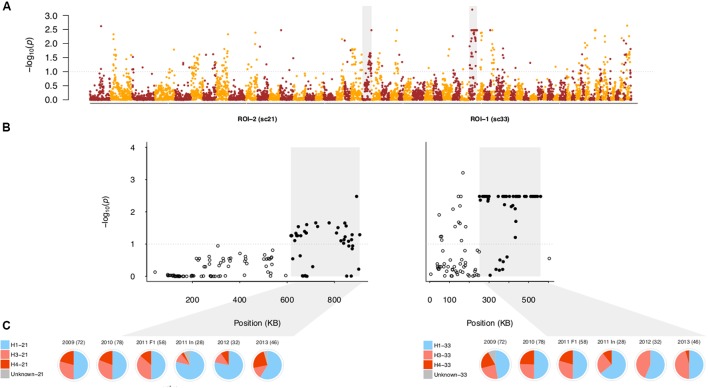
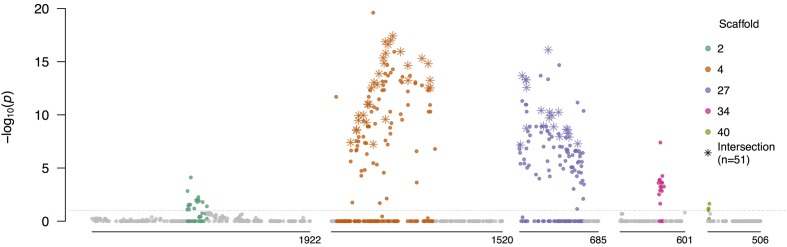
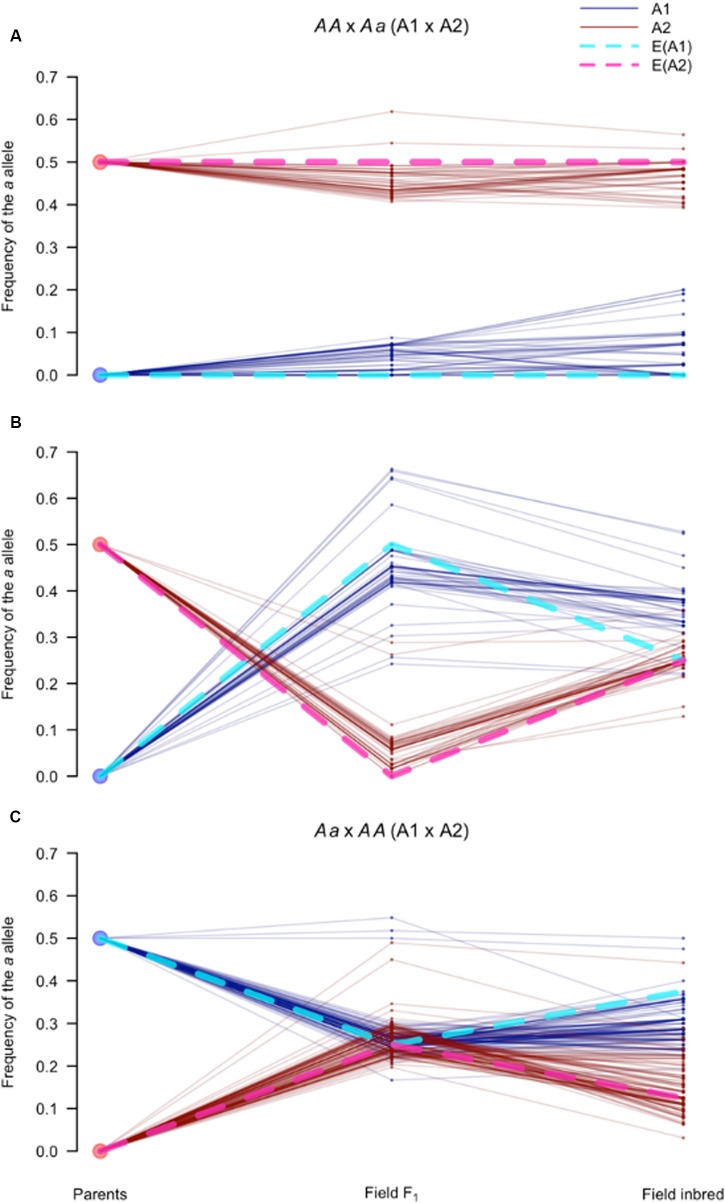
Defining the contributions of dispersal, reproductive mode, and mating system to the population structure of a pathogenic organism is essential to estimating its evolutionary potential. After introduction of the devastating plant pathogen, Phytophthora capsici, into a grower's field, a lack of aerial spore dispersal restricts migration. Once established, coexistence of both mating types results in formation of overwintering recombinant oospores, engendering persistent pathogen populations. To mimic these conditions, in 2008, we inoculated a field with two P. capsici isolates of opposite mating type. We analyzed pathogenic isolates collected in 2009-2013 from this experimental population, using genome-wide single-nucleotide polymorphism markers. By tracking heterozygosity across years, we show that the population underwent a generational shift; transitioning from exclusively F1 in 2009-2010, to multi-generational in 2011, and ultimately all inbred in 2012-2013. Survival of F1 oospores, characterized by heterozygosity excess, coupled with a low rate of selfing, delayed declines in heterozygosity due to inbreeding and attainment of equilibrium genotypic frequencies. Large allele and haplotype frequency changes in specific genomic regions accompanied the generational shift, representing putative signatures of selection. Finally, we identified an approximately 1.6 Mb region associated with mating type determination, constituting the first detailed genomic analysis of a mating type region (MTR) in Phytophthora. Segregation patterns in the MTR exhibited tropes of sex-linkage, where maintenance of allele frequency differences between isolates of opposite mating type was associated with elevated heterozygosity despite inbreeding. Characterizing the trajectory of this experimental system provides key insights into the processes driving persistent, sexual pathogen populations.

Keywords: Phytophthora; bottleneck; inbreeding; mating system; mating type; plant pathogen; population genetics; self-fertilization.


Figures

FIGURE 1
FIGURE 1
Distribution of the mating type of each isolate by year in the final, clone-corrected data set. Counts of the mating type of each isolate, A1 (teal) and A2 (reddish brown), in the in vitro F1, in vitro selfs, and clone-corrected field isolates, separated by year. The star indicates a significant difference (χ2 test; P-value < 0.1) between A1 and A2 counts.
FIGURE 2
FIGURE 2
Population structure in the biparental field population relative to the in vitro F1 and founding parents. (A) Field isolates, in vitro F1, in vitro selfs, and consensus parental genotypes plotted along the first two principal components (PCs). Each year is represented by a different color, with the A1 and A2 parental isolates indicated by blue and red, respectively. Shapes indicate the mating type of each isolate, with circles (A1) and triangles (A2). For each year (2009–2013) and the in vitro F1 the means (± one standard deviation) for the first (top) and second (right) PCs are plotted in the shaded gray boxes. (B) A PCA of only the field isolates, with color and symbol scheme consistent with (A). As in (A), the means (± one standard deviation) for the first two PCs are plotted for each year. (C) Pairwise FST for comparisons between sample years and the in vitro F1 represented by a heat map, with more positive FST values increasingly red. A border indicates that the pairwise FST value was significantly different from 0, as tested by 1000 random SNP permutations.
FIGURE 3
FIGURE 3
Generational shift in the field population. (A) Superimposed histograms of the individual inbreeding coefficient (F), estimated from 6,916 SNPs, in the in vitro F1 (gray) and field population (black). The in vitro F1 were more heterozygous than the founding parental isolates, corresponding to more negative F-values, indicated by a blue circle (A1 parent) and red triangle (A2 parent). In contrast, the field population exhibited a bimodal F distribution. (B) Distributions of F by year represented by violin plots, with each year shown in a distinct color and individual data points overlaid. The long upper tail of the 2011 distribution is driven by two field selfs.
FIGURE 4
FIGURE 4
Year heterozygosity and allele frequency (MAF) distributions. Filled, black circles indicate expectations for population heterozygosity and MAF in a theoretical F1 population. (A) Distributions of the proportion of heterozygous individuals per SNP (n = 6,916) for each year and the in vitro F1, represented by kernel density estimates, with color corresponding to year, and x-axis consistent with (B). Bimodal distributions in the in vitro F1 and years 2009–2010 are consistent with expectations for the F1 generation, whereas unimodal distributions in 2012–2013 indicate presence of inbreeding. A shift in the bimodal distribution of 2011, indicates the mixed outbred and inbred composition of this year. (B) MAF distributions, where the minor allele is defined based on the frequency in the total field population, for each year and the in vitro F1, with color designations the same as in (A).
FIGURE 5
FIGURE 5
Mendelian errors (MEs) distinguish F1 and inbred isolates in the field. (A) Boxplots of the proportion of MEs per individual for each year are consistent with the inbreeding coefficient trend, with a bimodal distribution in 2011, and increased MEs in later years. (B) Classification of each isolate based on the proportion of MEs, with counts of field F1 (light gray) and field inbred (dark gray) for each sample year.
FIGURE 6
FIGURE 6
Regions of differentiation between the field F1 and inbred subpopulations. (A) Negative log10-transformed, false-discovery rate (FDR) adjusted P-values from the genome-wide test of allele frequency differences between the field F1 and inbred subpopulations, ordered by physical position. The gray dotted lines in (A,B) indicate the significance threshold (α = 0.10). Color alternates by scaffold. The shaded gray boxes indicate the SNPs in scaffolds 21 and 33 corresponding to regions of interest (ROIs) 2 and 1, respectively. (B) Same as (A) except that P-values are shown only for scaffolds 21 and 33. Here, gray boxes denote the sub-region within each scaffold defined as a ROI. Filled, black circles indicate SNPs within each ROI, whereas open, black circles indicate SNPs outside of the ROI. (C) Pie charts represent the haplotype frequencies found in each year [with 2011 separated into F1 and inbred (In) isolates], with the number of sampled chromosomes noted for each year. Blue corresponds to the single A1 founding parental haplotype, shades of red to the two A2 founding haplotypes, and gray to undesignated haplotypes in each ROI (see Materials and Methods).
FIGURE 7
FIGURE 7
Allele frequency differences between isolates of opposite mating types. Negative log10-transformed P-values, adjusted for multiple testing, from the Fisher’s exact test of allele frequency differences between A1 and A2 isolates in the field F1, plotted against physical position, for scaffolds with significantly differentiated regions (see Supplementary Table S8 for coordinates). Colored SNPs were within the bounds of the minimum and maximum significant SNPs in each scaffold containing at least two significantly associated SNPs within 200 kb. Stars indicate the SNPs which were significant in tests of allele frequency differences between mating types in both the field F1 and inbred subpopulations (Supplementary Text). All SNPs above the gray horizontal line were significant after the FDR correction (α = 0.1).
FIGURE 8
FIGURE 8
Segregation of SNPs in the mating type region follow expectations for sex-linked loci. Frequency of the a allele (pa), for AA × Aa and Aa × AA (A1 × A2) markers in the mating type associated sub-regions of scaffolds 4 and 27, defined as the mating type region (MTR). Each parallel coordinate plot (A–C) tracks pa at three time points (parents, field F1, and field inbred) in the A1 (blue solid lines) and A2 (red solid lines) isolates for: (A) AA × Aa markers (n = 49) with pa> 0.3 in the A2 and pa < 0.3 in the A1 field F1 isolates; (B) Remaining AA × Aa markers (n = 49); and (C) All Aa × AA markers. Expectations for sex-linked loci, indicated by dotted lines, assuming the A1 and A2 mating types behave like the homogametic (light blue) and heterogametic (pink) sexes, respectively, when: (A) the a allele is in the A2 determining haplotype (i.e., Y analog); (B) the a allele is in the non-A2 determining haplotype (i.e., X analog); and (C) the a allele is in either of the non-A2 determining haplotypes (i.e., X analogs).

References

    1. Abdellaoui A., Hottenga J. J., de Knijff P., Nivard M. G., Xiao X., Scheet P., et al. (2013). Population structure, migration, and diversifying selection in the Netherlands. Eur. J. Hum. Genet. 21 1277–1285. 10.1038/ejhg.2013.48 - DOI - PMC - PubMed
    1. Allendorf F. W., Gellman W. A., Thorgaard G. H. (1994). Sex-linkage of two enzyme loci in Oncorhynchus mykiss (rainbow trout). Heredity 72 498–507. 10.1038/hdy.1994.67 - DOI - PubMed
    1. Babadoost M., Pavon C. (2013). Survival of Oospores of Phytophthora capsici in Soil. Plant Dis. 97 1478–1483. 10.1016/j.riam.2011.01.004 - DOI - PubMed
    1. Bachtrog D. (2013). Y-chromosome evolution: emerging insights into processes of Y-chromosome degeneration. Nat. Rev. Genet. 14 113–124. 10.1038/nrg3366 - DOI - PMC - PubMed
    1. Balloux F. (2004). Heterozygote excess in small populations and the heterozygote-excess effective population size. Evolution 58 1891–1900. 10.1111/j.0014-3820.2004.tb00477.x - DOI - PubMed

LinkOut - more resources