. 2015 Nov 5;1(5):e000038.
doi: 10.1099/mgen.0.000038. eCollection 2015 Nov.

Recombination produces coherent bacterial species clusters in both core and accessory genomes

Affiliations

Recombination produces coherent bacterial species clusters in both core and accessory genomes

Pekka Marttinen et al. Microb Genom. .

Abstract

Background: Population samples show bacterial genomes can be divided into a core of ubiquitous genes and accessory genes that are present in a fraction of isolates. The ecological significance of this variation in gene content remains unclear. However, microbiologists agree that a bacterial species should be 'genomically coherent', even though there is no consensus on how this should be determined.

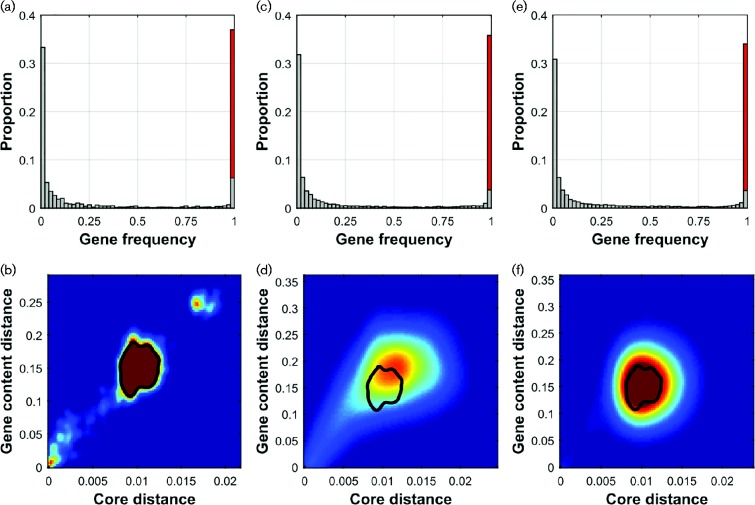
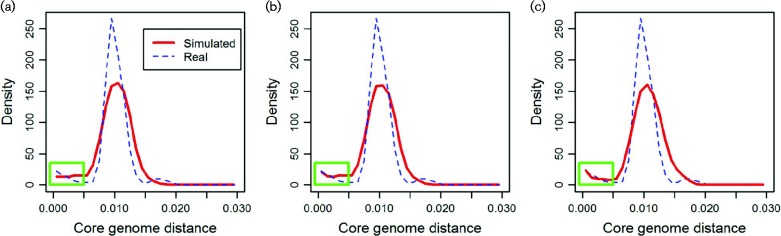
Results: We use a parsimonious model combining diversification in both the core and accessory genome, including mutation, homologous recombination (HR) and horizontal gene transfer (HGT) introducing new loci, to produce a population of interacting clusters of strains with varying genome content. New loci introduced by HGT may then be transferred on by HR. The model fits well to a systematic population sample of 616 pneumococcal genomes, capturing the major features of the population structure with parameter values that agree well with empirical estimates.

Conclusions: The model does not include explicit selection on individual genes, suggesting that crude comparisons of gene content may be a poor predictor of ecological function. We identify a clearly divergent subpopulation of pneumococci that are inconsistent with the model and may be considered genomically incoherent with the rest of the population. These strains have a distinct disease tropism and may be rationally defined as a separate species. We also find deviations from the model that may be explained by recent population bottlenecks or spatial structure.

Keywords: computational modeling; core/accessory genome; evolution; recombination; speciation.


Figures

Fig. 1
Fig. 1
Gene frequency histograms (a, c, e) and strain distance distributions (b, d, f). The frequency histograms (a, c, e) show the number of very rare or common genes is much larger than the number of genes at intermediate frequencies; the red column represents the core genome (the overlapping grey bar represents frequencies f with 0.98 < f < 1). The distance distributions (b, d, f), obtained by averaging over the whole simulation after discarding initial samples, are based on pairwise comparisons of strains, showing the core genome (Hamming) distance on the x-axis and the gene content (Jaccard) distance on the y-axis (see Methods). A contour line encompassing the mode in the real data is shown in the simulated distributions for easier comparison. The columns show results in the real data (a, b), in the model with learned parameter values (c, d) and in the model with between-strain recombination increased by a factor of 10 (e, f).
Fig. 2
Fig. 2
Effects of geographical sampling bias and a recent bottleneck on the core genome Hamming distance distribution. Strains from a simulated generation, representative of the average shape, were selected as the initial population (a). The green rectangle highlights the region of interest, showing the increase in the number of closely related strain pairs in the real data. (b) The distance distribution after taking a geographically structured sample, averaged over 20 independent replicates (red curve). (c) The effect of a population bottleneck, obtained by selecting a specified number of strains (here 100 out of 2000 strains in total) as possible ancestors from which the next generation was sampled with replacement. Bottlenecks of other sizes are shown in Fig. S10. The distribution for the real data is shown in each panel for comparison.

References

    1. Baltrus D. A. (2013). Exploring the costs of horizontal gene transfer Trends Ecol Evol 28489–49510.1016/j.tree.2013.04.002 . - DOI - PubMed
    1. Baumdicker F., Hess W. R., Pfaffelhuber P. (2012). The infinitely many genes model for the distributed genome of bacteria Genome Biol Evol 4443–45610.1093/gbe/evs016 . - DOI - PMC - PubMed
    1. Chewapreecha C., Harris S. R., Croucher N. J., Turner C., Marttinen P., Cheng L., Pessia A., Aanensen D. M., Mather A. E., other authors (2014). Dense genomic sampling identifies highways of pneumococcal recombination Nat Genet 46305–30910.1038/ng.2895 . - DOI - PMC - PubMed
    1. Collins R. E., Higgs P. G. (2012). Testing the infinitely many genes model for the evolution of the bacterial core genome and pangenome Mol Biol Evol 293413–342510.1093/molbev/mss163 . - DOI - PubMed
    1. Croucher N. J., Finkelstein J. A., Pelton S. I., Mitchell P. K., Lee G. M., Parkhill J., Bentley S. D., Hanage W. P., Lipsitch M. (2013). Population genomics of post-vaccine changes in pneumococcal epidemiology Nat Genet 45656–66310.1038/ng.2625 . - DOI - PMC - PubMed

Data Bibliography

    1. Marttinen, P., Croucher, N. J., Gutmann, M. U., Corander, J. & Hanage, W. P. (2015). Figshare. http://figshare.com/s/6471c982669011e58c4806ec4b8d1f61. - PMC - PubMed
    1. Marttinen, P., Croucher, N. J., Gutmann, M. U., Corander, J. & Hanage, W. P. (2015). Figshare. http://figshare.com/s/c70dd5e0669011e59ff906ec4bbcf141. - PMC - PubMed