Microreact: visualizing and sharing data for genomic epidemiology and phylogeography
- PMID: 28348833
- PMCID: PMC5320705
- DOI: 10.1099/mgen.0.000093
Microreact: visualizing and sharing data for genomic epidemiology and phylogeography
Abstract
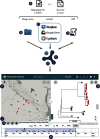
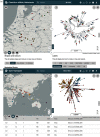
Visualization is frequently used to aid our interpretation of complex datasets. Within microbial genomics, visualizing the relationships between multiple genomes as a tree provides a framework onto which associated data (geographical, temporal, phenotypic and epidemiological) are added to generate hypotheses and to explore the dynamics of the system under investigation. Selected static images are then used within publications to highlight the key findings to a wider audience. However, these images are a very inadequate way of exploring and interpreting the richness of the data. There is, therefore, a need for flexible, interactive software that presents the population genomic outputs and associated data in a user-friendly manner for a wide range of end users, from trained bioinformaticians to front-line epidemiologists and health workers. Here, we present Microreact, a web application for the easy visualization of datasets consisting of any combination of trees, geographical, temporal and associated metadata. Data files can be uploaded to Microreact directly via the web browser or by linking to their location (e.g. from Google Drive/Dropbox or via API), and an integrated visualization via trees, maps, timelines and tables provides interactive querying of the data. The visualization can be shared as a permanent web link among collaborators, or embedded within publications to enable readers to explore and download the data. Microreact can act as an end point for any tool or bioinformatic pipeline that ultimately generates a tree, and provides a simple, yet powerful, visualization method that will aid research and discovery and the open sharing of datasets.
Keywords: Open data; phylogenomics; phylogeography; population genomics; trees.
Figures


References
-
- Aanensen D. M., Feil E. J., Holden M. T., Dordel J., Yeats C. A., Fedosejev A., Goater R., Castillo-Ramírez S., Corander J., et al. (2016). Whole-genome sequencing for routine pathogen surveillance in public health: a population snapshot of invasive Staphylococcus aureus in Europe. MBio 7e00444-16.10.1128/mBio.00444-16 - DOI - PMC - PubMed
-
- Crellen T., Allan F., David S., Durrant C., Huckvale T., Holroyd N., Emery A. M., Rollinson D., Aanensen D. M., et al. (2016). Whole genome resequencing of the human parasite Schistosoma mansoni reveals population history and effects of selection. Sci Rep 620954.10.1038/srep20954 - DOI - PMC - PubMed
MeSH terms
Grants and funding
LinkOut - more resources
Full Text Sources
Other Literature Sources
Molecular Biology Databases

