. 2017:2017:6368780.
doi: 10.1155/2017/6368780. Epub 2017 Feb 28.

Diabetes Is Associated with Increased Autoreactivity of Mannan-Binding Lectin

Affiliations

Diabetes Is Associated with Increased Autoreactivity of Mannan-Binding Lectin

Esben Axelgaard et al. J Diabetes Res. 2017.

Abstract

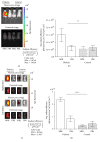
Mannan-binding lectin (MBL) has been reported to be involved in the pathophysiology of diabetic nephropathy. MBL is a pattern-recognition molecule of the innate immune system that initiates the lectin pathway of the complement system upon recognition of evolutionary conserved pathogen-associated molecular patterns or to altered self-tissue. Our group have previously shown direct effects of MBL on diabetes-induced kidney damage, and we hypothesized that MBL may cause autoactivation of the complement system via binding to neoepitopes induced by hyperglycemia. In the present study, we induced diabetes in MBL knockout mice and in wild type C57BL/6J mice by low-dose streptozotocin injection and measured blood glucose and urine albumin-to-creatinine ratio to monitor development of diabetes. After 24 weeks, fluorescently labelled recombinant MBL was injected intravenously in diabetic MBL knockout mice after which the distribution was investigated using in vivo fluorescence imaging. Mice were subjected to in vivo and ex vivo imaging 24 hours after injection. MBL was found to accumulate in the kidneys of diabetic mice as compared to healthy control mice (p < 0.0001). These findings support the hypothesis of a significant role of MBL and the complement system in the pathophysiology of diabetic nephropathy.


Conflict of interest statement

The authors declare no conflict of interests.

Figures

Figure 1
Figure 1
Overview of the lectin pathway of the complement system and study hypothesis. (a) Specific surface-sugar structures are recognized by MBL that leads to activation of the lectin pathway. The activation proceeds as an enzyme cascade with proteins acting as cofactors for each other thus generating opsonins for enhanced cellular recognition (C3b), anaphylatoxins that drive local inflammation (C3a and C5a), and terminally the membrane-attack complex (C5b-9) that mediates cell lysis. (b) Under normal glycemia MBL is unable to bind host cell-surfaces (left panel). However, during hyperglycemia the cellular surface may be altered, which mediates recognition by MBL and activation of the complement system.
Figure 2
Figure 2
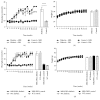
Blood glucose and weight gain of diabetic and nondiabetic control MBL/DKO and WT C57BL/6J mice. (a and b) Blood glucose and weight measurements for diabetic mice destined to be treated with rMBL AF680 (n = 6), diabetic mice destined to be treated with PBS (n = 6), control mice destined to be treated with rMBL AF680 (n = 6), and control mice destined to be treated with PBS (n = 6). (c and d). Comparison of the development of diabetes according to rising blood glucose levels and weight gain between diabetic (n = 6) and control (n = 6) C57BL/6J MBL/DKO mice and diabetic (n = 6) and control (n = 6) C57BL/6J WT mice. Statistical tests are given in the figure when significant, and comparisons are made between STZ treated and untreated groups at study end (∗∗∗∗p < 0.0001). Values are given in mean (dots) with SD (whiskers).
Figure 3
Figure 3
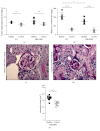
Kidney-to-body weight ratio, albumin-to-creatinine ratio, and kidney glomerulus estimation. (a) Kidney-to-body weight ratio of diabetic C57BL/6J WT mice (n = 6), nondiabetic control C57BL/6J WT mice (n = 6), diabetic C57BL/6J MBL/DKO mice (n = 6), and nondiabetic control C57BL/6J mice MBL/DKO (n = 6). (b) Albumin-to-creatinine ratio (AcR) measurements at study end for WT and MBL/DKO mice. (c and d) Light microscope representation of glomerulus from diabetic C57BL/6J MBL/DKO mice (c) and nondiabetic C57BL/6J MBL/DKO control mice (d). (e) Estimation of glomerulus volume in diabetic C57BL/6J MBL/DKO mice (n = 13) and nondiabetic control C57BL/6J MBL/DKO mice (n = 8). Statistical tests are indicated in figure when significant (p < 0.05, ∗∗p < 0.001, and ∗∗∗∗p < 0.0001). Data is presented as mean (solid line) with SDs (whiskers).
Figure 4
Figure 4
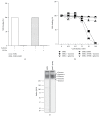
Analysis of retained functionality of AF680 labelled rMBL. (a) rMBL and rMBL labelled with AF680 were analysed for retained binding activity onto a surface of mannan in presence of calcium or EDTA. Values measured in calcium buffer were defined as 100% and subsequent samples were calculated according to these. (b) AF680 labelled rMBL and unlabelled rMBL were analysed for binding activity in the presence of mannose or galactose. Values obtained in the presence of galactose were defined as 100% and subsequent samples were calculated according to these. (c) SDS-PAGE followed by silver staining of rMBL and rMBL AF680 with arrows indicating the distribution of rMBL oligomers. Molecular marker is given in kDa. All values are given in percentage (%) of bound rMBL with values obtained in the presence of galactose defined as 100% bound and subsequent samples calculated according to these. The experiments were repeated twice with similar results.
Figure 5
Figure 5
In vivo and ex vivo detection of AF680 labelled rMBL 24 hours postinjection. (a) Fluorescent and spectral unmixing images representing one mouse in each group exhibiting distribution of labelled rMBL 24 hours postinjection (dorsal view). (b) Region of interest (ROI) quantification of detected fluorescent signal from diabetic C57BL/6J MBL/DKO mice + AF680 rMBL (n = 6), diabetic mice + PBS (n = 6), nondiabetic mice + AF680 rMBL (n = 6), and nondiabetic mice + PBS (n = 6) given in average radiant efficiency. (c) Ex vivo fluorescent and spectral unmixing images representation of the left and right kidneys from one mouse in each group. (d) ROI quantification of detected fluorescence in the right and left kidneys of mice in each group as in (b) with values given in average radiant efficiency. Scale bars are given in radiant efficiency. Statistical tests are indicated in the figure when significant (∗∗p < 0.001, ∗∗∗∗p < 0.0001). The experiment was repeated five times with comparable results.

References

    1. European Renal Association And European Dialysis and Transplant Association. ERA-EDTA Registry-Annual Report 2013.
    1. USRDS. 2014 USRDS Annual Data Report Volume 2: End-Stage Renal Disease. 2014;2
    1. Hovind P., Tarnow L., Rossing K., et al. Decreasing incidence of severe diabetic microangiopathy in type 1 diabetes. Diabetes Care. 2003;26(4):1258–1264. doi: 10.2337/diacare.26.4.1258. - DOI - PubMed
    1. Yokoyama H., Okudaira M., Otani T., et al. Higher incidence of diabetic nephropathy in type 2 than in type 1 diabetes in early-onset diabetes in Japan. Kidney International. 2000;58(1):302–311. doi: 10.1046/j.1523-1755.2000.00166.x. - DOI - PubMed
    1. Hansen T. K., Thiel S., Knudsen S. T., et al. Elevated levels of mannan-binding lectin in patients with type 1 diabetes. Journal of Clinical Endocrinology and Metabolism. 2003;88(10):4857–4861. doi: 10.1210/jc.2003-030742. - DOI - PubMed

MeSH terms

LinkOut - more resources