Review
. 2016 Apr 29;3(3):371-383.
doi: 10.1080/23328940.2016.1177159. eCollection 2016.

Timing of activities of daily life is jaggy: How episodic ultradian changes in body and brain temperature are integrated into this process

Affiliations
Review

Timing of activities of daily life is jaggy: How episodic ultradian changes in body and brain temperature are integrated into this process

William Blessing et al. Temperature (Austin). .

Abstract

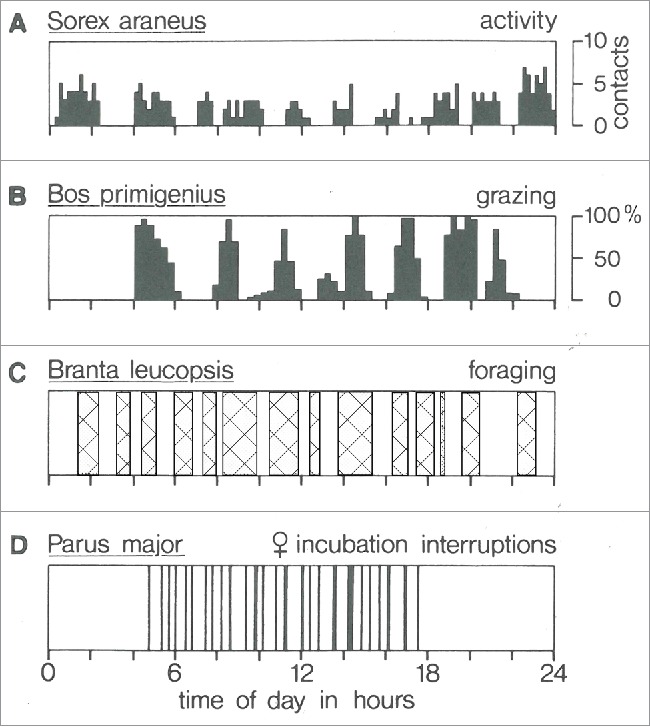
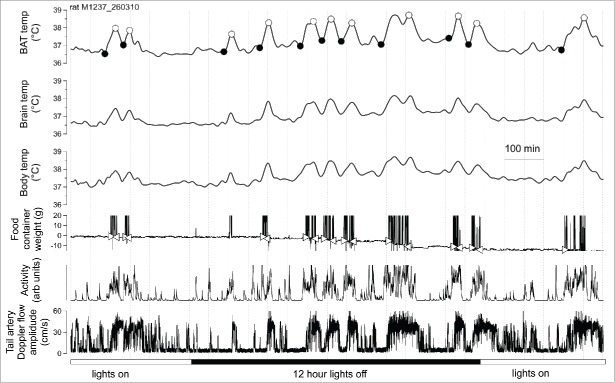
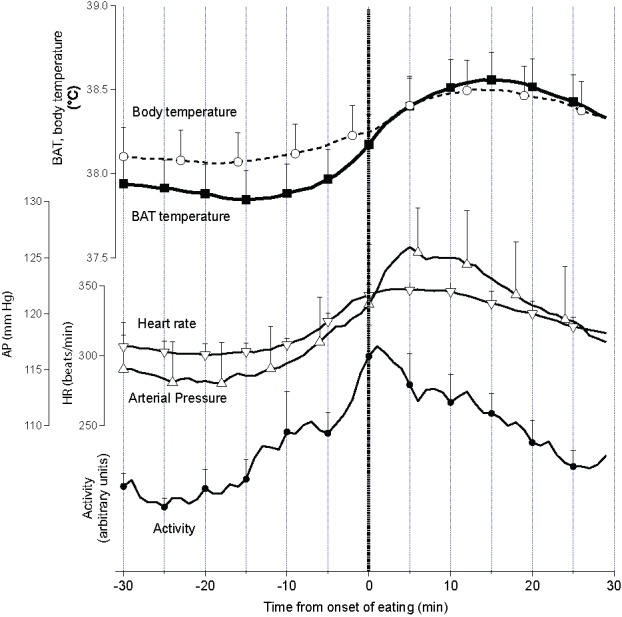
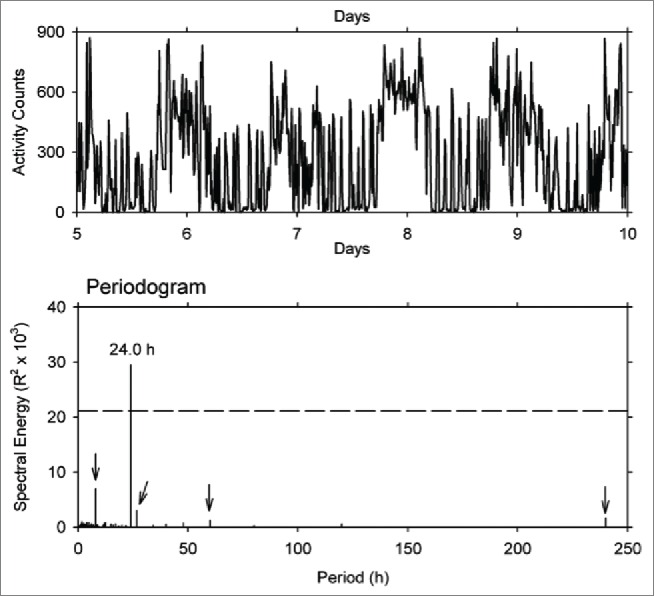
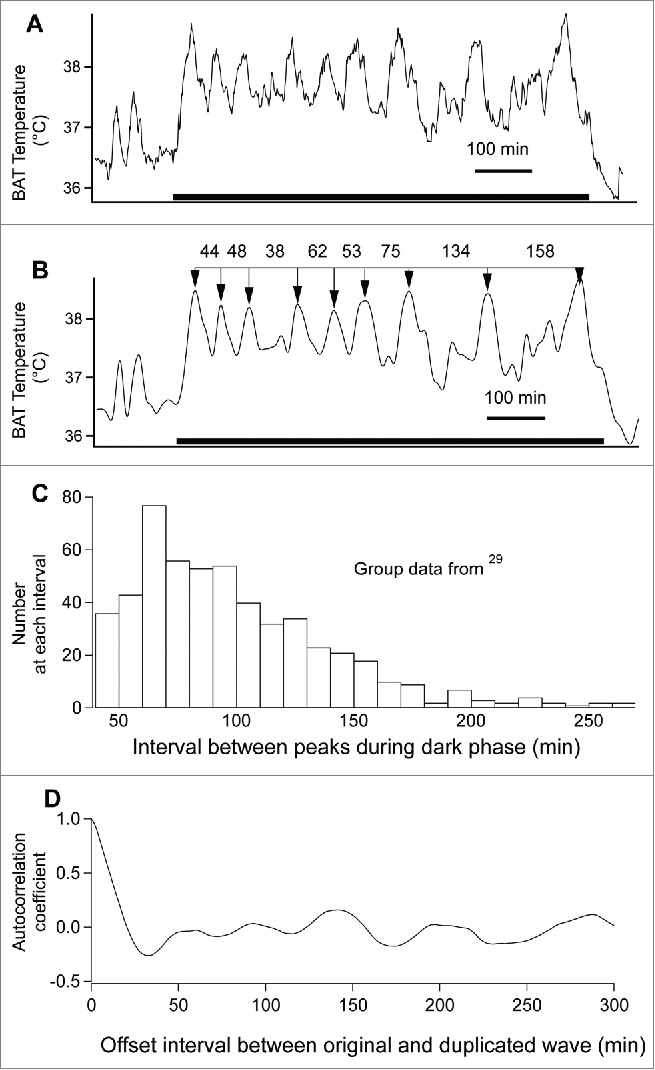
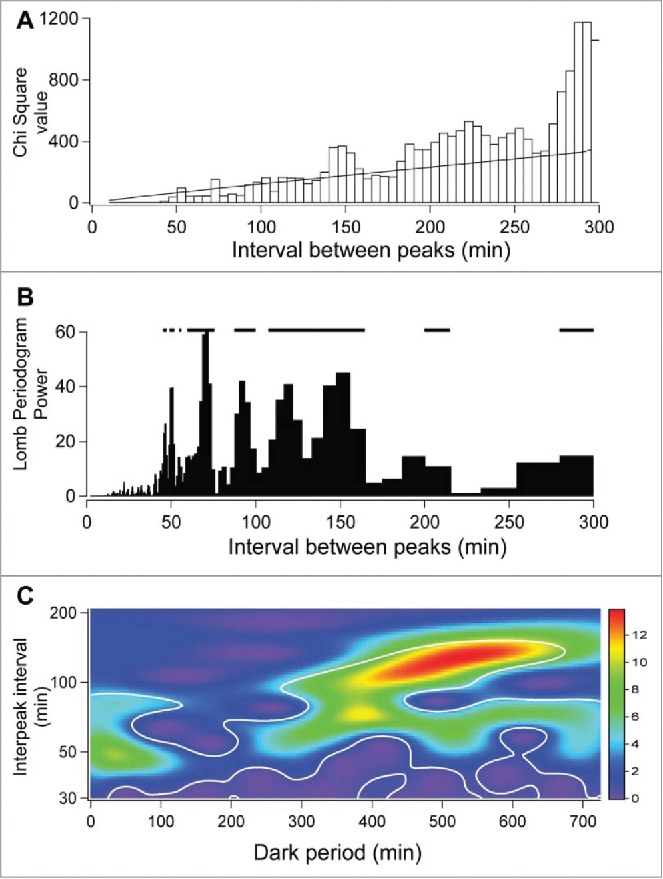
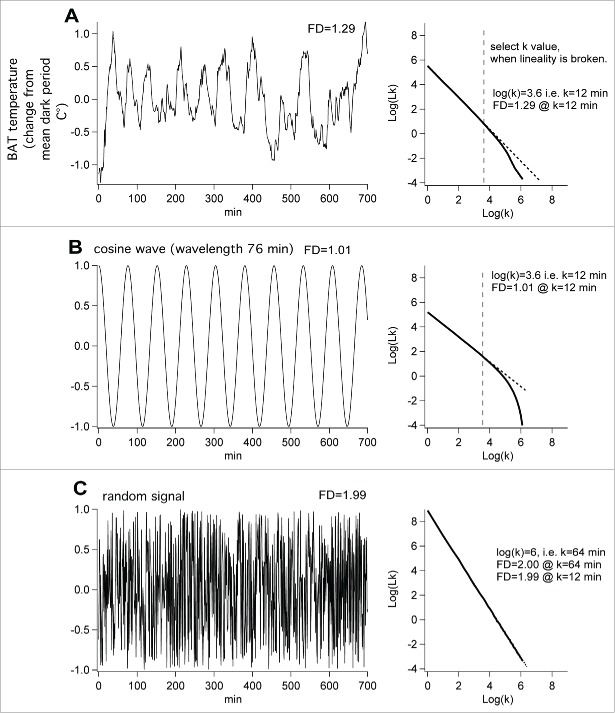
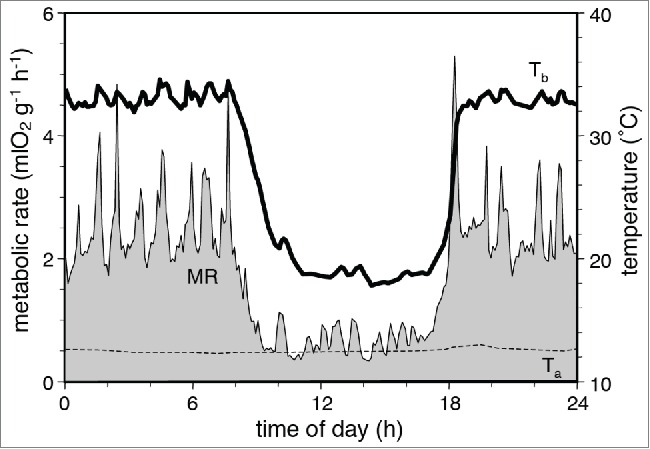
Charles Darwin noted that natural selection applies even to the hourly organization of daily life. Indeed, in many species, the day is segmented into active periods when the animal searches for food, and inactive periods when the animal digests and rests. This episodic temporal patterning is conventionally referred to as ultradian (<24 hours) rhythmicity. The average time between ultradian events is approximately 1-2 hours, but the interval is highly variable. The ultradian pattern is stochastic, jaggy rather than smooth, so that although the next event is likely to occur within 1-2 hours, it is not possible to predict the precise timing. When models of circadian timing are applied to the ultradian temporal pattern, the underlying assumption of true periodicity (stationarity) has distorted the analyses, so that the ultradian pattern is frequently averaged away and ignored. Each active ultradian episode commences with an increase in hippocampal theta rhythm, indicating the switch of attention to the external environment. During each active episode, behavioral and physiological processes, including changes in body and brain temperature, occur in an integrated temporal order, confirming organization by programs endogenous to the central nervous system. We describe methods for analyzing episodic ultradian events, including the use of wavelet mathematics to determine their timing and amplitude, and the use of fractal-based procedures to determine their complexity.

Keywords: basic rest-activity cycle; brown adipose tissue; chronobiology; circadian rhythms; eating; fractals; homeostasis; natural selection; thermogenesis; ultradian rhythms; wavelets.


Figures

Figure 1.
Figure 1.
Examples of short-term rhythms in activity. (A) Locomotor activity in a common shrew. (B) Grazing activity (percent of time) in 8 bullocks. (C) Foraging bouts in a family of barnacle geese. (D) Absence from the nest in an incubating female great tit. Modified from Figure 1 of Daan and Aschoff with permission.
Figure 2.
Figure 2.
Experimental record from an individual rat, maintained in a quiet environment at 24–26°C with ad libitum access to food and water. Disturbances of the food container are shown as sudden large variations in the weight of the container. Consumption of food is indicated by the progressive fall in the weight of the container. Filled and open circles in the top trace indicate onset and peaks of episodic ultradian increases in BAT temperature. Open triangles in the food trace indicate onset and offset of eating. From ref. with permission.
Figure 3.
Figure 3.
Group data (mean ± SEM) from dark period showing episodic increases in BAT and body temperature, arterial pressure (AP), heart rate (HR), tail artery blood flow and behavioral activity recorded from 30 min before the onset of eating (time zero) until 30 min after the onset of eating in rats maintained with ad libitum access to food. From ref. with permission.
Figure 4.
Figure 4.
Record (days 5–10) of locomotor activity of a horse monitored by an activity data logger attached to the animal's neck, recorded at 1-min intervals for 10 consecutive days (top panel), and the periodogram generated by Fourier analysis of the complete 10 day time series (bottom panel). The dashed line in the periodogram indicates 0.05 level of significance. Modified from ref. with permission.
Figure 5.
Figure 5.
(A) Record (1 min bins) of brown adipose tissue (BAT) temperature, from just before lights-off to just after lights-on. The 12 hour dark period is indicated by the filled black bar. (B) IgorPro DWT function applied to the record in (A). The numbers are time (min) between sequential dark period ultradian peaks (arrows). (C) Group data showing frequency histogram distribution of the time between ultradian peaks during the dark phase. (D) Autocorrelation of the dark phase BAT temperature record shown in (A). From ref. with permission.
Figure 6.
Figure 6.
Chi square periodogram (A) and Lomb-Scargle periodogram (B) and continuous wavelet transform (CWT) (C) of the dark phase BAT temperature record shown in Figure 5A. Significance at the 0.05 level of confidence is shown by the sloping line in A, by the interrupted horizontal line in (B) and by the white lines in (C). The statistical significance of wavelet-power was assessed using software for wavelet analysis incorporating algorisms for Brownian noise in MATLAB (http://noc.ac.uk/using-science/crosswavelet-wavelet-coherence/). Modified from ref. with permission.
Figure 7.
Figure 7.
Higuchi fractal dimension (FD) analysis of actual BAT temperature data (dark period BAT temperature from rat 854) and simulated data. The k values on the x axis in each right hand graph indicate bin widths used to determine the total signal length (lk on the y axis) in the Higuchi analysis. The selected bin width is the maximum k value yielding a linear relation (dotted straight line) between log(k) and log (lk). (A) The 700 min dark period portion of the BAT temperature record shown in Figure 6A. (B) Equivalent cosine wave with the average periodicity (76 min) of the BAT temperature wave. (C) Equivalent IgorPro random noise function.
Figure 8.
Figure 8.
Daily torpor in the Djungarian hamster (Phodopus sungorus). During the nocturnal activity period the hamster displayed an ultradian pattern of metabolic rate and body temperature which is largely associated with the ultradian pattern of locomotor activity. MR; metabolic rate. Ta; ambient temperature. Tb; body temperature. From ref. with permission.

Comment in

Similar articles

Cited by

References

    1. Pittendrigh CS. Temporal organization: Reflections of a Darwinian clock-watcher. Ann Rev Physiol 1993; 55:17-54; PMID:8466172; http://dx.doi.org/10.1146/annurev.ph.55.030193.000313 - DOI - PubMed
    1. Darwin C. On the Origin of Species by Means of Natural Selection. The Floating Press, ISBN: 9781775415374 (ebook) 2009 p151. Originally published in 1859.
    1. Szymanski JS. Aktivität und ruhe bei tieren und menschen. Zeitschrift Fjur Allgerneine Physiol 1920; 18:105-62.
    1. Richter CP. A behavioristic study of the activity of the rat. Comp Psychol Monogra 1922; 1:1-55.
    1. Kleitman N. Basic rest-activity cycle–22 years later. Sleep 1982; 5:311-7; PMID:6819628 - PubMed

LinkOut - more resources