

Connectivity patterns during music listening: Evidence for action-based processing in musicians
- PMID: 28349620
- PMCID: PMC6866725
- DOI: 10.1002/hbm.23565
Connectivity patterns during music listening: Evidence for action-based processing in musicians
Abstract
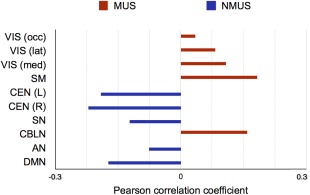
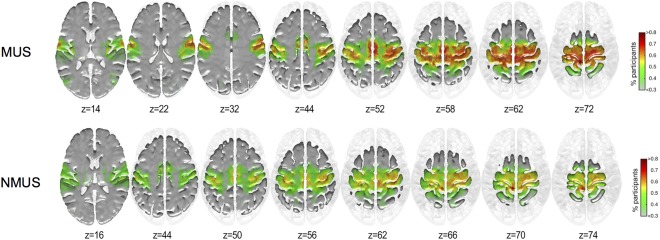
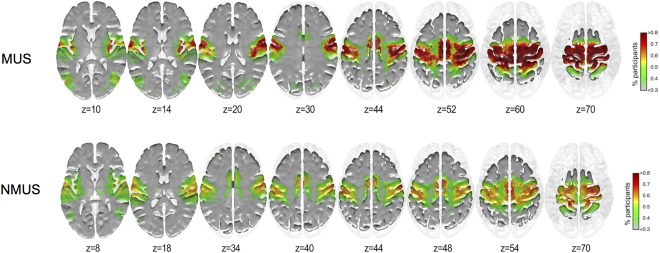
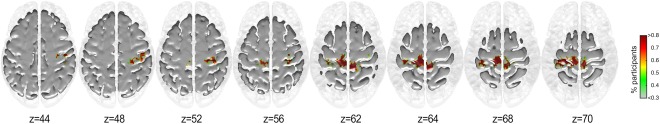
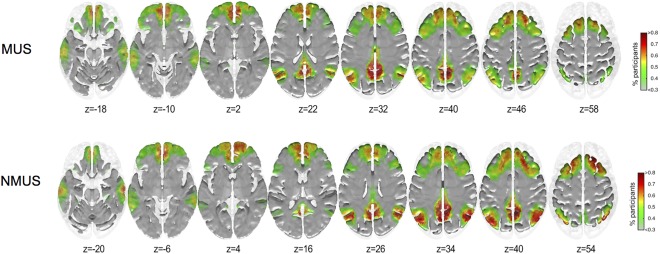
Musical expertise is visible both in the morphology and functionality of the brain. Recent research indicates that functional integration between multi-sensory, somato-motor, default-mode (DMN), and salience (SN) networks of the brain differentiates musicians from non-musicians during resting state. Here, we aimed at determining whether brain networks differentially exchange information in musicians as opposed to non-musicians during naturalistic music listening. Whole-brain graph-theory analyses were performed on participants' fMRI responses. Group-level differences revealed that musicians' primary hubs comprised cerebral and cerebellar sensorimotor regions whereas non-musicians' dominant hubs encompassed DMN-related regions. Community structure analyses of the key hubs revealed greater integration of motor and somatosensory homunculi representing the upper limbs and torso in musicians. Furthermore, musicians who started training at an earlier age exhibited greater centrality in the auditory cortex, and areas related to top-down processes, attention, emotion, somatosensory processing, and non-verbal processing of speech. We here reveal how brain networks organize themselves in a naturalistic music listening situation wherein musicians automatically engage neural networks that are action-based while non-musicians use those that are perception-based to process an incoming auditory stream. Hum Brain Mapp 38:2955-2970, 2017. © 2017 Wiley Periodicals, Inc.
Keywords: fMRI; functional connectivity; graph theory; music; musical training.
© 2017 Wiley Periodicals, Inc.
Figures
References
-
- Alluri V, Toiviainen P, Jääskeläinen IP, Glerean E, Sams M, Brattico E (2012): Large‐scale brain networks emerge from dynamic processing of musical timbre, key and rhythm. NeuroImage 59:3677–3689. - PubMed
-
- Alluri V, Toiviainen P, Lund TE, Wallentin M, Vuust P, Nandi AK, Ristaniemi T, Brattico E (2013): From Vivaldi to Beatles and back: Predicting lateralized brain responses to music. NeuroImage 83:627–636. - PubMed
-
- Alluri V, Brattico E, Toiviainen P, Burunat I, Bogert B, Numminen J, Kliuchko M (2015): Musical expertise modulates functional connectivity of limbic regions during continuous music listening. Psychomusicology 25:443–454.
-
- Amunts K, Schlaug G, Jäncke L, Steinmetz H, Schleicher A, Dabringhaus A, Zilles K (1997): Motor cortex and hand motor skills: Structural compliance in the human brain. Hum Brain Mapp 5:206–215. - PubMed
Publication types
MeSH terms
Substances
LinkOut - more resources
Full Text Sources
Other Literature Sources
