. 2017 Mar 28:7:45347.
doi: 10.1038/srep45347.

Discriminating cognitive status in Parkinson's disease through functional connectomics and machine learning

Affiliations

Discriminating cognitive status in Parkinson's disease through functional connectomics and machine learning

Alexandra Abós et al. Sci Rep. .

Abstract

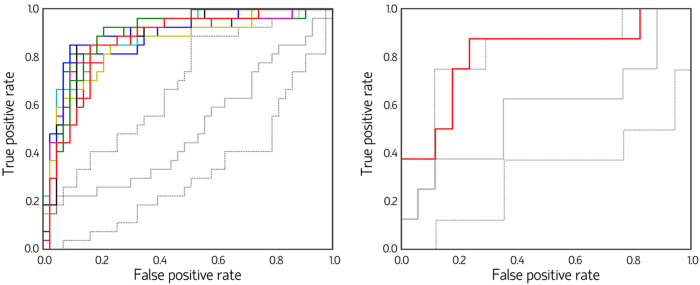
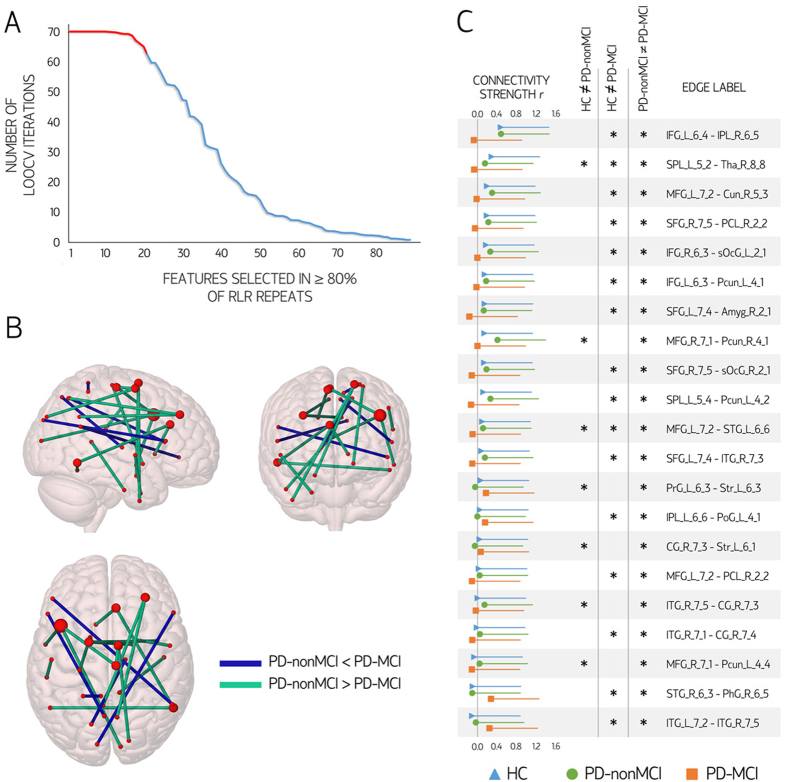
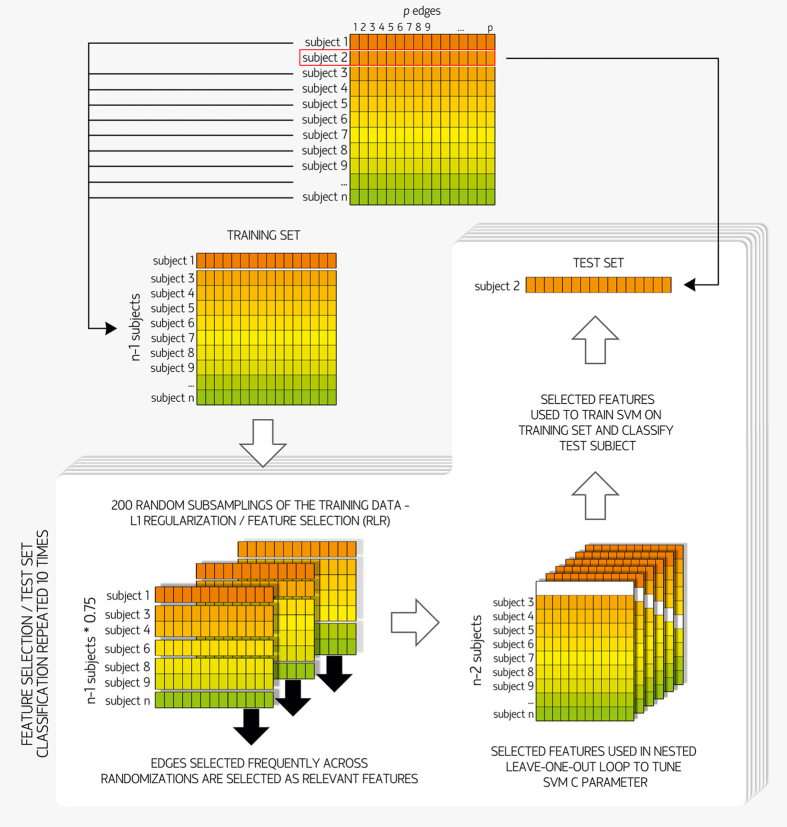
There is growing interest in the potential of neuroimaging to help develop non-invasive biomarkers in neurodegenerative diseases. In this study, connection-wise patterns of functional connectivity were used to distinguish Parkinson's disease patients according to cognitive status using machine learning. Two independent subject samples were assessed with resting-state fMRI. The first (training) sample comprised 38 healthy controls and 70 Parkinson's disease patients (27 with mild cognitive impairment). The second (validation) sample included 25 patients (8 with mild cognitive impairment). The Brainnetome atlas was used to reconstruct the functional connectomes. Using a support vector machine trained on features selected through randomized logistic regression with leave-one-out cross-validation, a mean accuracy of 82.6% (p < 0.002) was achieved in separating patients with mild cognitive impairment from those without it in the training sample. The model trained on the whole training sample achieved an accuracy of 80.0% when used to classify the validation sample (p = 0.006). Correlation analyses showed that the connectivity level in the edges most consistently selected as features was associated with memory and executive function performance in the patient group. Our results demonstrate that connection-wise patterns of functional connectivity may be useful for discriminating Parkinson's disease patients according to the presence of cognitive deficits.


Conflict of interest statement

The authors declare no competing financial interests.

Figures

Figure 1
Figure 1. Classification receiver operating characteristic curves (ROC).
Color curves indicate actual-model ROC (Left panel: ROC corresponding to the 10 actual-model feature selection repeats; Right panel: ROC corresponding to the classification of the validation sample). Example curves obtained from the null-model randomization procedures are also shown (left: reshuffling of group membership; right: reshuffling of the edges used as features). The central solid gray line depicts an ROC with an area under the curve close to the median of all permutations, whereas the lower and upper dotted gray lines represent ROC with areas under the curve close to percentiles 2.5 and 97.5, respectively, of the random distributions.
Figure 2
Figure 2. Edges used as features in the classification procedure.
Panel (A) shows the distribution of the 89 edges selected as relevant features in all randomized logistic regression (RLR) feature selection repeats. Twenty-one edges were selected in ≥80% of the leave-one-out cross-validation (LOOCV) iterations (red segment). Panel (B) depicts the location of the 21 edges most consistently selected as relevant features to discriminate Parkinson’s disease patients without mild cognitive impairment (PD-nonMCI) from patients with mild cognitive impairment (PD-MCI). Brain nodes are scaled according to the number of edges connected to them. Panel (C) shows the mean strength values and standard deviation of the 21 most consistent features according to group. Significant pairwise intergroup differences in edge strength (increases or decreases; p < 0.05 with false-discovery rate control) are marked with an asterisk. Labels of pairs of nodes connected by each edge are shown (see Supplementary Table 3). r: connectivity strength (Pearson’s correlation coefficient). HC: healthy controls. Amyg: Amygdala; BG: basal ganglia; CG: Cingulate gyrus; IFG: Inferior frontal gyrus; IPL: Inferior parietal lobule; ITG: Inferior temporal gyrus; LOcC: lateral occipital cortex; MFG: Middle frontal gyrus; MVOcC: medioventral occipital cortex; PCL: Paracentral lobule; Pcun: precuneus; PhG: Parahippocampal gyrus; PoG: Postcentral gyrus; PrG: Precentral gyrus; SFG: Superior frontal gyrus; SPL: Superior parietal lobule; STG: Superior temporal gyrus; Tha: Thalamus. Brain plots were created with Surf Ice (https://www.nitrc.org/projects/surfice/).
Figure 3
Figure 3. Comparison between healthy controls (HC) and Parkinson’s disease patients with mild cognitive impairment (PD-MCI) using network-based statistics (NBS).
(A) Schematic representation of the component consisting of 235 edges considered significantly different between groups (p < 0.05, family-wise error corrected). Brain nodes are scaled according to the number of edges in the significant component to which they are connected. Panel B shows the means and standard deviations of the connectivity strength of the 235 significant connections according to group. No significant differences were found between HC and Parkinson’s disease patients without mild cognitive impairment (PD-nonMCI) patients, or between PD-nonMCI and PD-MCI patients using NBS. r: connectivity strength (Pearson’s correlation coefficient). Brain plots were created with Surf Ice (https://www.nitrc.org/projects/surfice/).
Figure 4
Figure 4. Machine-learning algorithm.
Initially, the connectivity matrices of all 70 PD subjects were vectorized, and entered into the 70 leave-one-out cross-validation (LOOCV) iterations. For each iteration, one subject was defined as the test set, whereas the remaining 69 subjects made up the training set. Each training set was then fed into the 10 repeats of the feature selection procedure, randomized logistic regression (RLR). In each repeat, the features selected were used in a nested LOOCV loop (69 iterations) to tune the support vector machine (SVM) C parameter, and then to train a linear SVM on the training set. The resulting classifier model was then used to classify the corresponding test subject.

References

    1. Aarsland D. et al.. Cognitive impairment in incident, untreated Parkinson disease: the Norwegian ParkWest study. Neurology 72, 1121–1126 (2009). - PubMed
    1. Muslimovic D., Post B., Speelman J. D. & Schmand B. Cognitive profile of patients with newly diagnosed Parkinson disease. Neurology 65, 1239–45 (2005). - PubMed
    1. Aarsland D. & Kurz M. W. The epidemiology of dementia associated with Parkinson disease. J. Neurol. Sci. 289, 18–22 (2010). - PubMed
    1. Hely M. A., Reid W. G. J., Adena M. A., Halliday G. M. & Morris J. G. L. The Sydney multicenter study of Parkinson’s disease: the inevitability of dementia at 20 years. Mov. Disord. 23, 837–44 (2008). - PubMed
    1. Hely M. A. et al.. The sydney multicentre study of Parkinson’s disease: progression and mortality at 10 years. J. Neurol. Neurosurg. Psychiatry 67, 300–7 (1999). - PMC - PubMed

Publication types

MeSH terms

Substances