. 2017 Apr;50(4):1097-1108.
doi: 10.3892/ijo.2017.3909. Epub 2017 Mar 10.

miR‑150 inhibits proliferation and tumorigenicity via retarding G1/S phase transition in nasopharyngeal carcinoma

Affiliations

miR‑150 inhibits proliferation and tumorigenicity via retarding G1/S phase transition in nasopharyngeal carcinoma

Xiangyong Li et al. Int J Oncol. 2017 Apr.

Abstract

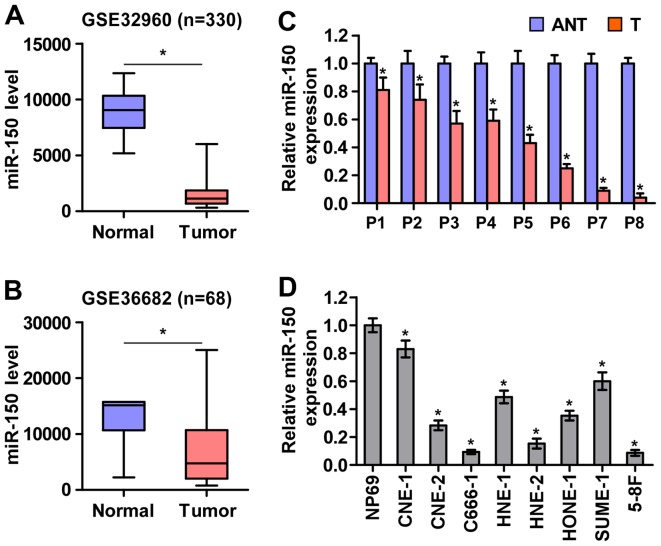
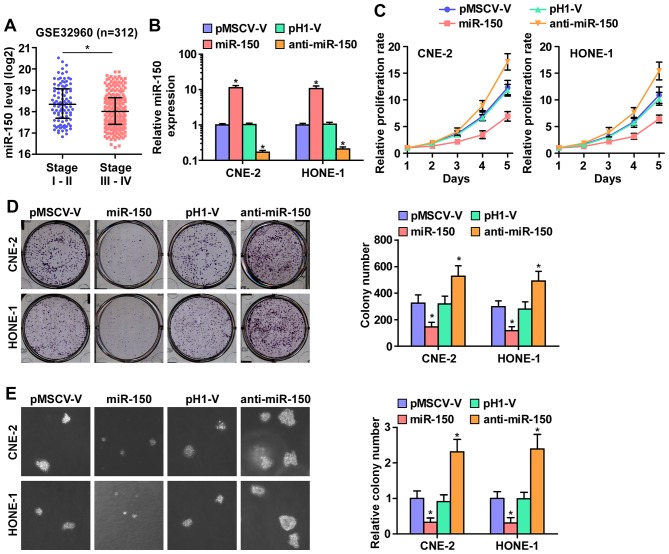
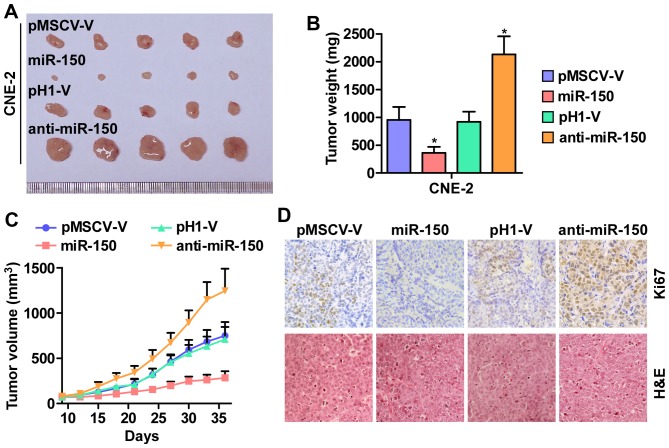
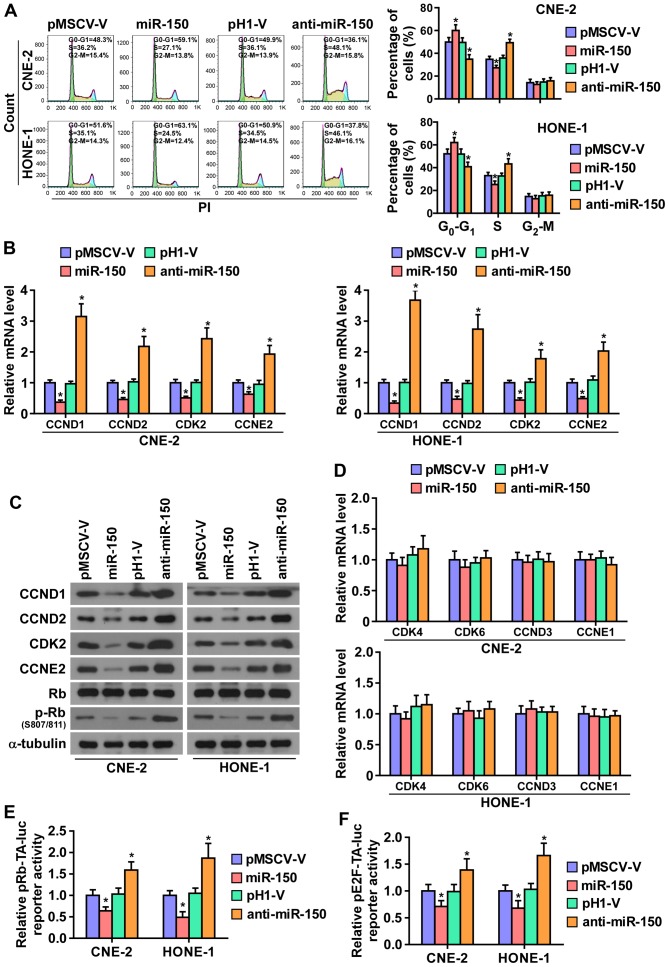
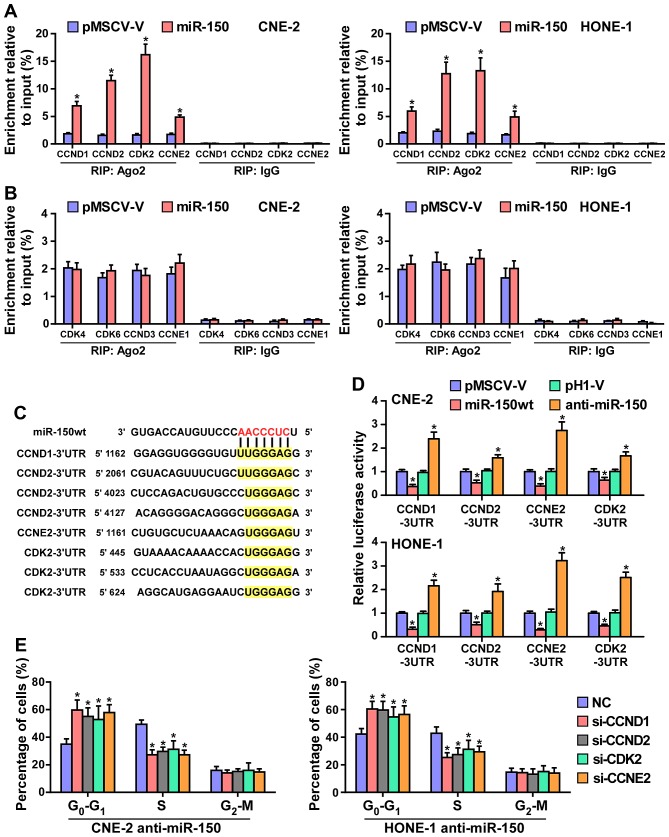
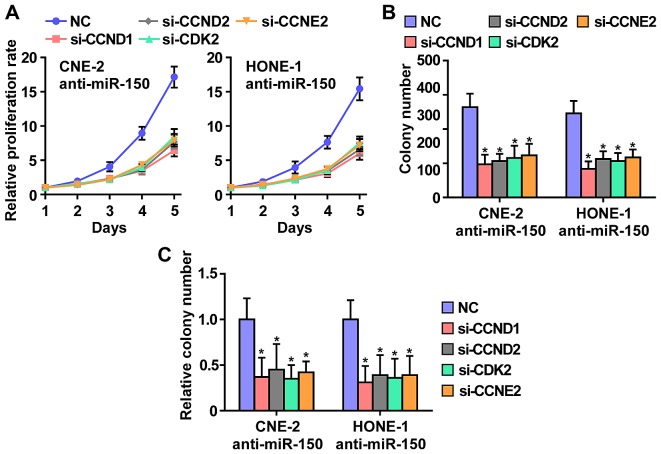
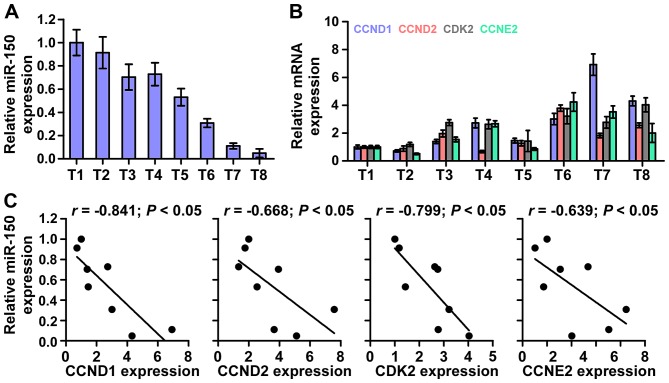
Cancer cells are characterized by a pathological manifestation of uncontrolled proliferation, which results in tumor formation. Therefore, it is necessary to improve understanding of the underlying mechanism of cell cycle control. Here, we report that miR‑150 is downregulated in nasopharyngeal carcinoma tissues and cells. Upregulation of miR‑150 suppresses nasopharyngeal carcinoma (NPC) cell proliferation and induces G1/S arrest in vitro, and inhibits tumorigenesis in vivo. Conversely, silencing miR‑150 yields the opposite effect. Our results further demonstrate that miR‑150 retards nasopharyngeal carcinoma cell proliferation and G1/S transition via targeting multiple cell cycle-related genes, including CCND1, CCND2, CDK2 and CCNE2. Therefore, our results uncover a novel mechanistic understanding of miR‑150-mediated tumor suppression in NPC, which will facilitate the development of effective cancer therapies against nasopharyngeal carcinoma.


Figures

Figure 1
Figure 1
miR-150 is downregulated in nasopharyngeal carcinoma tissues and cell lines. (A and B) miR-150 expression level was downregulated in the nasopharyngeal carcinoma datasets from GSE32960 and GSE36682. (C) Expression of miR-150 was downregulated in 8 paired nasopharyngeal carcinoma tissues compared with the matched adjacent normal nasopharyngeal carcinoma tissue samples. Each bar represents the mean values ± SD of three independent experiments. *P<0.05. (D) Real-time PCR analysis of miR-150 expression in NP69 and nasopharyngeal carcinoma cell lines. U6 was used as endogenous control in RT-PCR. Each bar represents the mean values ± SD of three independent experiments. *P<0.05.
Figure 2
Figure 2
miR-150 inhibits the proliferation of nasopharyngeal carcinoma cells in vitro. (A) Downregulation of miR-150 positively correlated with clinical stages of nasopharyngeal carcinoma. (B) miR-150 expression was detected by real-time PCR analysis. miR-150 expression was examined in overexpressed miR-150 and anti-miR-150 NPC cells, and their respective control vectors. U6 was used as the loading control. Each bar represents the mean values ± SD of three independent experiments. *P<0.05. (C) CCK-8 assay revealed that overexpression of miR-150 decreased, while downregulation of endogenous miR-150 increased the proliferation rate in CNE-2 and HONE1 cells. Each bar represents the mean values ± SD of three independent experiments. (D) Colony formation assay revealed that overexpression of miR-150 decreased, while downregulation of endogenous miR-150 increased the colony-forming ability in CNE-2 and HONE1 cells. Each bar represents the mean values ± SD of three independent experiments. *P<0.05. (E) Anchorage-independent growth assays revealed that overexpression of miR-150 decreased, while downregulation of endogenous miR-150 increased the anchorage-independent growth ability in CNE-2 and HONE1 cells. Each bar represents the mean values ± SD of three independent experiments. *P<0.05.
Figure 3
Figure 3
miR-150 inhibits tumorigenesis of nasopharyngeal carcinoma cells in vivo. (A) Images of excised tumors from five BALB/c mice at 30 days after injection with the indicated cells. (B) Average weight of excised tumors from the indicated mice. Each bar represents the median values ± quartile values. *P<0.05. (C) Tumor volumes were measured every five days. Each bar represents the median values ± quartile values. (D) Representative images of sections sliced from the indicated tumors and stained with anti-Ki67 and H&E staining, respectively.
Figure 4
Figure 4
miR-150 inhibits the cell cycle of nasopharyngeal carcinoma cells. (A) Flow cytometric analysis of the indicated nasopharyngeal carcinoma cells. Each bar represents the mean values ± SD of three independent experiments. *P<0.05. (B) Real-time PCR analysis of CCND1, CCND2, CKD2 and CCNE2 expression in the indicated cells. Transcript levels were normalized by GAPDH expression. Each bar represents the mean values ± SD of three independent experiments. *P<0.05. (C) Western blot analysis of CCND1, CCND2, CDK2, CCNE2 and p-Rb expression in the indicated cells. (D) Real-time PCR analysis of CDK4, CDK6, CCND3 and CCNE2 mRNA expression in overexpressed miR-150 and anti-miR-150 NPC cells, and their respective control vectors. U6 was used as the loading control. Each bar represents the mean values ± SD of three independent experiments. *P<0.05. (E and F) Relative Rb activity and E2F reporter activity in the indicated cells. Each bar represents the mean values ± SD of three independent experiments. *P<0.05.
Figure 5
Figure 5
miR-150 inhibits the cell cycle progression by directly targeting CCND1, CCND2, CDK2 and CCNE2. (A) MiRNP IP (RIP) assay showing the association between miR-150 and CCND1, CCND2, CDK2 and CCNE2 transcripts in CNE-2 and HONE1 cells. Pulldown of IgG antibody served as the negative control. (B) RIP analysis show that CDK4, CDK6, CCND3 and CCNE1 were not affected by miR-150. RIP analysis, as assessed by immunoprecipitation of Ago2 in the indicated cells. IgG immunoprecipitation was used as a negative control. *P<0.05. (C) Predicted miR-150 targeting sequence in 3′-UTRs of CCND1, CCND2, CDK2 and CCNE2. (D) Luciferase assay of cells transfected with pmirGLO-3′-UTR reporter of CCND1, CCND2, CDK2 and CCNE2 in miR-150 overexpressing and silencing in CNE-2 and HONE1 cells, respectively. (E) Individual silencing of CCND1, CCND2, CDK2 and CCNE2 increased the percentage of NPC cells in G0 phase, while the percentage of cells in S phase was decreased in miR-150-silencing cells.
Figure 6
Figure 6
CCND1, CCND2, CDK2 and CCNE2 mediates the miR-150-downregulation-induced NPC cell growth. (A) Individual silencing of CCND1, CCND2, CDK2 and CCNE2 rescued the proliferation rate enhanced by anti-miR-150. (B) Individual silencing of CCND1, CCND2, CDK2 and CCNE2 rescued the colony-formation ability enhanced by anti-miR-150. (C) Individual silencing of CCND1, CCND2, CDK2 and CCNE2 rescued the anchorage-independent growth ability enhanced by anti-miR-150.
Figure 7
Figure 7
Clinical relevance of miR-150 with CCND1, CCND2, CDK2 and CCNE2 in nasopharyngeal carcinoma tissues. (A) miR-150 expression in eight freshly-frozen human nasopharyngeal carcinoma tissues. Transcript levels were normalized by U6 expression. One tissue sample was randomly selected and numbered as T1, other 7 tissue samples were numbered in order as T2, T3, T4, T5, T6, T7 and T8. The expression levels of miR-150 in each NPC tissue were normalized by the corresponding miR-150 expression in T1 NPC tissue. The relative expression levels of miR-150 after normalization were used to perform the correlation analysis among miR-150 and CCND1, CCND2, CKD2 and CCNE2 expression. (B) Analysis of CCND1, CCND2, CDK2 and CCNE2 expression in eight freshly-frozen human nasopharyngeal carcinoma tissues. Transcript levels were normalized by GAPDH expression. One tissue sample was randomly selected and numbered as T1, other 7 tissue samples were numbered in order as T2, T3, T4, T5, T6, T7 and T8. The expression levels of CCND1, CCND2, CKD2 and CCNE2 in each NPC tissue were normalized by the corresponding CCND1, CCND2, CKD2 and CCNE2 expression levels in T1 NPC tissue. The relative expression levels of CCND1, CCND2, CKD2 and CCNE2 after normalization were used to perform the correlation analysis among miR-150 and CCND1, CCND2, CKD2 and CCNE2 expression. (C) Correlation between miR-150 levels and CCND1, CCND2, CDK2 and CCNE2 expression in nasopharyngeal carcinoma tissues.

References

    1. Jemal A, Bray F, Center MM, Ferlay J, Ward E, Forman D. Global cancer statistics. CA Cancer J Clin. 2011;61:69–90. doi: 10.3322/caac.20107. - DOI - PubMed
    1. Qu C, Liang Z, Huang J, Zhao R, Su C, Wang S, Wang X, Zhang R, Lee MH, Yang H. MiR-205 determines the radioresistance of human nasopharyngeal carcinoma by directly targeting PTEN. Cell Cycle. 2012;11:785–796. doi: 10.4161/cc.11.4.19228. - DOI - PMC - PubMed
    1. Ai MD, Li LL, Zhao XR, Wu Y, Gong JP, Cao Y. Regulation of survivin and CDK4 by Epstein-Barr virus encoded latent membrane protein 1 in nasopharyngeal carcinoma cell lines. Cell Res. 2005;15:777–784. doi: 10.1038/sj.cr.7290347. - DOI - PubMed
    1. Zhen Y, Fang W, Zhao M, Luo R, Liu Y, Fu Q, Chen Y, Cheng C, Zhang Y, Liu Z. miR-374a-CCND1-pPI3K/AKT-c-JUN feedback loop modulated by PDCD4 suppresses cell growth, metastasis, and sensitizes nasopharyngeal carcinoma to cisplatin. Oncogene. 2017;36:275–285. doi: 10.1038/onc.2016.201. - DOI - PubMed
    1. Nigg EA. Cyclin-dependent protein kinases: Key regulators of the eukaryotic cell cycle. BioEssays. 1995;17:471–480. doi: 10.1002/bies.950170603. - DOI - PubMed