. 2017 Mar 28;12(3):e0174404.
doi: 10.1371/journal.pone.0174404. eCollection 2017.

Diversification of spatiotemporal expression and copy number variation of the echinoid hbox12/pmar1/micro1 multigene family

Affiliations

Diversification of spatiotemporal expression and copy number variation of the echinoid hbox12/pmar1/micro1 multigene family

Vincenzo Cavalieri et al. PLoS One. .

Abstract

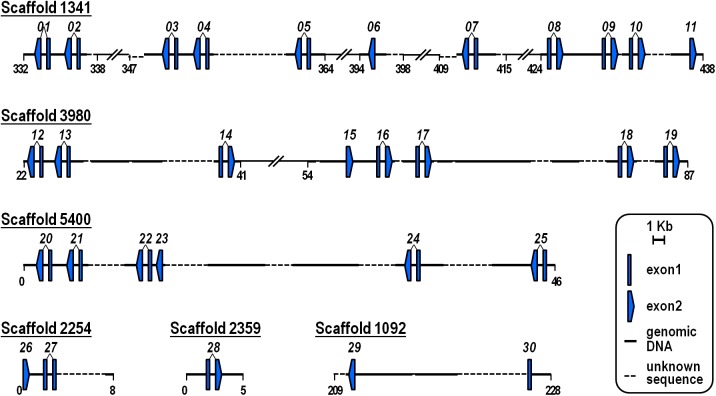
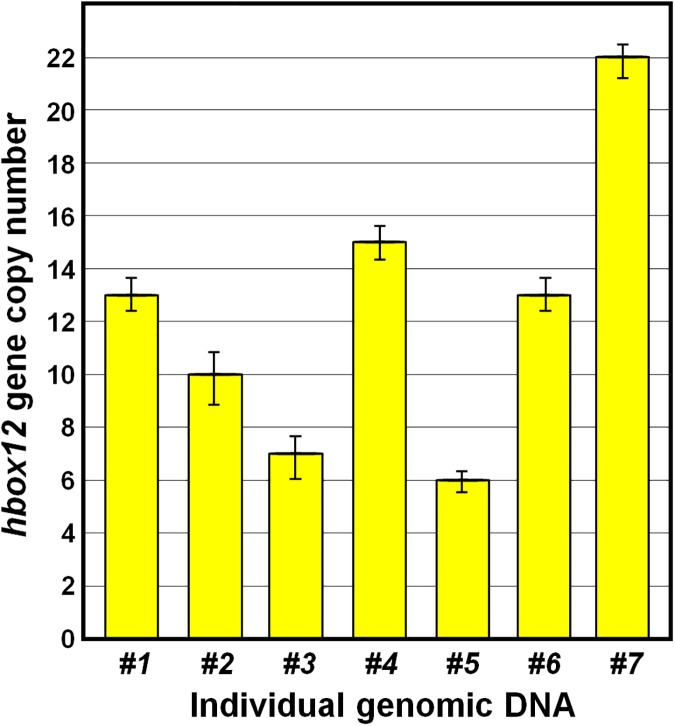
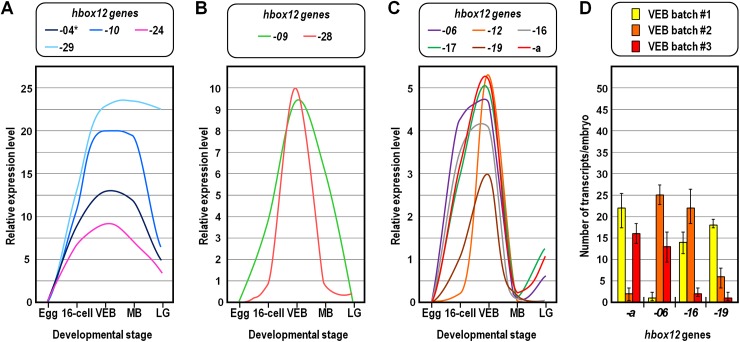
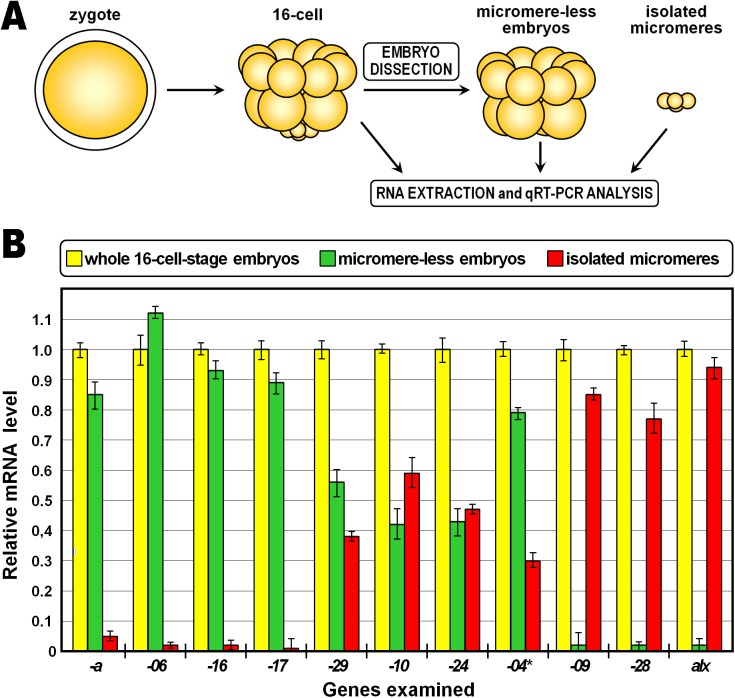
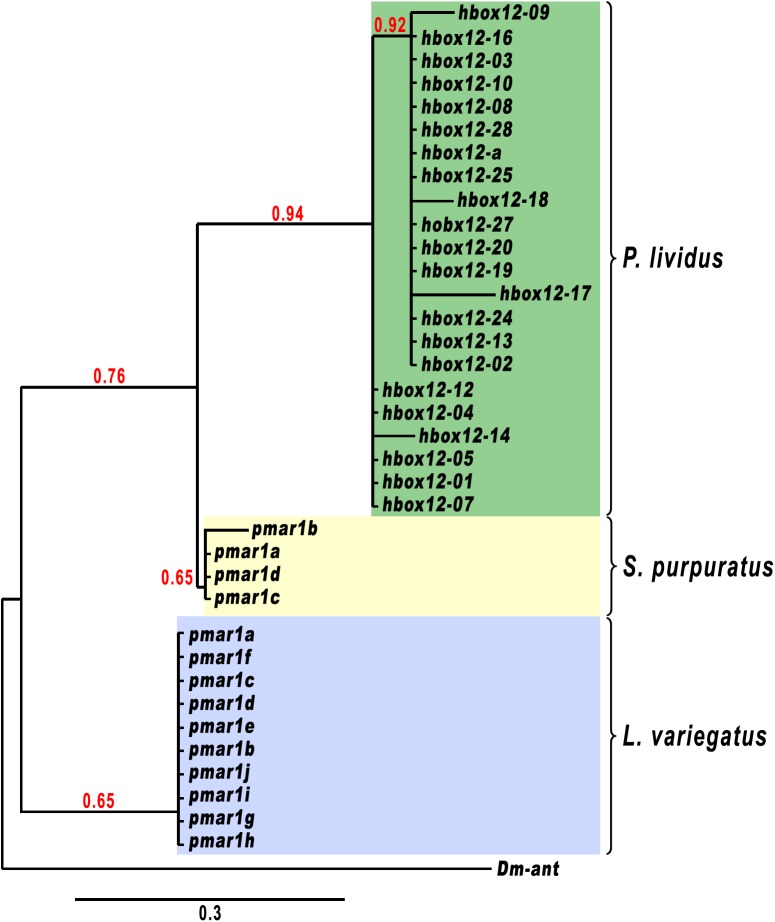
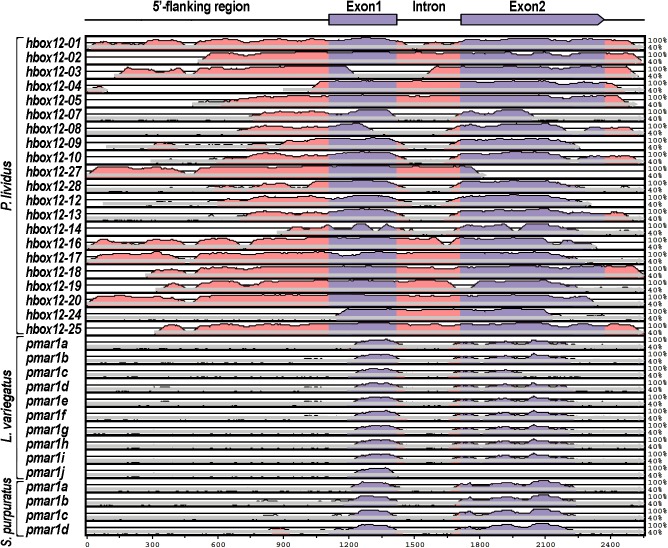
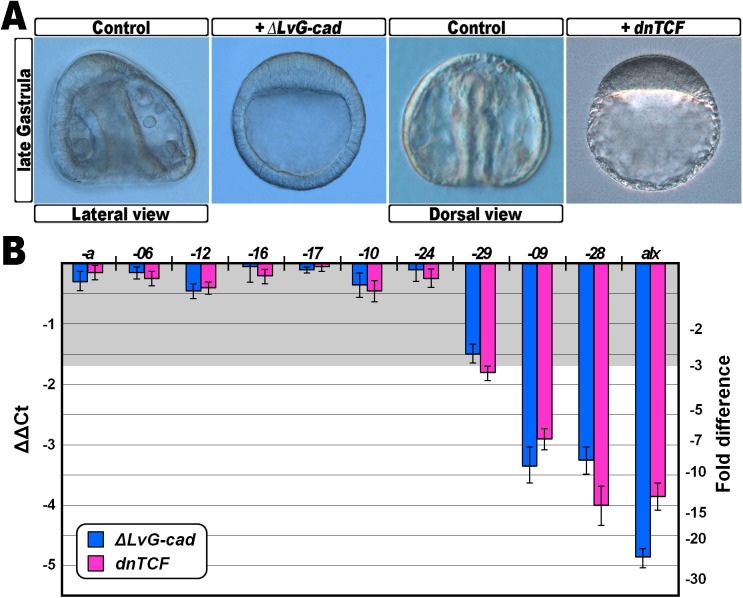
Changes occurring during evolution in the cis-regulatory landscapes of individual members of multigene families might impart diversification in their spatiotemporal expression and function. The archetypal member of the echinoid hbox12/pmar1/micro1 family is hbox12-a, a homeobox-containing gene expressed exclusively by dorsal blastomeres, where it governs the dorsal/ventral gene regulatory network during embryogenesis of the sea urchin Paracentrotus lividus. Here we describe the inventory of the hbox12/pmar1/micro1 genes in P. lividus, highlighting that gene copy number variation occurs across individual sea urchins of the same species. We show that the various hbox12/pmar1/micro1 genes group into three subfamilies according to their spatiotemporal expression, which ranges from broad transcription throughout development to transient expression in either the animal hemisphere or micromeres of the early embryo. Interestingly, the promoter regions of those genes showing comparable expression patterns are highly similar, while differing from those of the other subfamilies. Strikingly, phylogenetic analysis suggests that the hbox12/pmar1/micro1 genes are species-specific, exhibiting extensive divergence in their noncoding, but not in their coding, sequences across three distinct sea urchin species. In spite of this, two micromere-specific genes of P. lividus possess a TCF/LEF-binding motif in a similar position, and their transcription relies on Wnt/β-catenin signaling, similar to the pmar1 and micro1 genes, which in other sea urchin species are involved in micromere specification. Altogether, our findings suggest that the hbox12/pmar1/micro1 gene family evolved rather rapidly, generating paralogs whose cis-regulatory sequences diverged following multiple rounds of duplication from a common ancestor.


Conflict of interest statement

Competing Interests: The authors have declared that no competing interests exist.

Figures

Fig 1
Fig 1. Genomic organization of the hbox12/pmar1/micro1 family members of the sea urchin P. lividus.
The exon-intron structure, orientation, and location for each gene are shown. Scaffold number identifiers and coordinates are based on v4.0 of the P. lividus genome assembly (http://octopus.obs-vlfr.fr/blast/oursin/blast_oursin.php). The hbox12-27 gene displays a normal genomic organization, but the 3’ portion of the exon 2 is missing due to lack of genomic sequence. Unrelated genes are omitted for simplicity.
Fig 2
Fig 2. Hbox12/pmar1/micro1 gene copy number determination in the genome of seven distinct P. lividus individuals.
The histogram derived from qPCR data represent the number of hbox12 copies normalized to the single copy gene controls otp and cmpl. Error bars are standard errors for the qPCR replicates.
Fig 3
Fig 3. Temporal expression of the hbox12/pmar1/micro1 gene family members in the P. lividus embryo.
(A-C) Individual representation of each expression profile presented as the mean relative to global hbox12/pmar1/micro1 transcript abundance measured with the universal primer pair at the indicated developmental stages. Expression profiles with standard errors of the mean between replicates are shown individually in S3 Fig. The developmental stages are as follows: Egg, unfertilized egg; 16-cell, fourth cleavage embryo; VEB, very early blastula; MB, mesenchyme blastula; LG, late gastrula. The asterisk indicates that the hbox12-04 amplicon was obtained together with the hbox12-21 and -25 amplicons by co-amplification with the same primer pair. (D) The absolute number of transcripts per embryo given at the very early blastula stage derives from independent qPCR experiments using distinct cDNA batches. Further detail for the qPCR procedure is given in Materials and Methods. The error bars are standard errors for qPCR replicates. The oligonucleotide primer pairs used for the qPCR reactions and amplicon lengths are indicated in S1 Table.
Fig 4
Fig 4. Spatial distribution of the hbox12/pmar1/micro1 gene family transcripts in fourth cleavage embryos.
(A) Fertilized eggs were grown until the 16-cell stage, followed by embryo dissection. Isolated micromeres and the complementary micromere-less embryos, as well as control undissected embryos at the same stage, were immediately processed for qPCR analysis. (B) qPCR measurements of hbox12/pmar1/micro1 family members and alx transcript abundance in embryo fractions shown as a percentage of the hbox12 and alx mRNA levels in control undissected embryos at the fourth cleavage. The error bars are standard errors for the qPCR replicates. Oligonucleotide primer pairs used for qPCR reactions and amplicon lengths are indicated in S1 Table.
Fig 5
Fig 5. Phylogenetic relationship among the hbox12/pmar1/micro1 genes of P. lividus, S. purpuratus and L. variegatus.
After alignment of sequences with MUSCLE v3.8.31, ambiguous regions (i.e. containing gaps and/or poorly aligned) were removed with Gblocks v0.91b. A rooted Maximum Likelihood phylogenetic tree was reconstructed using the PhyML v3.1/3.0 aLRT, and graphically represented using TreeDyn v198.3. The ant gene (AY060407.1) of Drosophila melanogaster was identified by a BLAST search with hbox12-a against the NCBI databases as one of the homeobox-containing genes with higher sequence similarity within the homeobox, and it was therefore used as an outgroup. Numbers above nodes record percent bootstrap values, and branches with support value smaller than 50% are collapsed. pmar1 genes from L. variegatus and S. purpuratus were retrieved by Genscan analysis of the following scaffold items: AC131562.1 (Lvpmar1a-j), AC168388.2 (Sppmar1a-b), AC179748.1 (Sppmar1c), and AC149920.2 (Sppmar1d).
Fig 6
Fig 6. Comparison of hbox12/pmar1/micro1 loci across sea urchin species.
Structural annotation of the hbox12/pmar1/micro1 locus is shown in the drawing on top. The genomic sequences used in Fig 5 were compared using the mVISTA software package [46,47] to determine evolutionary conserved regions among the three sea urchin species indicated, using hbox12-a as the reference sequence. Each graph show a pairwise alignment with the extent of sequence identity plotted on the Y-axis against the indicated sequence. The grey arrow below each graph shows the extent of the sequence used, while the filled portions indicate conservation (>70% over 100 bp) of either exons (labeled in blue) or noncoding sequences (pink). Note that significant sequence similarity across all species is found exclusively in the protein coding regions.
Fig 7
Fig 7. Inhibition of the wnt/β-catenin signalling pathway and effect of hbox12/pmar1/micro1 family gene expression.
(A) Representative examples of control gastrulae and embryos at the same stage injected with either ΔLvG-cad or dnTCF synthetic transcripts. (B) Changes in gene expression level of hbox12/pmar1/micro1 family members assessed by qPCR in ΔLvG-cad- and dnTCF-injected embryos. Data are indicated as normalized ΔCt (ΔΔCt, left ordinate), and as the corresponding fold difference in transcript abundance (right ordinate), with respect to control embryos, at the same stage of development, derived from zygotes injected with the strim1 out-of-frame transcript. The gray region represents ΔΔCt values corresponding to non-significant variation (less than 3-fold difference). Error bars are standard errors for the qPCR replicates. Oligonucleotide primer pairs used for qPCR reactions and amplicon lengths are indicated in S1 Table.

Similar articles

Cited by

References

    1. Ettensohn CA. Encoding anatomy: developmental gene regulatory networks and morphogenesis. Genesis 2013; 51:383–409. 10.1002/dvg.22380 - DOI - PubMed
    1. Martik ML, Lyons DC, McClay DR. Developmental gene regulatory networks in sea urchins and what we can learn from them. F1000Res 2016; 5. - PMC - PubMed
    1. Parfitt DE, Shen MM. From blastocyst to gastrula: gene regulatory networks of embryonic stem cells and early mouse embryogenesis. Philos Trans R Soc Lond B Biol Sci 2014; 369. - PMC - PubMed
    1. Satou Y, Imai KS. Gene regulatory systems that control gene expression in the Ciona embryo. Proc Jpn Acad Ser B Phys Biol Sci 2015; 91:33–51. 10.2183/pjab.91.33 - DOI - PMC - PubMed
    1. Hinman VF, Nguyen AT, Cameron RA, Davidson EH. Developmental gene regulatory network architecture across 500 million years of echinoderm evolution. Proc Natl Acad Sci USA 2003; 100:13356–61. 10.1073/pnas.2235868100 - DOI - PMC - PubMed

LinkOut - more resources