

Sporobolus stapfianus: Insights into desiccation tolerance in the resurrection grasses from linking transcriptomics to metabolomics
- PMID: 28351347
- PMCID: PMC5371216
- DOI: 10.1186/s12870-017-1013-7
Sporobolus stapfianus: Insights into desiccation tolerance in the resurrection grasses from linking transcriptomics to metabolomics
Abstract
Background: Understanding the response of resurrection angiosperms to dehydration and rehydration is critical for deciphering the mechanisms of how plants cope with the rigors of water loss from their vegetative tissues. We have focused our studies on the C4 resurrection grass, Sporobolus stapfianus Gandoger, as a member of a group of important forage grasses.
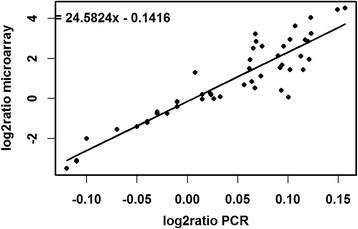
Methods: We have combined non-targeted metabolomics with transcriptomics, via a NimbleGen array platform, to develop an understanding of how gene expression and metabolite profiles can be linked to generate a more detailed mechanistic appreciation of the cellular response to both desiccation and rehydration.
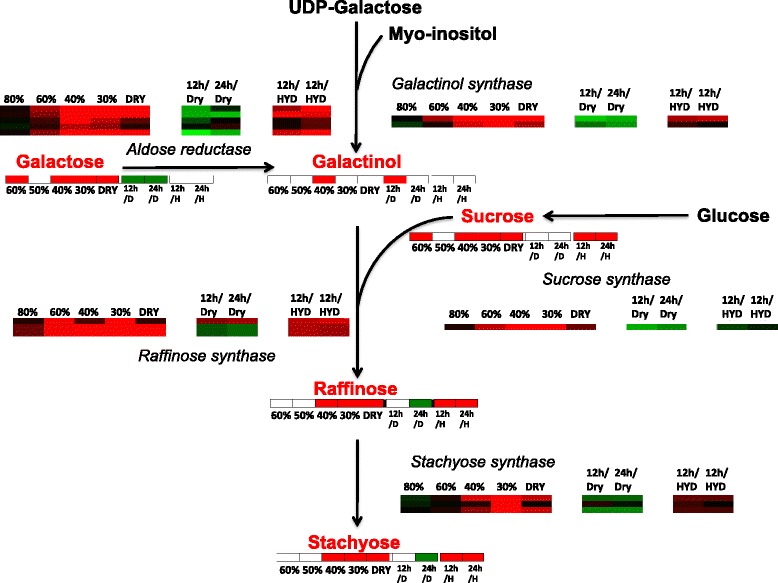
Results: The rehydration transcriptome and metabolome are primarily geared towards the rapid return of photosynthesis, energy metabolism, protein turnover, and protein synthesis during the rehydration phase. However, there are some metabolites associated with ROS protection that remain elevated during rehydration, most notably the tocopherols. The analysis of the dehydration transcriptome reveals a strong concordance between transcript abundance and the associated metabolite abundance reported earlier, but only in responses that are directly related to cellular protection during dehydration: carbohydrate metabolism and redox homeostasis. The transcriptome response also provides strong support for the involvement of cellular protection processes as exemplified by the increases in the abundance of transcripts encoding late embryogenesis abundant (LEA) proteins, anti-oxidant enzymes, early light-induced proteins (ELIP) proteins, and cell-wall modification enzymes. There is little concordance between transcript and metabolite abundance for processes such as amino acid metabolism that do not appear to contribute directly to cellular protection, but are nonetheless important for the desiccation tolerant phenotype of S. stapfianus.
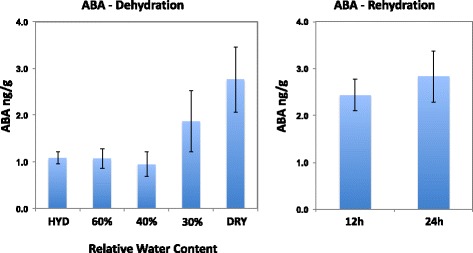
Conclusions: The transcriptomes of both dehydration and rehydration offer insight into the complexity of the regulation of responses to these processes that involve complex signaling pathways and associated transcription factors. ABA appears to be important in the control of gene expression in both the latter stages of the dehydration and the early stages of rehydration. These findings add to the growing body of information detailing how plants tolerate and survive the severe cellular perturbations of dehydration, desiccation, and rehydration.
Keywords: Abiotic stress; Dehydration stress; Gene expression; Rehydration; Resurrection plants; Sporobolus stapfianus.
Figures
Similar articles
-
A comparative genomics examination of desiccation tolerance and sensitivity in two sister grass species.Proc Natl Acad Sci U S A. 2022 Feb 1;119(5):e2118886119. doi: 10.1073/pnas.2118886119. Proc Natl Acad Sci U S A. 2022. PMID: 35082155 Free PMC article.
-
Proteome analysis of leaves of the desiccation-tolerant grass, Sporobolus stapfianus, in response to dehydration.Phytochemistry. 2011 Jul;72(10):1273-84. doi: 10.1016/j.phytochem.2010.10.020. Epub 2010 Nov 23. Phytochemistry. 2011. PMID: 21109273
-
Evidence for the presence of photorespiration in desiccation-sensitive leaves of the C4 'resurrection' plant Sporobolus stapfianus during dehydration stress.J Exp Bot. 2007;58(14):3929-39. doi: 10.1093/jxb/erm247. Epub 2007 Nov 23. J Exp Bot. 2007. PMID: 18037680
-
Drying without senescence in resurrection plants.Front Plant Sci. 2014 Feb 12;5:36. doi: 10.3389/fpls.2014.00036. eCollection 2014. Front Plant Sci. 2014. PMID: 24575108 Free PMC article. Review.
-
Surviving metabolic arrest: photosynthesis during desiccation and rehydration in resurrection plants.Ann N Y Acad Sci. 2016 Feb;1365(1):89-99. doi: 10.1111/nyas.12884. Epub 2015 Sep 16. Ann N Y Acad Sci. 2016. PMID: 26376004 Review.
Cited by
-
Shared up-regulation and contrasting down-regulation of gene expression distinguish desiccation-tolerant from intolerant green algae.Proc Natl Acad Sci U S A. 2020 Jul 21;117(29):17438-17445. doi: 10.1073/pnas.1906904117. Epub 2020 Jul 7. Proc Natl Acad Sci U S A. 2020. PMID: 32636259 Free PMC article.
-
Systems biology of resurrection plants.Cell Mol Life Sci. 2021 Oct;78(19-20):6365-6394. doi: 10.1007/s00018-021-03913-8. Epub 2021 Aug 14. Cell Mol Life Sci. 2021. PMID: 34390381 Free PMC article. Review.
-
A comparative genomics examination of desiccation tolerance and sensitivity in two sister grass species.Proc Natl Acad Sci U S A. 2022 Feb 1;119(5):e2118886119. doi: 10.1073/pnas.2118886119. Proc Natl Acad Sci U S A. 2022. PMID: 35082155 Free PMC article.
-
Maize nodal root growth maintenance during water deficit: metabolic acclimation and the role of increased solute deposition in osmotic adjustment.Front Plant Sci. 2025 Jun 9;16:1566453. doi: 10.3389/fpls.2025.1566453. eCollection 2025. Front Plant Sci. 2025. PMID: 40551771 Free PMC article.
-
Dehydration-Induced DnaK2 Chaperone Is Involved in PSII Repair of a Desiccation-Tolerant Cyanobacterium.Plant Physiol. 2020 Apr;182(4):1991-2005. doi: 10.1104/pp.19.01149. Epub 2020 Feb 5. Plant Physiol. 2020. PMID: 32024697 Free PMC article.
References
-
- Proctor M, Pence V. Vegetative Tissues: bryophytes, vascular resurrection plants and vegetative propagules. In: Black M, Pritchard H, editors. Desiccation and Survival in Plants: Drying without dying. Oxford: CABI Publishing; 2002. pp. 207–238.
-
- Alpert P, Oliver M. Drying without dying. In: Black M, Pritchard H, editors. Desiccation and Survival in Plants: Drying without Dying. New York, USA: CABI Publishing; 2002. pp. 1–43.
-
- Oliver MJ, Tuba Z, Mishler BD. The evolution of vegetative desiccation tolerance in land plants. Plant Ecol. 2000;151:85–100. doi: 10.1023/A:1026550808557. - DOI
Publication types
MeSH terms
Substances
Grants and funding
LinkOut - more resources
Full Text Sources
Other Literature Sources
Molecular Biology Databases
Miscellaneous
