. 2017 Mar 28;18(1):58.
doi: 10.1186/s13059-017-1185-3.

Diverse interventions that extend mouse lifespan suppress shared age-associated epigenetic changes at critical gene regulatory regions

Affiliations

Diverse interventions that extend mouse lifespan suppress shared age-associated epigenetic changes at critical gene regulatory regions

John J Cole et al. Genome Biol. .

Abstract

Background: Age-associated epigenetic changes are implicated in aging. Notably, age-associated DNA methylation changes comprise a so-called aging "clock", a robust biomarker of aging. However, while genetic, dietary and drug interventions can extend lifespan, their impact on the epigenome is uncharacterised. To fill this knowledge gap, we defined age-associated DNA methylation changes at the whole-genome, single-nucleotide level in mouse liver and tested the impact of longevity-promoting interventions, specifically the Ames dwarf Prop1 df/df mutation, calorie restriction and rapamycin.

Results: In wild-type mice fed an unsupplemented ad libitum diet, age-associated hypomethylation was enriched at super-enhancers in highly expressed genes critical for liver function. Genes harbouring hypomethylated enhancers were enriched for genes that change expression with age. Hypermethylation was enriched at CpG islands marked with bivalent activating and repressing histone modifications and resembled hypermethylation in liver cancer. Age-associated methylation changes are suppressed in Ames dwarf and calorie restricted mice and more selectively and less specifically in rapamycin treated mice.

Conclusions: Age-associated hypo- and hypermethylation events occur at distinct regulatory features of the genome. Distinct longevity-promoting interventions, specifically genetic, dietary and drug interventions, suppress some age-associated methylation changes, consistent with the idea that these interventions exert their beneficial effects, in part, by modulation of the epigenome. This study is a foundation to understand the epigenetic contribution to healthy aging and longevity and the molecular basis of the DNA methylation clock.


Figures
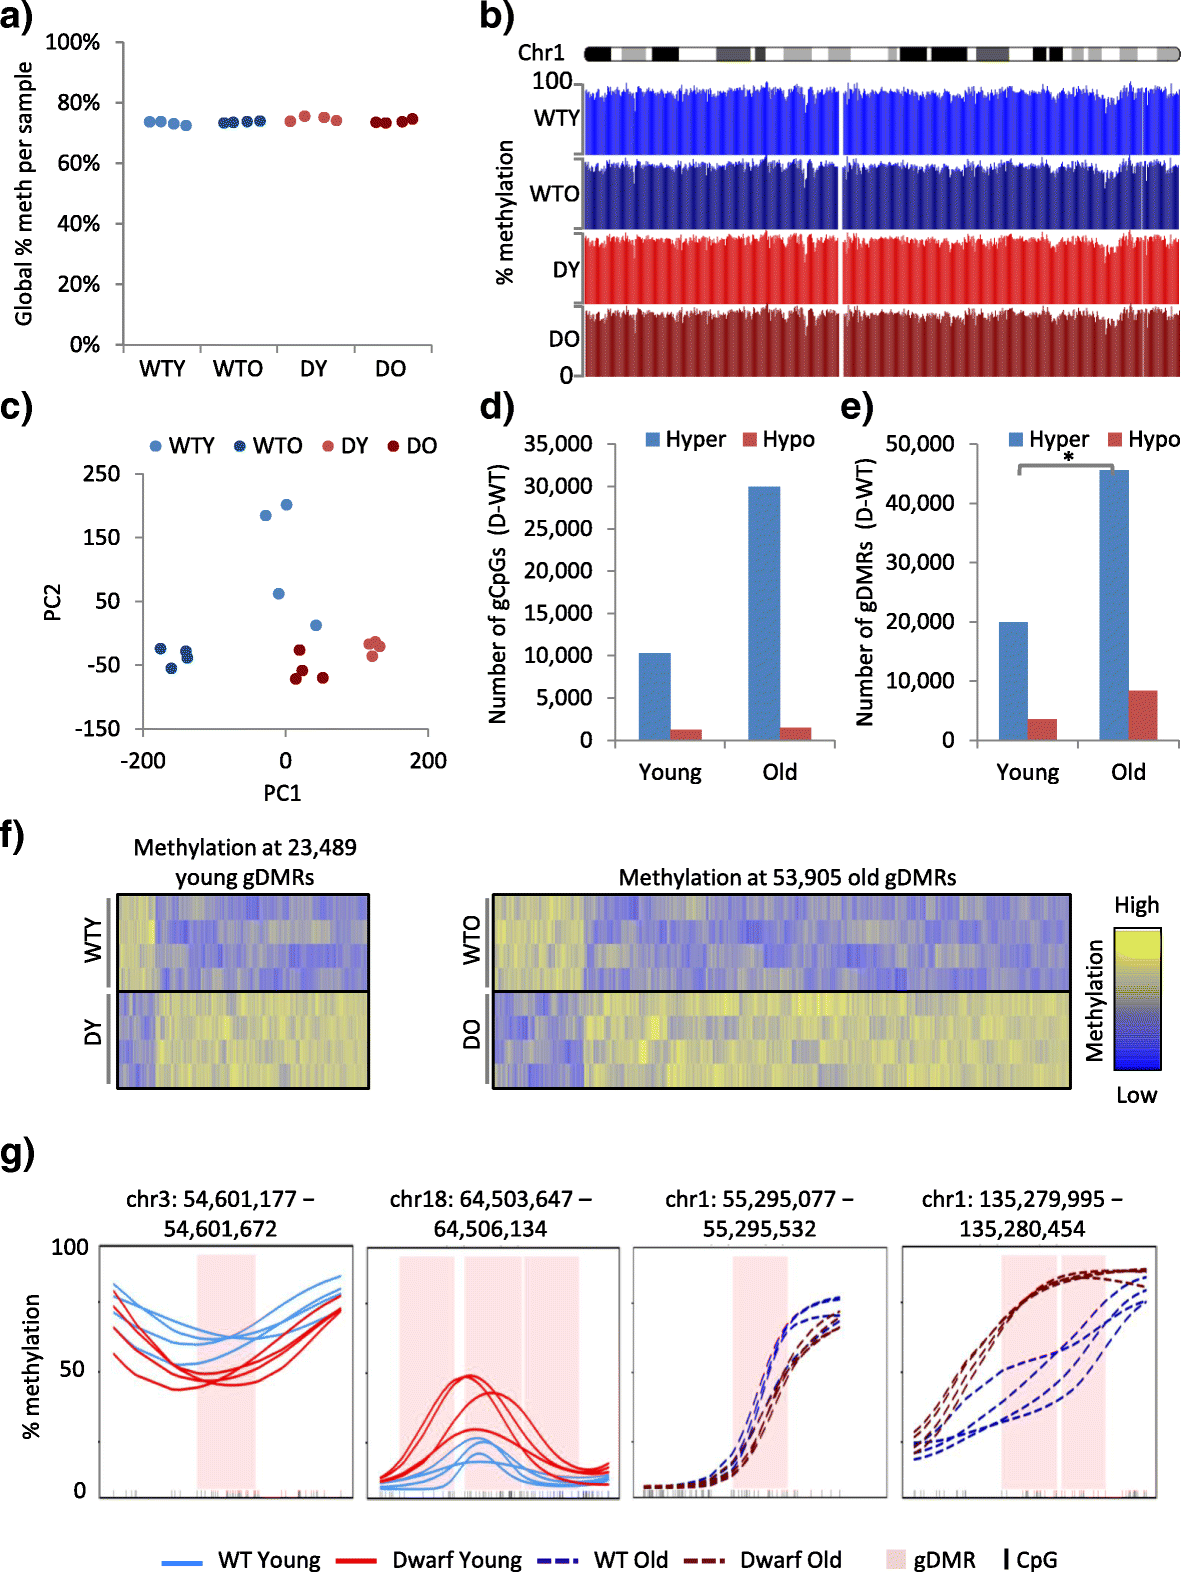
Fig. 1
Fig. 1
The epigenomes of wild-type and Ames dwarf mice diverge with age. a Global percentage methylation per liver sample, for 2-month-old wild-type (WTY), 22-month-old wild-type (WTO), 2-month-old Ames dwarf (DY) and 22-month-old Ames dwarf (DO) mice. All p > 0.05 (two tailed t-test on arcsine transformed proportions). b UCSC genome browser trace of percentage methylation over chromosome 1, showing pooled WTY (light blue), WTO (dark blue), DY (light red), DO (dark red) replicate tracks. c Principal component analysis of CpG percentage methylation, for WTY (light blue), WTO (dark blue), DY (light red) and DO (dark red) liver samples. Principal component (PC)1 proportion of variance = 12.38%, and PC2 proportion of variance = 7.64%. d The number of significantly differentially methylated CpGs (5% FDR, Fisher’s exact test) between four pooled WT and four pooled Ames dwarf replicates (gCpGs) in liver of 2-month-old (young) and 22-month-old (old) mice. Hyper- and hypomethylated gCpGs are higher and lower in Ames dwarf mice, respectively. e As d but showing significantly differentially methylated regions (gDMRs; 5% FDR, Fisher’s exact test, 500-bp windows). Regions of heterogeneity (chi-squared test <0.05) across the four replicates in each cohort were removed. DY-WTY versus DO-WTO hypermethylation, p < 0.05 (marked with an asterisk). See also Additional file 3: Table S1e. f The percentage methylation across all 2-month-old (left) and 22-month-old (right) gDMRs. Replicate samples (four mouse livers) are in rows and the gDMRs in columns. The intensity of the heatmap represents column scaled percentage methylation (Z-score), with values ranging from lower to higher methylation shown as blue to yellow. g Kernel smoothed line plots of selected gDMRs, ±5 kb. WTY, DY, WTO and DO replicates are represented by solid blue, solid red, dashed blue and dashed red lines, respectively. DMRs are highlighted in pink and CpGs in black
Fig. 2
Fig. 2
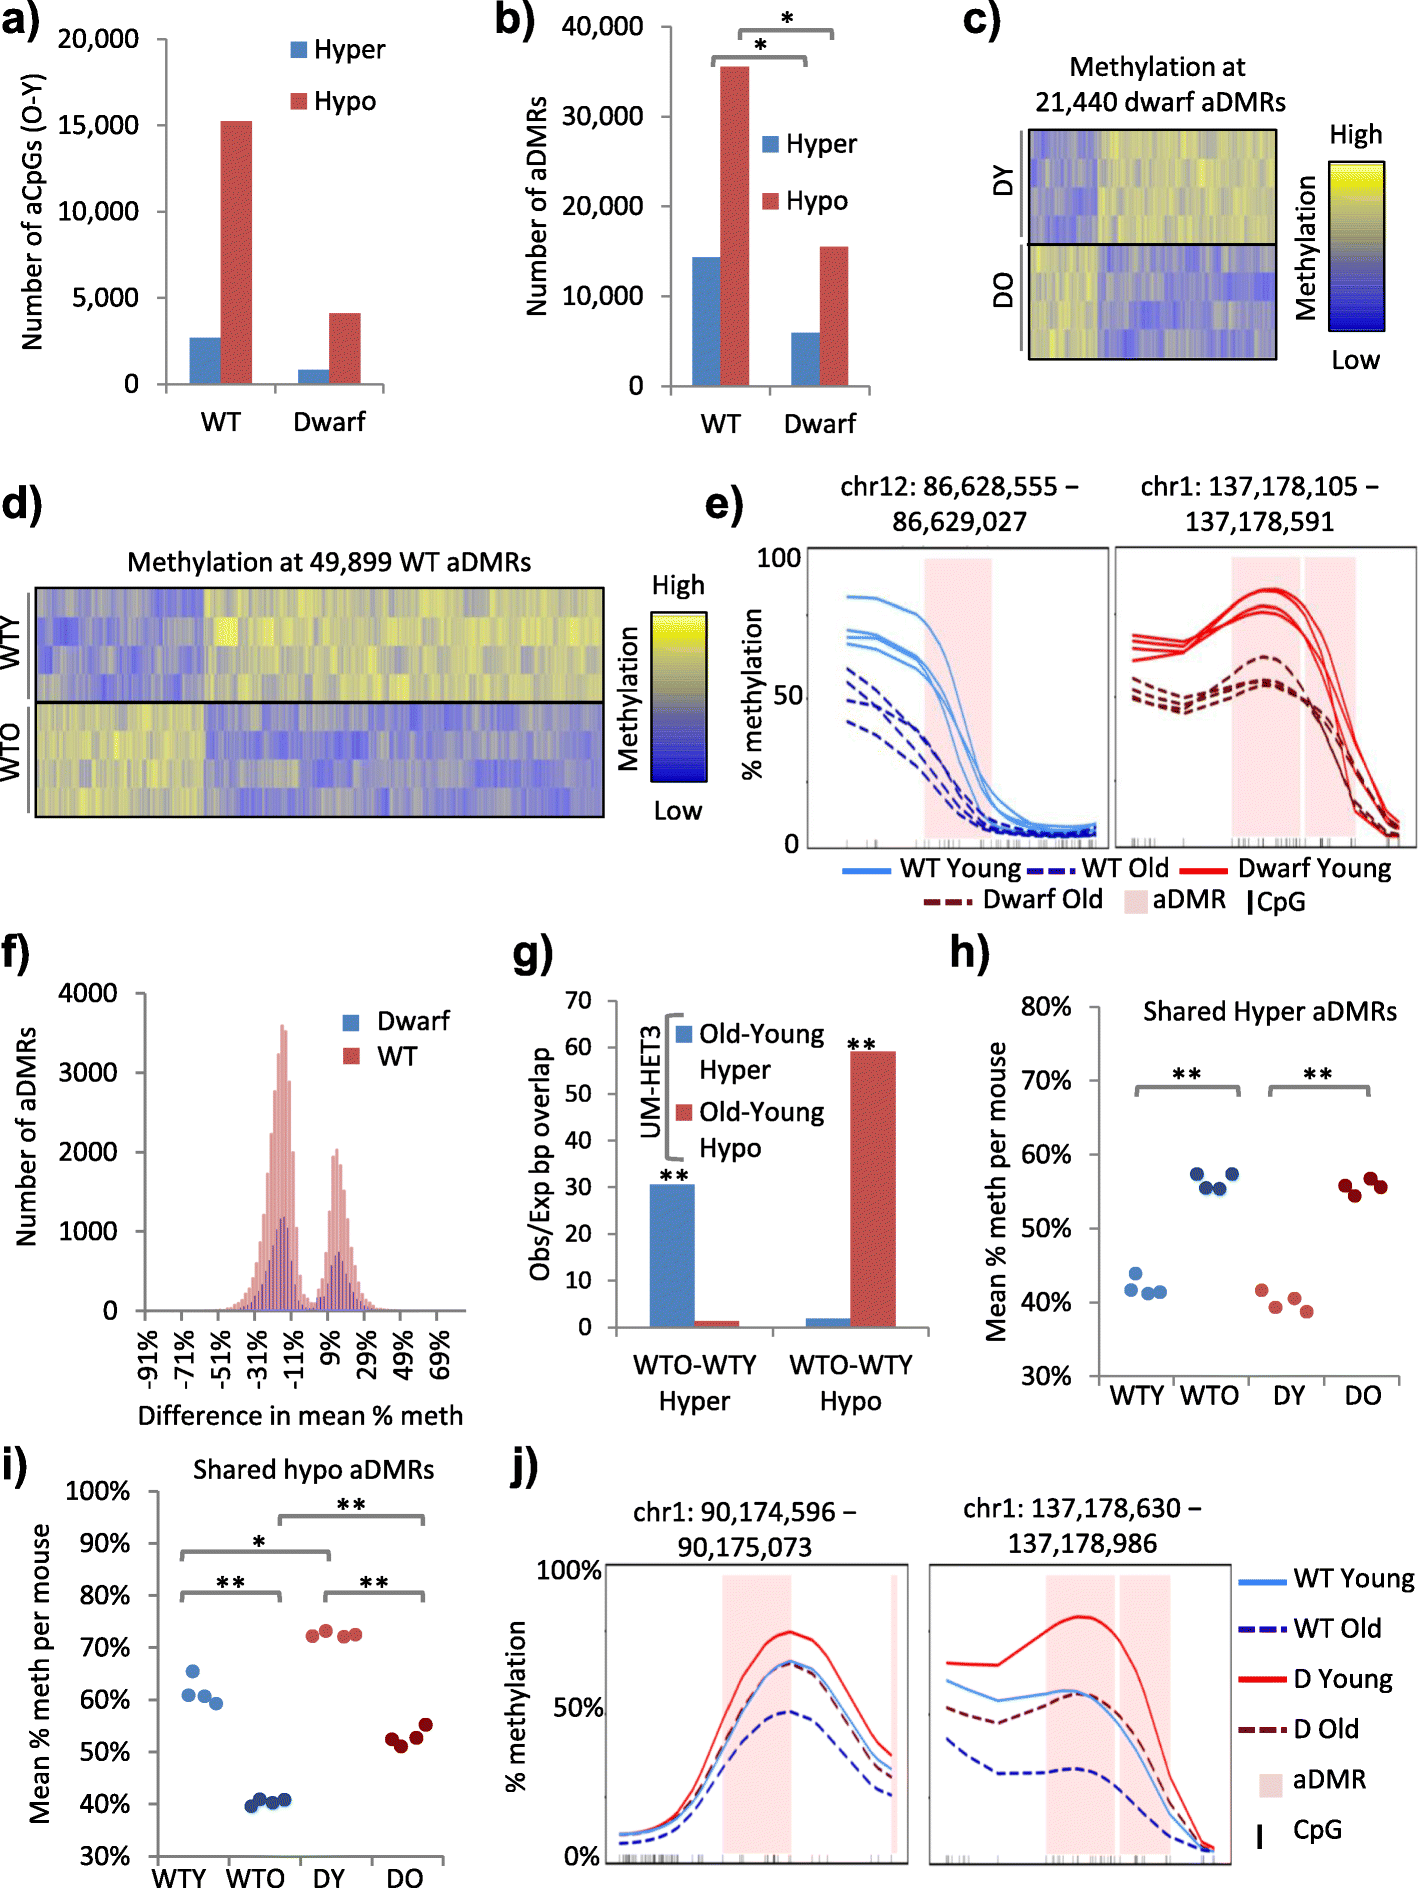
The Ames dwarf epigenome appears more stable and buffered against age-associated hypomethylation. a The number of significantly differentially methylated CpGs (5% FDR, Fisher’s exact test) between 2 and 22-month-old WT (WT) and between 2- and 22-month-old Ames dwarf (Dwarf) mice. Hyper- and hypomethylated aCpGs are higher and lower in 22-month-old mice, respectively. b The number of significantly differentially methylated regions (aDMRs; 5% FDR, Fisher’s exact test, 500-bp windows) between 2- and 22-month-old mice for WT and Ames dwarf mice. Regions of heterogeneity (chi-squared test <0.05) across the four replicates in each cohort were removed. Significance (empirical p value) at p < 0.05 is indicated with an asterisk. See also Additional file 3. c The percentage methylation across all 2- (DY) versus 22-month-old (DO) Ames dwarf differentially methylated regions (aDMRs). Replicate samples (four mouse livers) are in rows and the aDMRs in columns. The intensity of the heatmap represents column scaled percentage methylation (Z-score), with values ranging from lower to higher methylation shown as blue to yellow. d The percentage methylation across all 2- (WTY) versus 22-month-old (WTO) WT differentially methylated regions (aDMRs). Replicate samples (four mouse livers) are in rows and the aDMRs in columns. Columns are scaled using Z-scores. The intensity of the heatmap represents Z-score, with values ranging from negative to positive shown as blue to yellow. e Kernel smoothed line plots of selected aDMRs, ±5 kb. WTY, 2-month-old dwarf (DY), WTO and 22-month-old dwarf (DO) replicates are represented by solid blue, solid red, dashed blue and dashed red lines, respectively. DMRs are highlighted in pink and CpGs in black. f The difference in mean percentage methylation per DMR (across all samples) between 22- and 2-month-old mice versus number of aDMRs. WT aDMRs are shown in red and dwarf aDMRs in blue. g Ratio of observed/expected (random) overlap between WT (from ad) and UM-HET3 aDMRs. Hyper- and hypomethylated aDMRs are higher and lower in old mice, respectively. Significance (empirical p value) at p < 0.001 is indicated with double asterisks. h Mean percentage methylation per replicate across all hypermethylated aDMRs common to both WT and Ames dwarf mice (shared). WTY, WTO, DY and DO mice are shown in light blue, dark blue, light red and dark red, respectively. WTY versus WTO and DY versus DO at p < 0.001 are indicated with double asterisks (two tailed t-test on arcsine transformed proportions). i As h but showing shared hypomethylated aDMRs. WTY versus WTO, DY versus DO, WTO versus DO all p < 0.001 indicated with double asterisks and WTY versus DY p < 0.05 indicated with a single asterisk (two tailed t-test on arcsine transformed proportions). j Kernel smoothed line plots of selected aDMRs common to both WT and dwarf mice, ±5 kb. Pooled replicates for WTY, DY, WTO and DO are represented by solid blue, solid red, dashed blue and dashed red lines, respectively. DMRs are highlighted in pink and CpGs in black
Fig. 3
Fig. 3
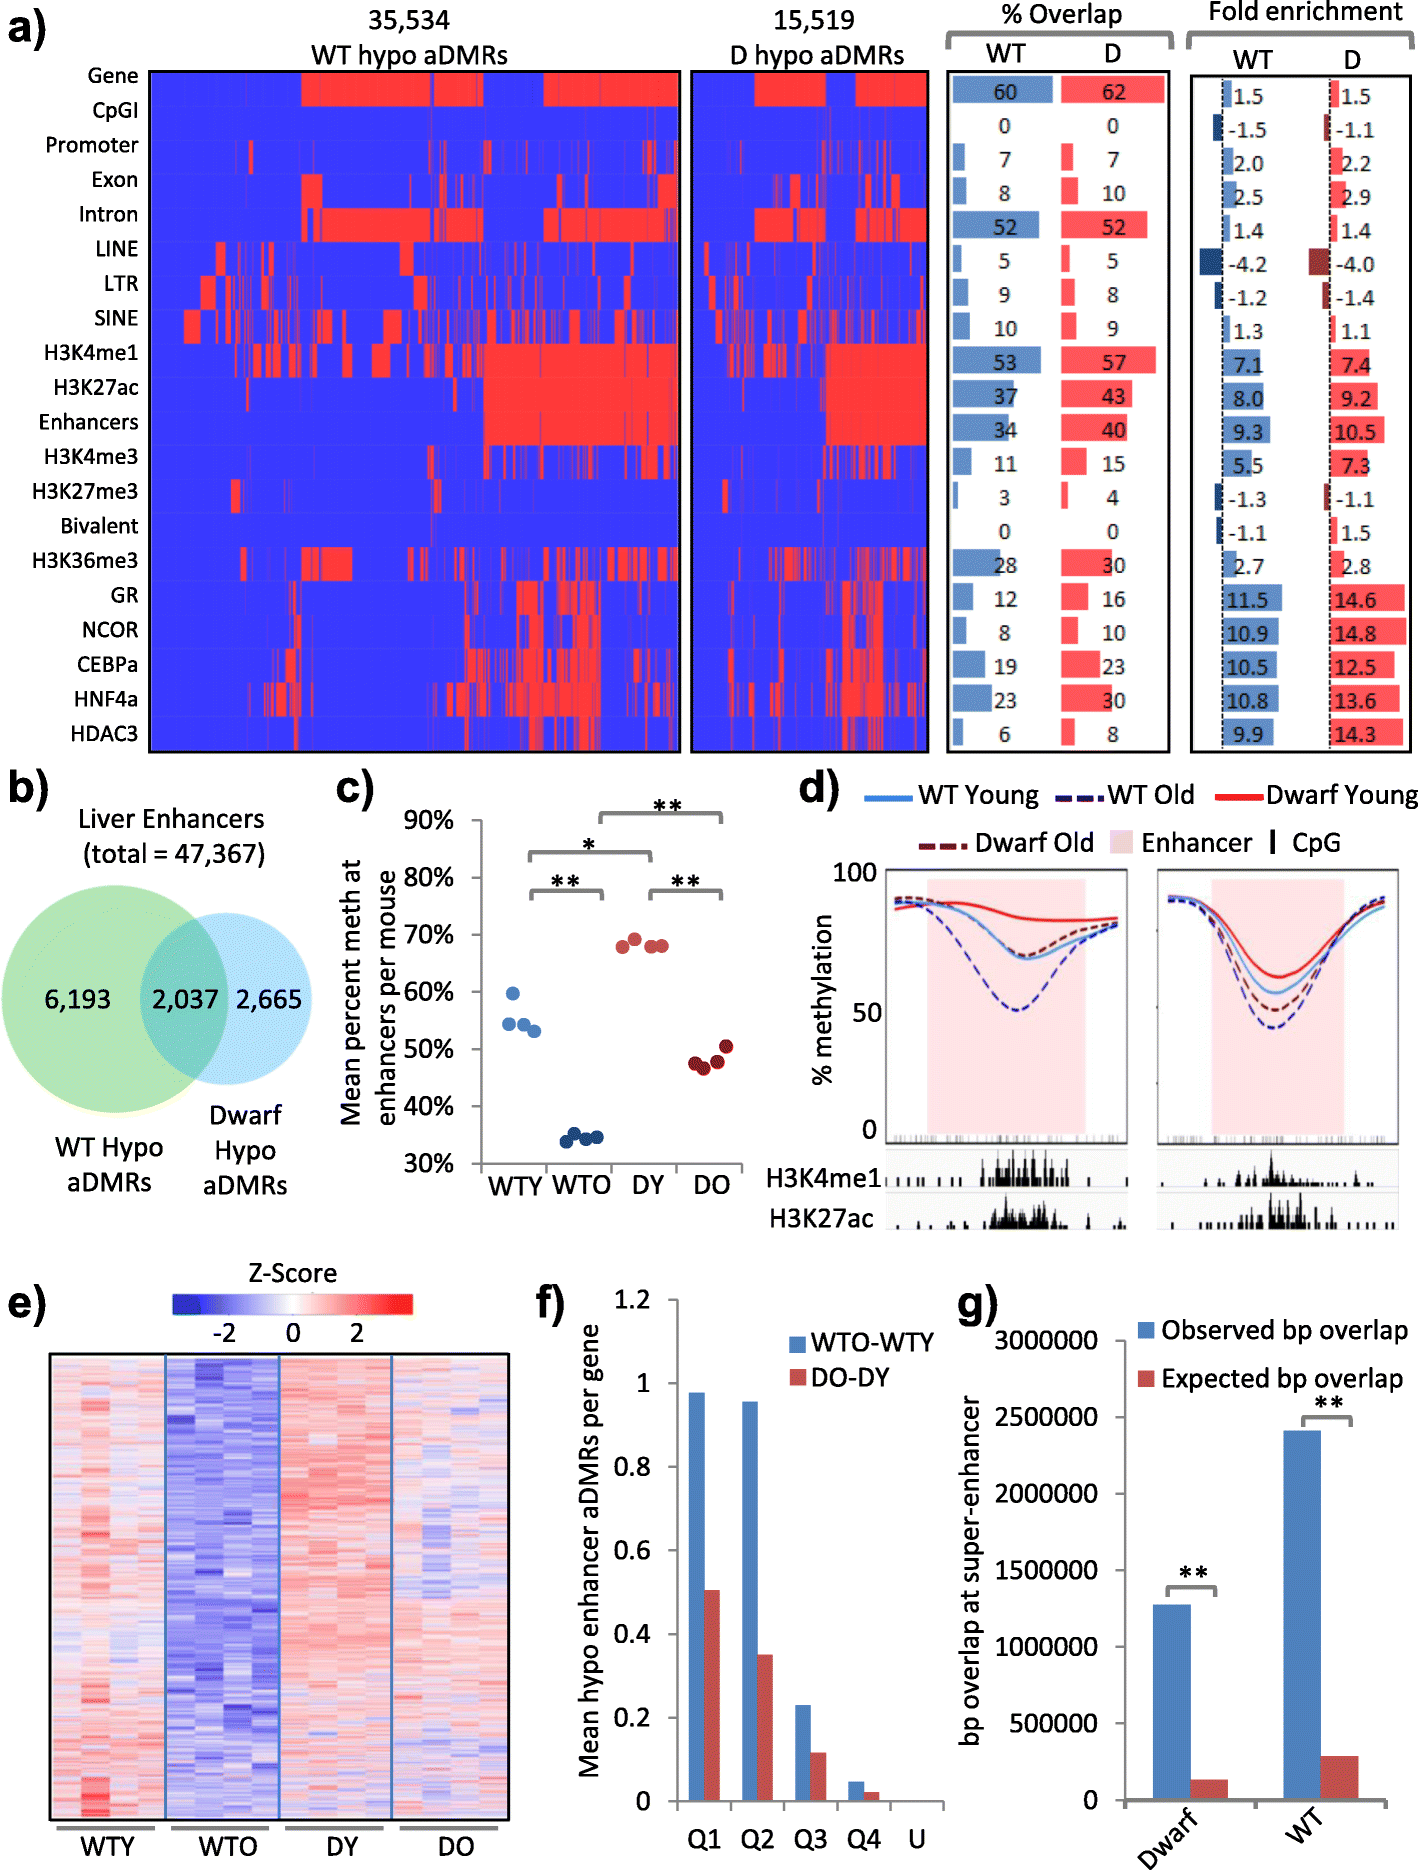
Hypomethylated aDMRs are enriched at intragenic enhancers in highly expressed liver-specific genes. a Clustered feature interaction maps of spatial overlap between hypomethylated aDMRs (columns) and a selection of genomic, histone and transcription factor features (rows), showing WT (WT; left) and dwarf (D; centre left) aDMRs. Red indicates an overlap between an aDMR and a feature and blue no overlap. Interaction map x-axes are scaled by number of aDMRs. The percentage overlap (centre right) and fold enrichment observed/expected (random) overlap (right; units of fold) for each feature are given. b The overlap between enhancers that contain hypomethylated aDMRs in WT and Ames dwarf mice. Enrichment of overlap observed/expected 153-fold, p < 0.001. c Mean percentage methylation per replicate across enhancers that contain hypomethylated aDMRs in both WT and dwarf mice. For 2-month-old WT (WTY; light blue), 22-month-old WT (WTO; dark blue), 2-month-old dwarf (DY; light red) and 22-month-old dwarf (DO; dark red) mice. WTY versus WTO, DY versus DO, WTO versus DO all p < 0.001 (indicated with double asterisks) and WTY versus DY p < 0.05 (indicated with a single asterisk) (two tailed t-test on arcsine transformed proportions). d Kernel smoothed line plots of selected enhancers overlapping hypomethylated aDMRs, ±5 kb. Replicates for WTY, DY, WTO and DO are represented by solid blue, solid red, dashed blue and dashed red lines, respectively. DMRs are highlighted in pink and CpGs in black. H3K4me1 and H3K27ac enrichment (ChIP-seq) is indicated. e The percentage methylation across all enhancers containing hypomethylated aDMRs unique to WT mice (6193 regions from Fig. 3b). Replicate samples (four mouse livers) are in columns and the aDMRs in rows. The intensity of the heatmap represents row scaled percentage methylation (Z-score), with values ranging from lower to higher methylation shown as blue to red. f Mean number of enhancer overlapping hypomethylated aDMRs per gene for WT (blue) and Ames dwarf (red) mice. Genes are split into quartiles by expression (Q1 = highest, Q4 = lowest). Unexpressed genes (FPKM = 0) are given (U). g Observed and expected overlap (in base pairs) of hypomethylated DMRs (WT, WT only; dwarf, dwarf only; shared, shared between WT and dwarf) with super-enhancers; **P < 0.01
Fig. 4
Fig. 4
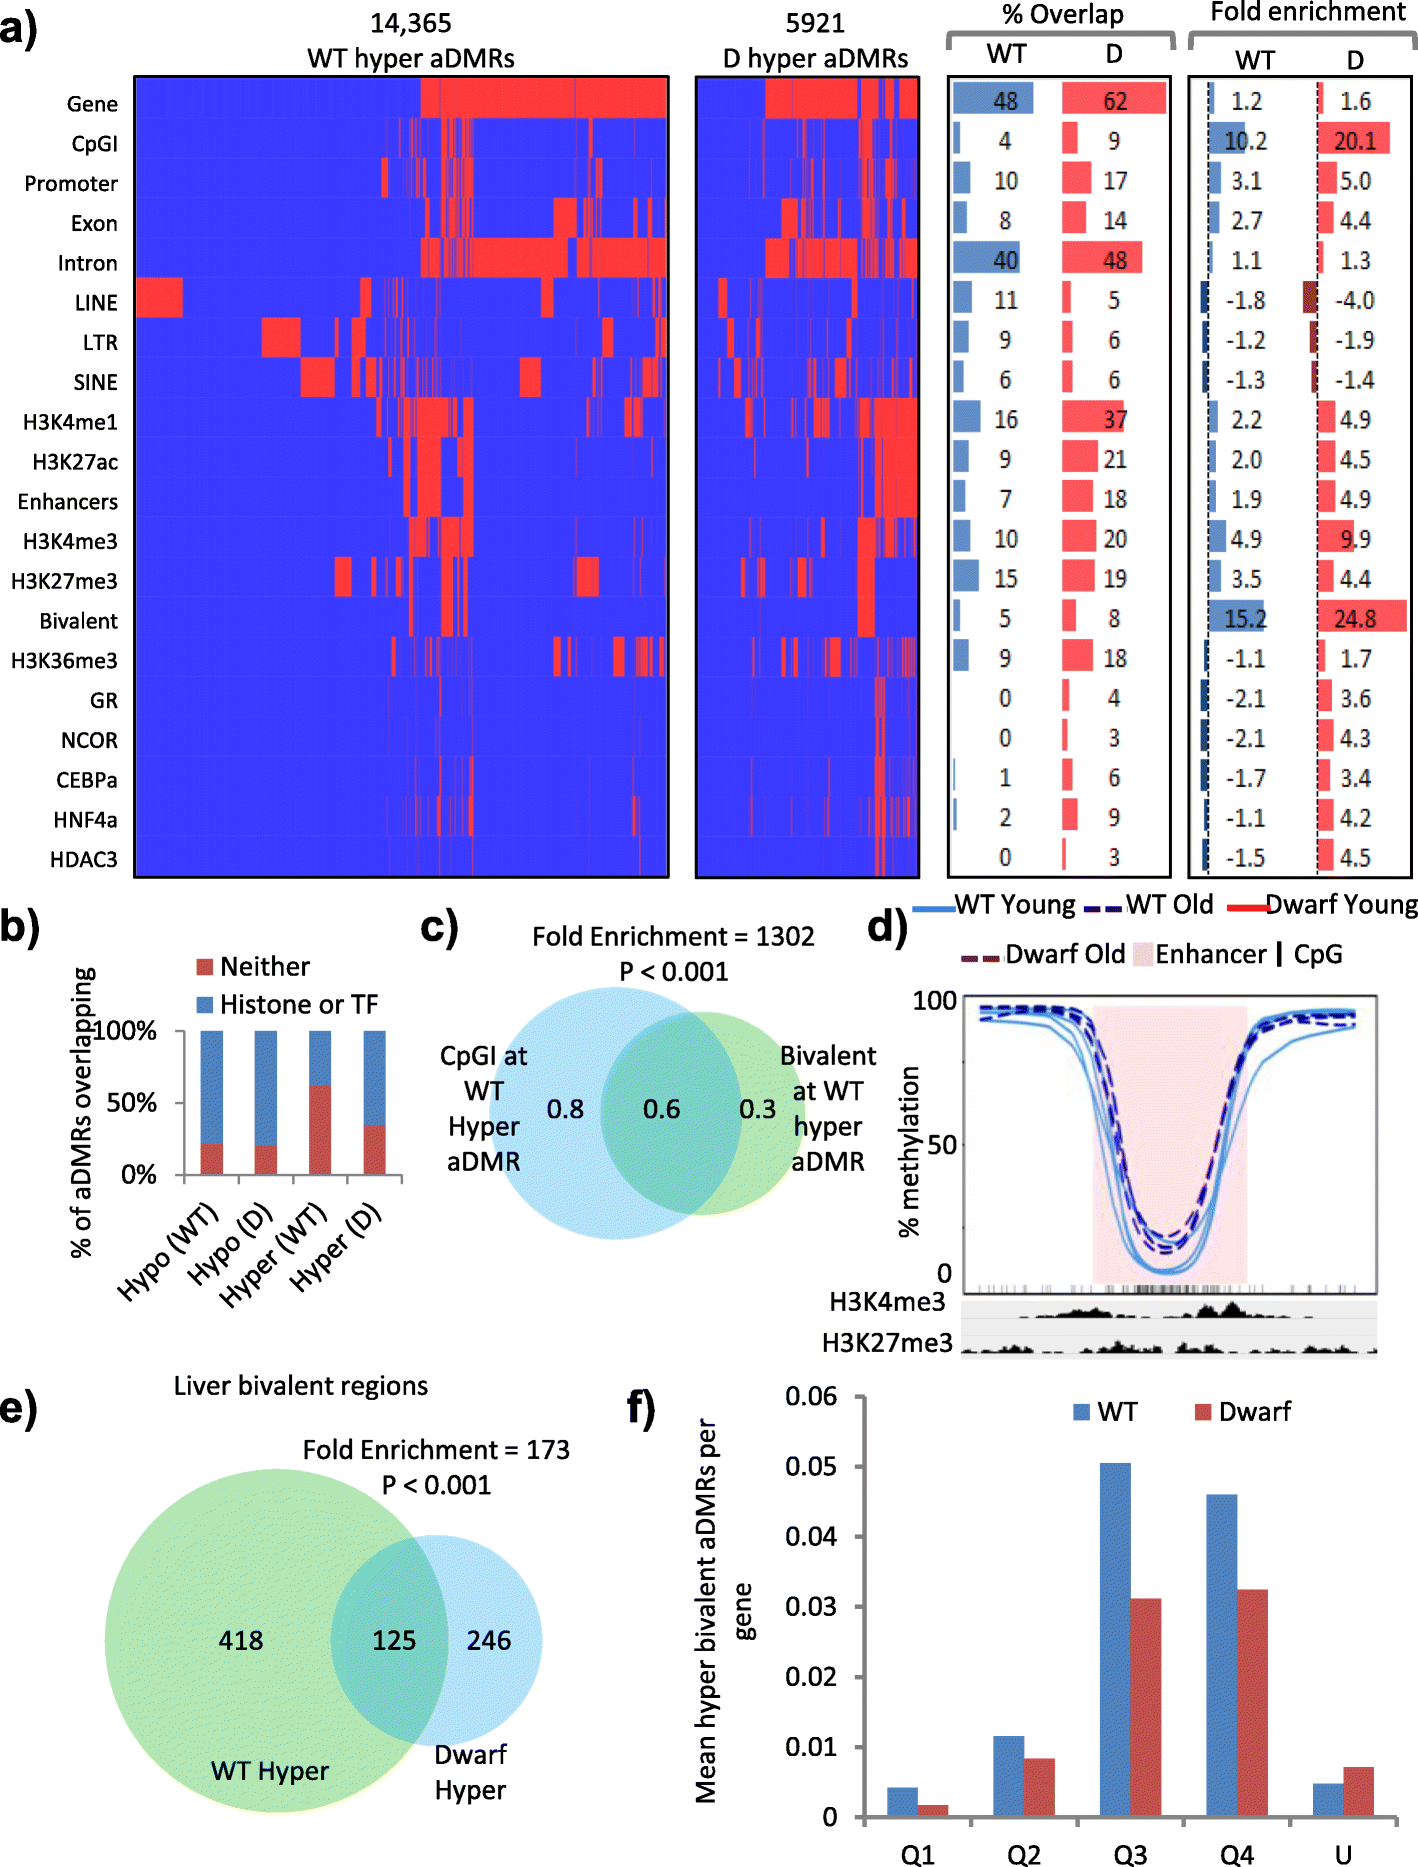
Hypermethylated aDMRs are enriched at bivalent CpG islands. a Clustered feature interaction maps of spatial overlap between hypermethylated aDMRs (columns) and a selection of genomic, histone and transcription factor features (rows), showing WT (WT; left) and dwarf (D; centre left) aDMRs. Red indicates an overlap between an aDMR and a feature and blue no overlap. Interaction map x-axes are scaled by number of aDMRs. The percentage overlap (centre right) and fold enrichment observed/expected (random) overlap (right; units of fold) for each feature is given. b Percentage of WT and Ames dwarf mice aDMRs that overlap with either histone modifications or a panel of 30 transcription factors (Histone or TF; blue) or neither (Neither; red). c The base pair (in mega-base pairs) overlap between hypermethylated aDMR-containing CpG islands and hypermethylated aDMR-containing bivalent regions in WT mice. Enrichment of overlap observed/expected 1302-fold, p < 0.001. d Kernel smoothed line plots of selected bivalent CpG island (CpGI) overlapping hypermethylated aDMRs, ±5 kb. Replicates for 2-month-old WT (WT Young) and 22-month-old WT (WT Old) mice are represented by solid blue and dashed blue lines, respectively. DMRs are highlighted in pink and CpGs in black. H3K4me3 and H3K27me3 enrichment (ChIP-seq) is indicated. e Liver bivalent regions that contain hypermethylated aDMRs in WT and dwarf mice. Enrichment of overlap observed/expected 173-fold, p < 0.001. f Mean number of hypermethylated bivalent aDMRs per gene for WT (blue) and Ames dwarf (red) mice. Genes are split into quartiles by expression (Q1 = highest, Q4 = lowest). Unexpressed genes (FPKM = 0) are given (U)
Fig. 5
Fig. 5
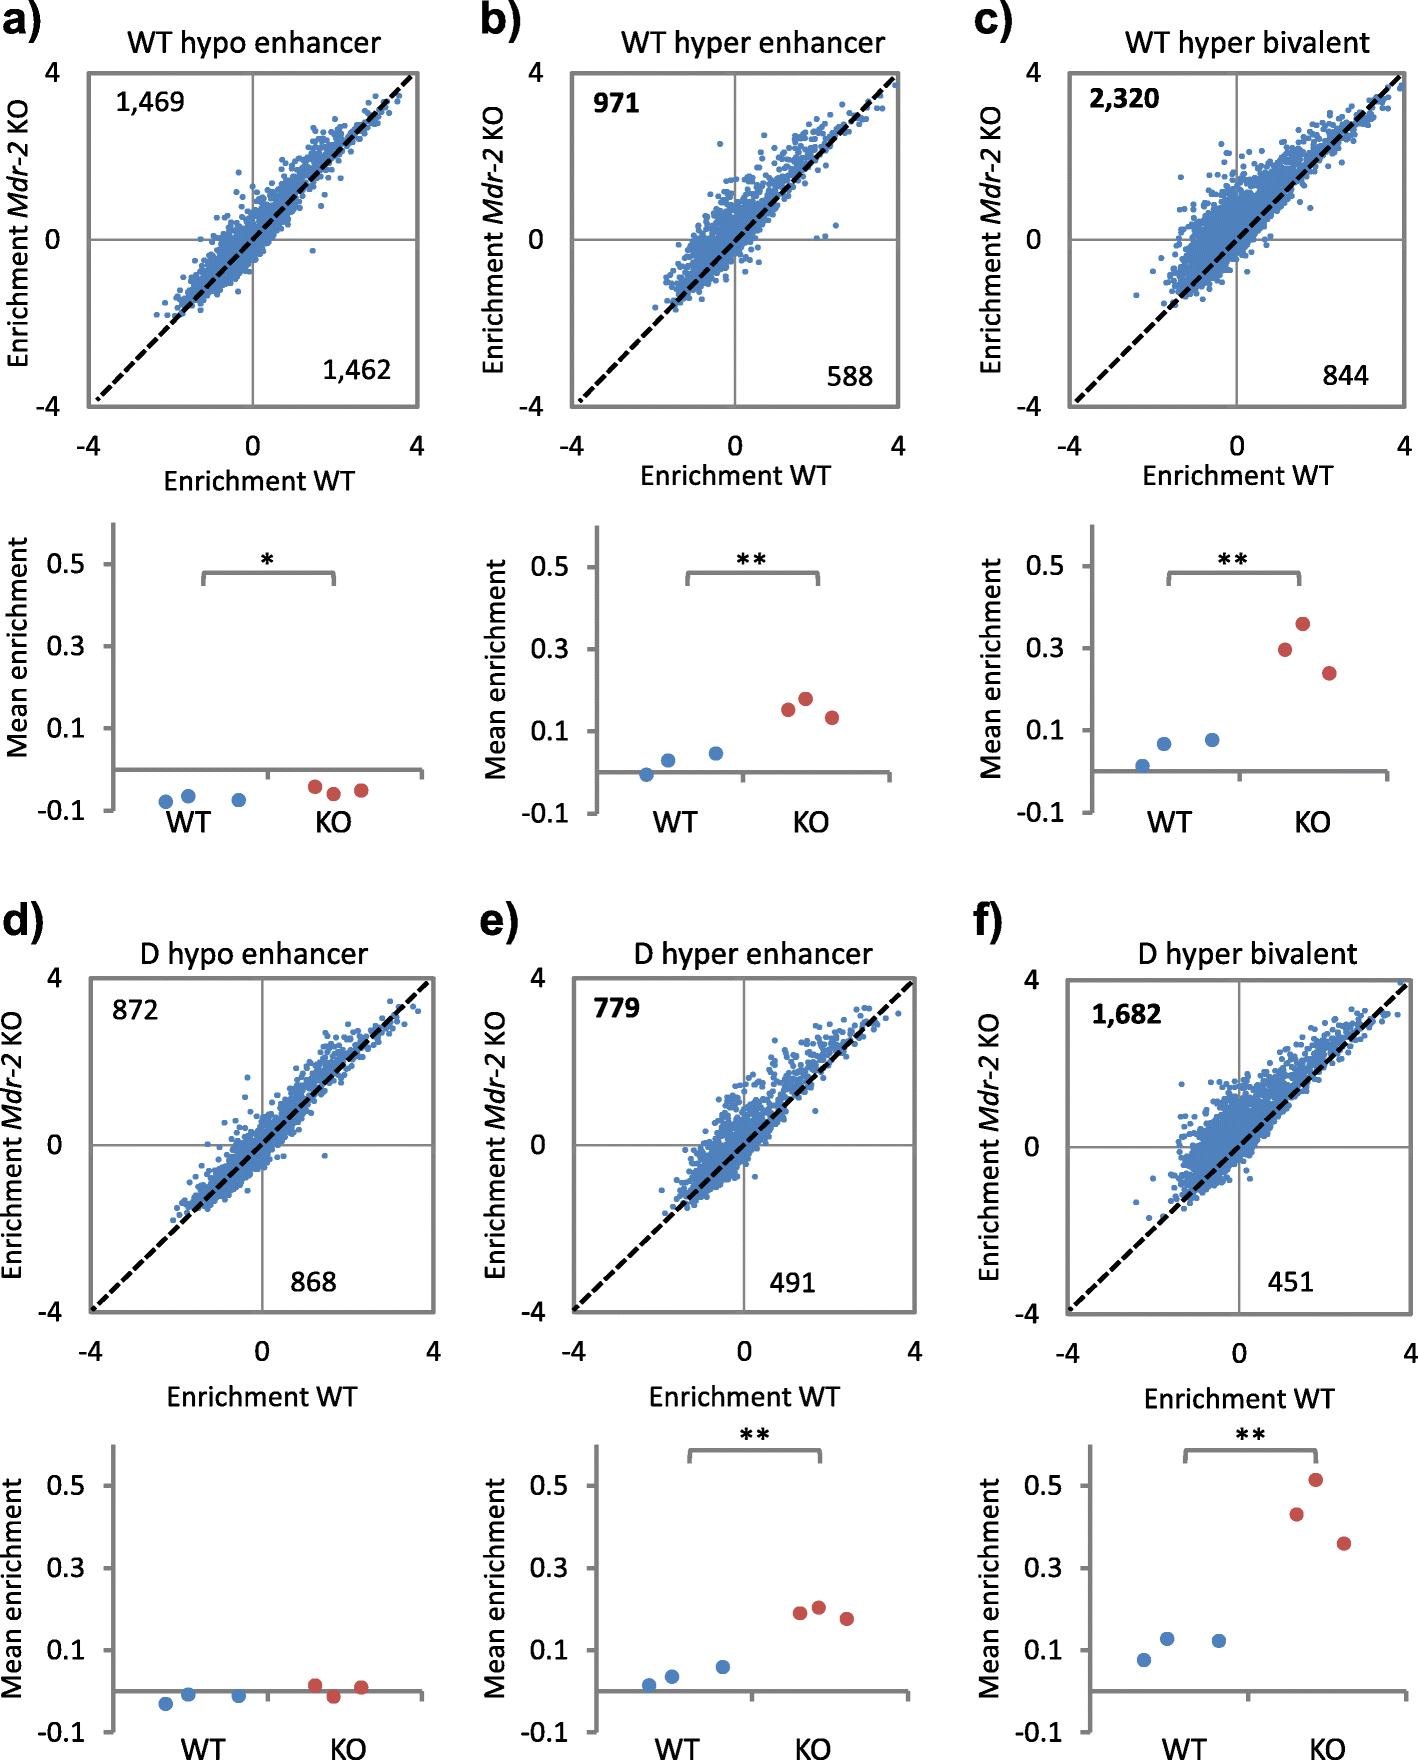
Ames dwarf mice are resistant to cancer-like methylation changes during aging. a Mean methylation enrichment per probe (top panel) at all probes within enhancers that contain WT hypomethylated aDMRs, for control (x-axis) and Mdr-2 knockout (KO; y-axis) mice. Numbers at top left and bottom right show the number of probes above and below the dashed diagonal. The bottom panel shows the same data per mouse replicate. *P < 0.05 (two tailed t-test). b As a but using enhancers containing WT hypermethylated aDMRs. **P < 0.01 (two tailed t-test). c As a but using bivalent regions that contain WT hypermethylated aDMRs. **P < 0.01 (two tailed t-test). d As a but using enhancers that contain Ames dwarf hypomethylated aDMRs. P > 0.05 (two tailed t-test). e As a but using enhancers that contain Ames dwarf hypermethylated aDMRs. **P < 0.01 (two tailed t-test). f As a but using bivalent regions that contain Ames dwarf hypermethylated aDMRs. **P < 0.01 (two tailed t-test)
Fig. 6
Fig. 6
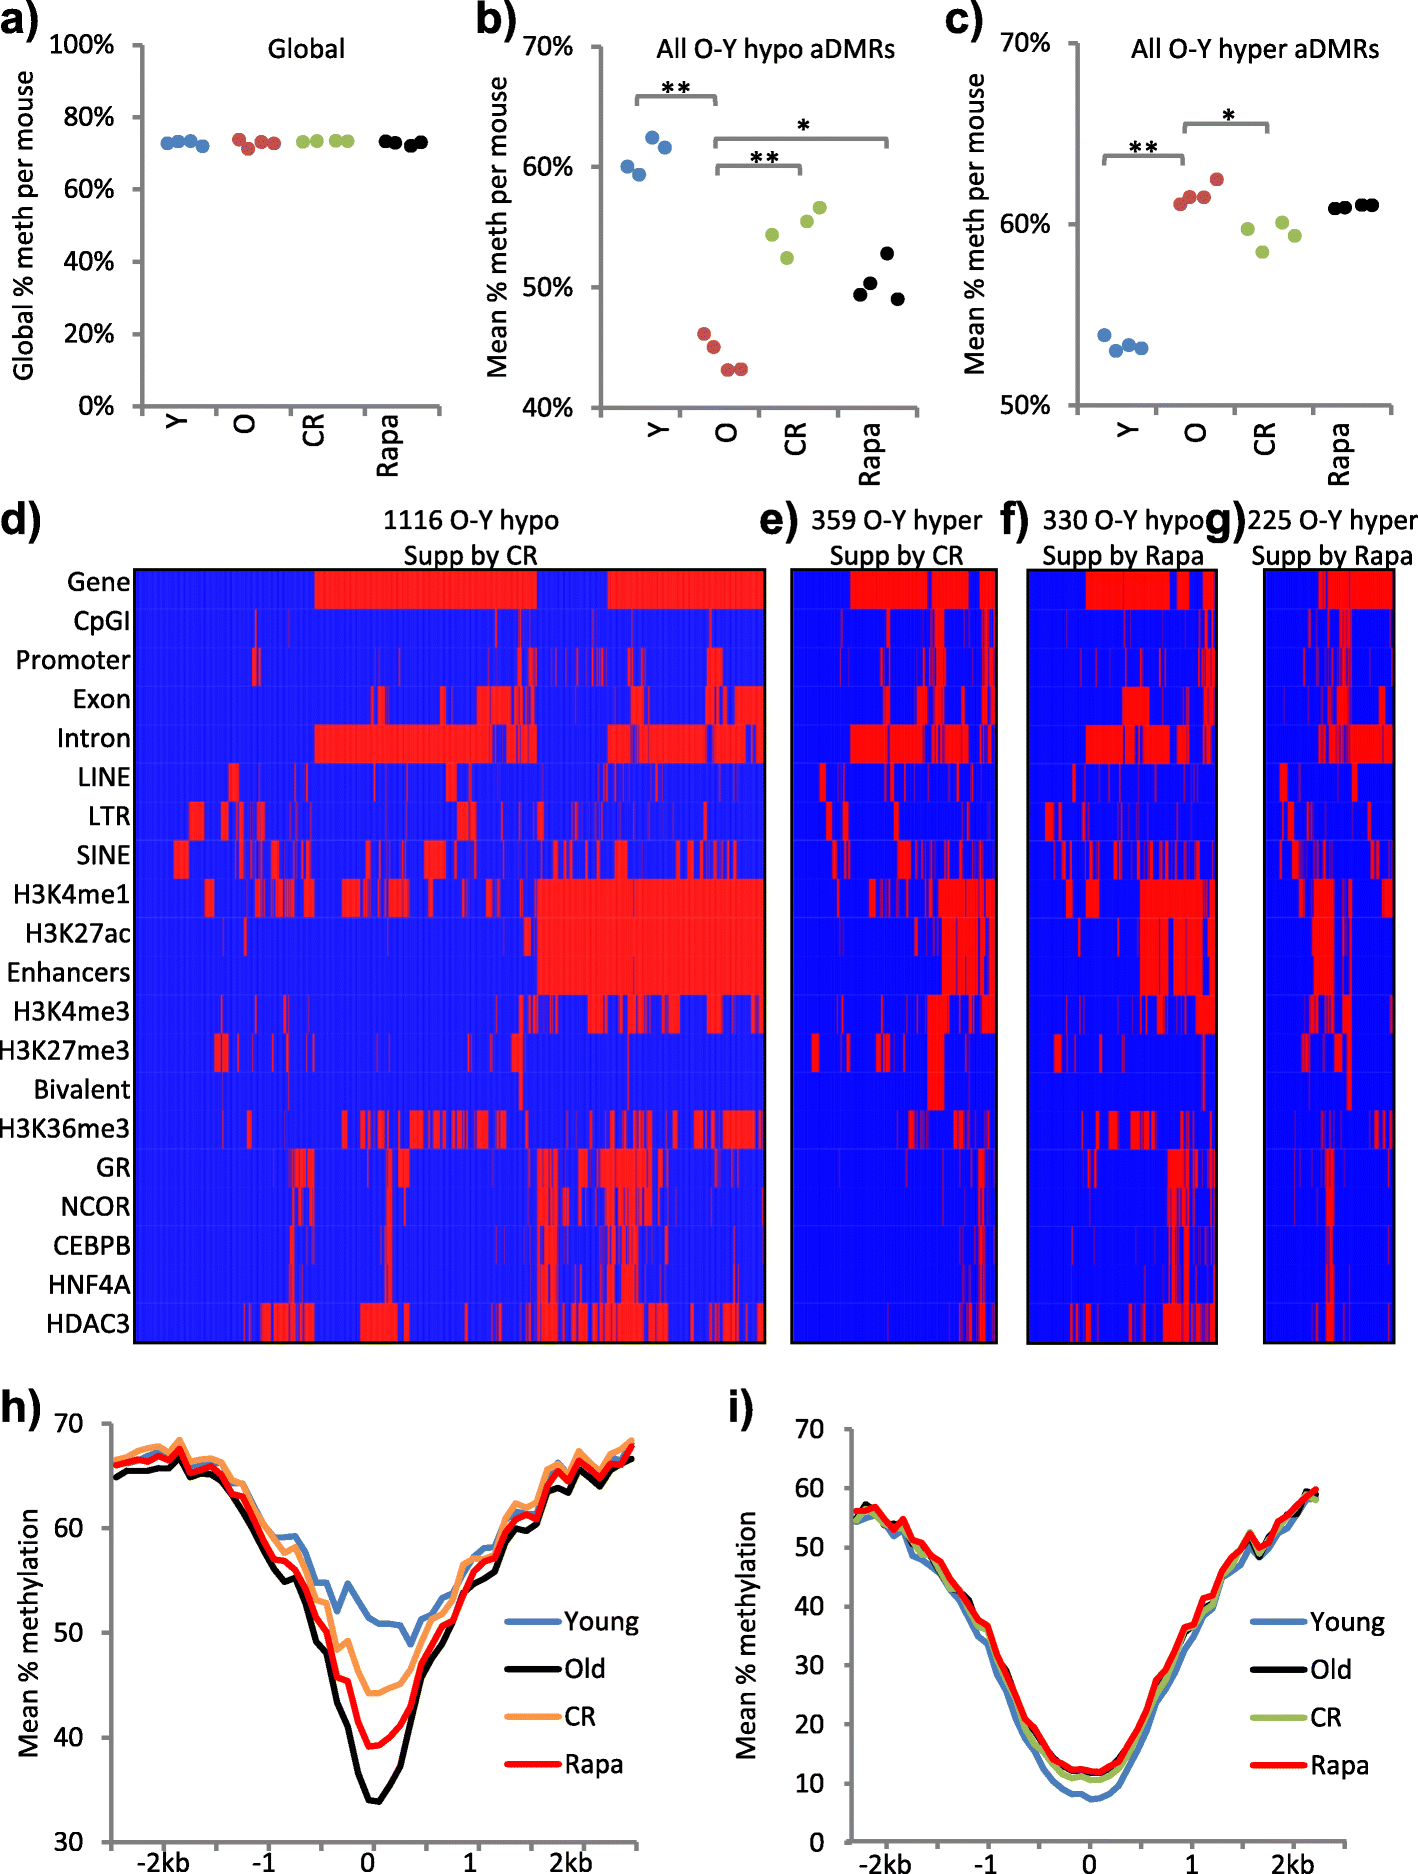
Age-associated DNA methylation changes are also suppressed by calorie restriction and rapamycin. a Global percentage methylation per sample for 2- (Y) and 22-month-old (O) control, 22-month-old caloric restricted (CR) and 22-month-old rapamycin-treated (Rapa) UM-HET3 mice. Part of this panel is reproduced from Additional file 5: Figure S1c. All p > 0.05 (two tailed t-test on arcsine transformed proportions). b Mean percentage methylation per sample across all O-Y hypomethylated aDMRs for the samples in a. **Y versus O, Y versus Rapa, O versus CR, all p < 0.001; *Y versus CR, O versus Rapa, CR versus Rapa, all p < 0.05 (two tailed t-test on arcsine transformed proportions). c Mean percentage methylation per sample across all O-Y hypermethylated aDMRs for the samples in a. **Y versus O, Y versus Rapa, Y versus CR, all p < 0.001; *O versus CR, CR versus Rapa p < 0.05, O versus Rapa p > 0.05 (two tailed t-test on arcsine transformed proportions). d Clustered feature interaction maps of spatial overlap between O-Y aDMRs (columns) and a selection of genomic, histone and transcription factor features (rows), showing hypomethylated aDMRs that are also CR-O hypermethylated DMRs (i.e. suppressed by CR); 1116 regions. e As d for O-Y hypermethylated aDMRs that are also CR-O hypomethylated DMRs (i.e. suppressed by CR); 359 regions. f As d for O-Y hypomethylated aDMRs that are also Rapa-O hypermethylated DMRs (i.e. suppressed by rapamycin); 330 regions. g As d for O-Y hypermethylated aDMRs that are also Rapa-O hypomethylated DMRs (i.e. suppressed by rapamycin); 225 regions. In dg, the interaction map x-axes are scaled by number of aDMRs. h Composite profiles of mean percentage methylation at all hypomethylated aDMR (Old-Young, UM-HET3 mice) enhancer regions (n = 1867), showing young (blue), old (black), CR (orange) and rapamycin-treated (red). i Composite profiles of mean percentage methylation at hypermethylated aDMR (Old-Young) bivalent regions (n = 536), showing young (blue), old (black), CR (green) and rapamycin-treated (red)

References

    1. Brown-Borg HM. The somatotropic axis and longevity in mice. Am J Physiol Endocrinol Metab. 2015;309(6):E503–10. doi: 10.1152/ajpendo.00262.2015. - DOI - PMC - PubMed
    1. Ikeno Y, et al. Delayed occurrence of fatal neoplastic diseases in ames dwarf mice: correlation to extended longevity. J Gerontol A Biol Sci Med Sci. 2003;58(4):291–6. doi: 10.1093/gerona/58.4.B291. - DOI - PubMed
    1. Ikeno Y, et al. Reduced incidence and delayed occurrence of fatal neoplastic diseases in growth hormone receptor/binding protein knockout mice. J Gerontol A Biol Sci Med Sci. 2009;64(5):522–9. doi: 10.1093/gerona/glp017. - DOI - PMC - PubMed
    1. Salmon AB, et al. Fibroblast cell lines from young adult mice of long-lived mutant strains are resistant to multiple forms of stress. Am J Physiol Endocrinol Metab. 2005;289(1):E23–9. doi: 10.1152/ajpendo.00575.2004. - DOI - PubMed
    1. Mercken EM, et al. Of mice and men: the benefits of caloric restriction, exercise, and mimetics. Ageing Res Rev. 2012;11(3):390–8. doi: 10.1016/j.arr.2011.11.005. - DOI - PMC - PubMed

Publication types