. 2017 Mar 28;18(1):56.
doi: 10.1186/s13059-017-1187-1.

Dietary restriction protects from age-associated DNA methylation and induces epigenetic reprogramming of lipid metabolism

Affiliations

Dietary restriction protects from age-associated DNA methylation and induces epigenetic reprogramming of lipid metabolism

Oliver Hahn et al. Genome Biol. .

Abstract

Background: Dietary restriction (DR), a reduction in food intake without malnutrition, increases most aspects of health during aging and extends lifespan in diverse species, including rodents. However, the mechanisms by which DR interacts with the aging process to improve health in old age are poorly understood. DNA methylation could play an important role in mediating the effects of DR because it is sensitive to the effects of nutrition and can affect gene expression memory over time.

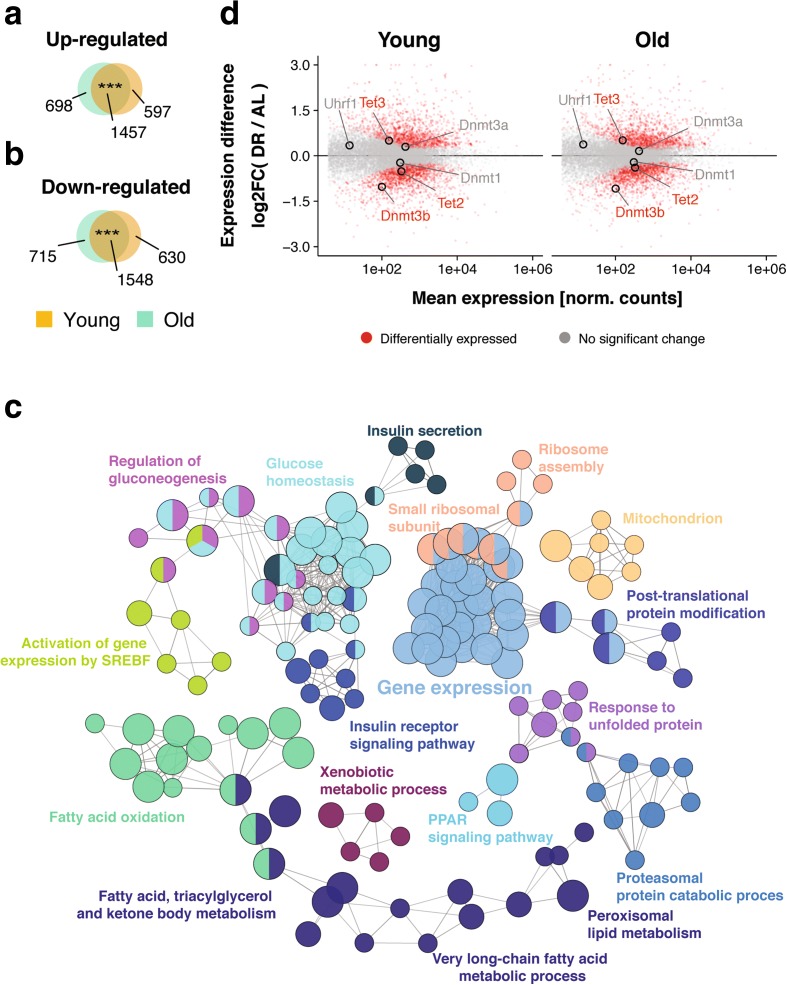
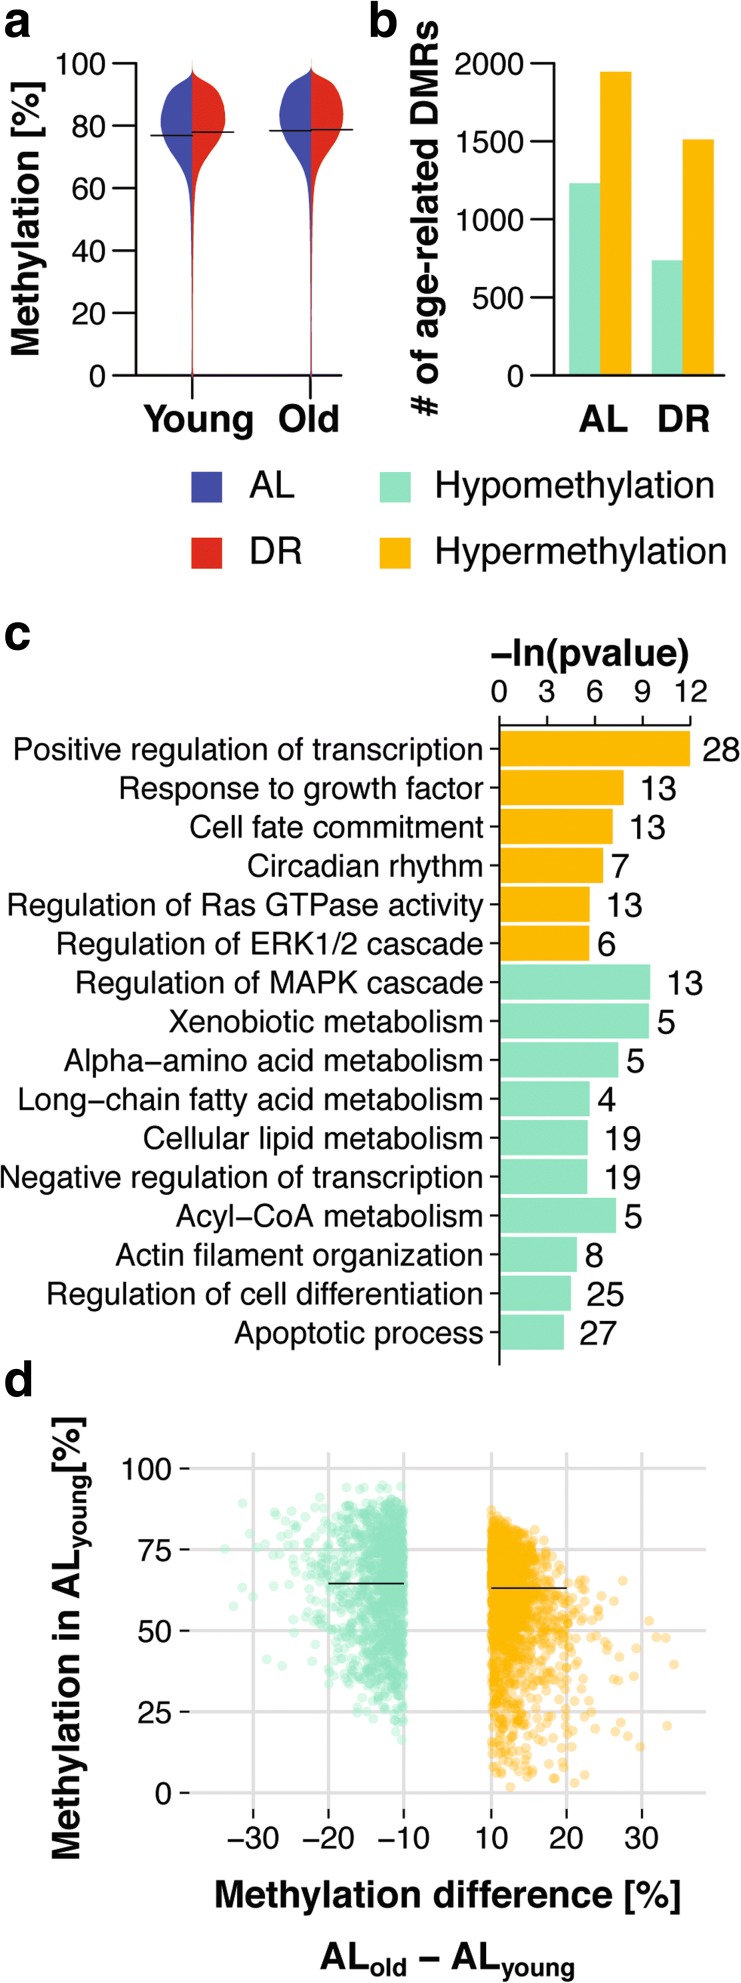
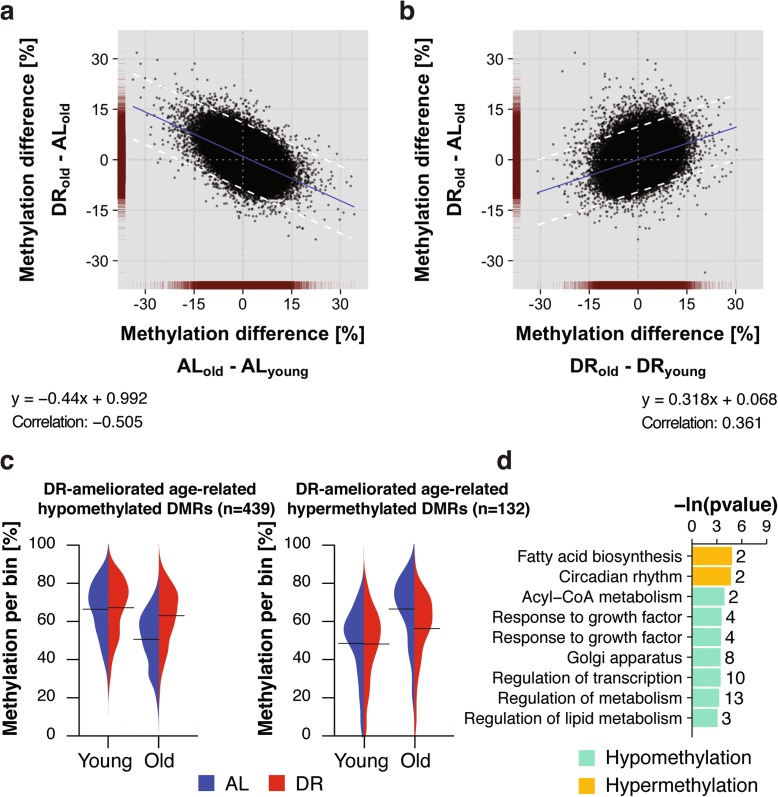
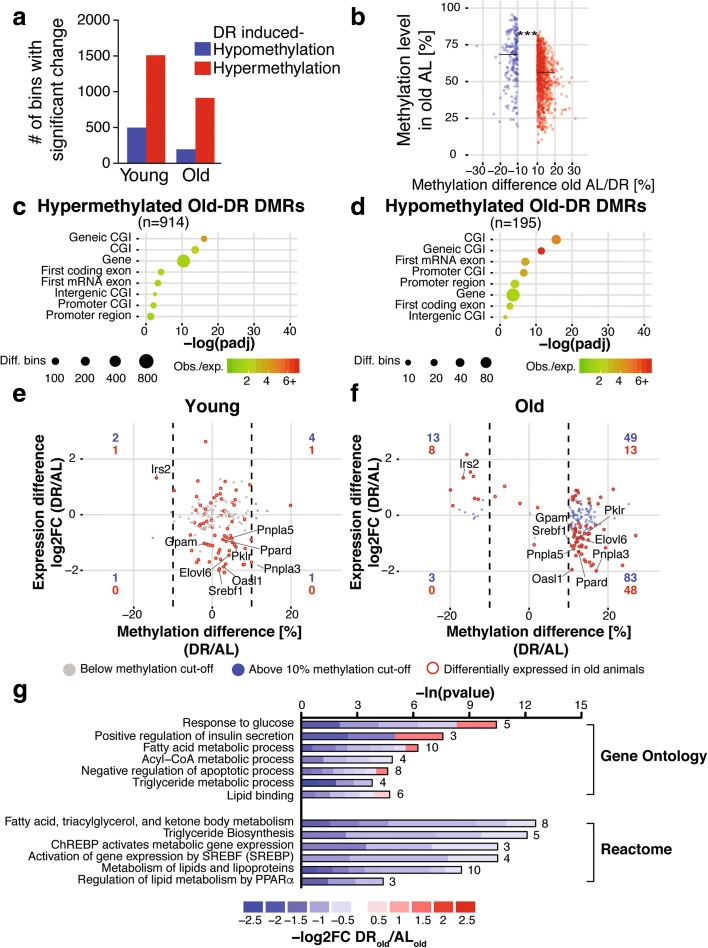
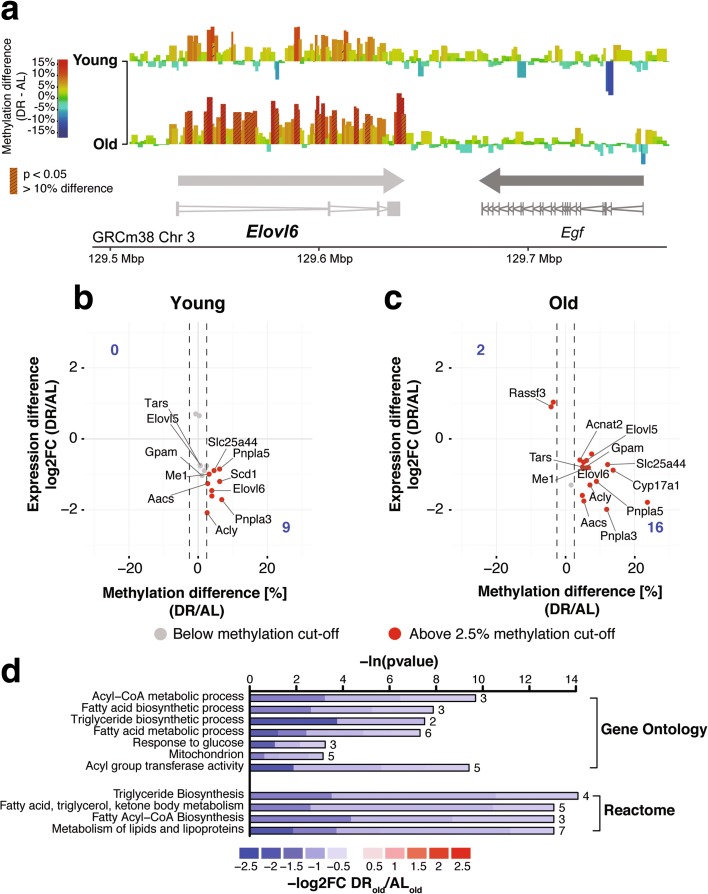
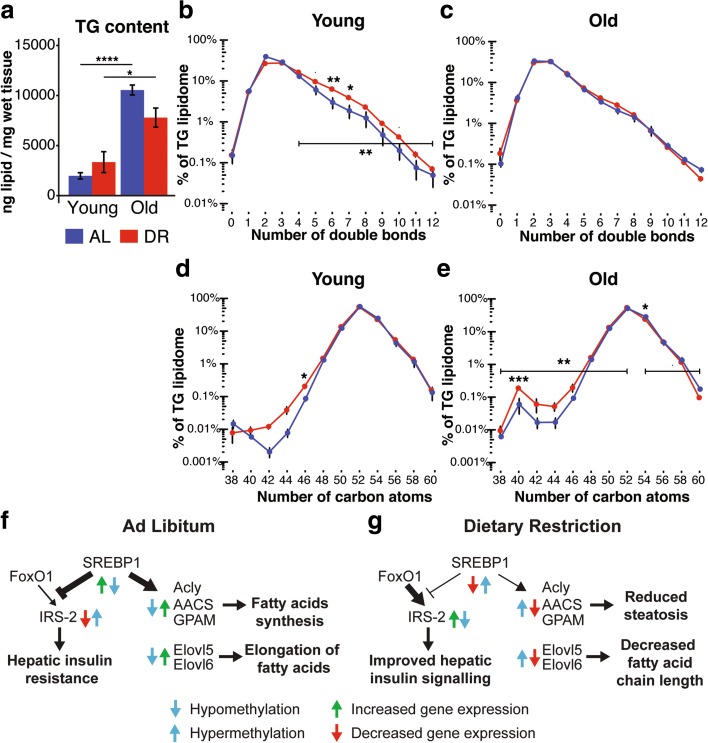
Results: Here, we profile genome-wide changes in DNA methylation, gene expression and lipidomics in response to DR and aging in female mouse liver. DR is generally strongly protective against age-related changes in DNA methylation. During aging with DR, DNA methylation becomes targeted to gene bodies and is associated with reduced gene expression, particularly of genes involved in lipid metabolism. The lipid profile of the livers of DR mice is correspondingly shifted towards lowered triglyceride content and shorter chain length of triglyceride-associated fatty acids, and these effects become more pronounced with age.

Conclusions: Our results indicate that DR remodels genome-wide patterns of DNA methylation so that age-related changes are profoundly delayed, while changes at loci involved in lipid metabolism affect gene expression and the resulting lipid profile.


Figures

Fig. 1
Fig. 1
Transcriptome response to dietary restriction (DR) in the mouse liver. a, b Venn diagrams depicting the overlap of significantly upregulated (a) and downregulated (b) genes under DR relative to the ad libitum-fed (AL) control group at young and old age. *** p < 0.001, one-sided Fisher’s exact test. c Network representation of enriched gene ontology terms and pathways for genes differentially regulated under DR at both ages. Each node (circles) represents one term/pathway. Edges (lines) connect terms with similar gene sets (distance stands in inverse relationship with overlap); further functional clustering (color) was based on kappa statistics. Shown are representative terms per cluster. d MA-plots representing log2-transformed ratios of gene expression levels under DR and AL at both ages versus average expression on a logarithmic scale. Genes showing differential expression between the diets at both ages are marked in red (n = 3005). DNA de/methylation genes are highlighted
Fig. 2
Fig. 2
DNA methylation changes in the aging mouse liver. a Beanplot representation of global DNA methylation levels in the liver of young and old ad libitum-fed (AL) and dietary restriction (DR) mice (n = 1,167,959 bins). Solid lines represent group-wise means; density curves were scaled. b Number of significantly differentially methylated regions (DMRs) (p < 0.05, ±10% < DNA methylation difference) between young and old mice under AL and DR conditions. c Functional enrichment of age-related differentially hyper- and hypomethylated genes. d Density scatter plot of age-related DMRs indicating the magnitude of DNA methylation changes with respect to the methylation level in young AL mice. Lines indicate median of methylation levels for hypo- and hypermethylated DMRs
Fig. 3
Fig. 3
Dietary restriction (DR) attenuated age-related changes in DNA methylation. a, b Scatterplot comparison of bin-wise differences between diets at old age and age-related changes under ad libitum (AL) (a) and DR (b) conditions. Data density (red) is indicated on the axes. Blue line represents the linear regression line. Dashed lines mark the two standard deviations (2*σ) cutoff (±9.68% methylation difference). Formulas for linear regression and Pearson correlation coefficients are indicated. c Beanplot representation of methylation levels of 439 hypomethylated (left panel) and 132 hypermethylated (right panel) age-related differentially methylated regions (DMRs) ameliorated by DR in young and old mouse livers. Solid lines represent group-wise means; density curves are scaled. d Gene ontology and reactome enrichment of genes with age-related DMRs ameliorated by DR
Fig. 4
Fig. 4
DNA methylation changes in the mouse liver in response to dietary restriction (DR). a Number of significantly (p < 0.05) differentially methylated regions (DMRs) (DNA methylation difference > ±10%) between ad libitum-fed (AL) and DR at young and old age. b Density scatter plot indicating the magnitude of DNA methylation changes between diets with respect to the methylation level of old AL animals. Lines indicate median of methylation levels for hypo- and hypermethylated DMRs. Average DNA methylation levels were significantly different between hypo- and hypermethylated Old-DR DMRs. *** p < 0.001, Wilcoxon-rank-sum test. c, d Enrichment analysis of hyper- (c) and hypomethylated (d) Old-DR DMRs over genomic elements. e, f Scatterplot of expression differences versus methylation differences of Old-DR DMRs in young (e) and old (f) animals. Dashed lines indicate DNA methylation cutoff of > ±10%. There was no significant correlation between DNA methylation and gene expression in young animals (Fisher’s test p = 1). In contrast, DNA methylation and gene expression were significantly negatively correlated in old animals (Fisher’s test p <0.001, Pearson correlation −0.387 for all genes; p <0.001, Pearson correlation −0.556 for differentially expressed genes). Number of differentially methylated genes in each quadrant is indicated in blue and red, for all genes and differentially expressed genes, respectively. g Gene ontology and reactome enrichment of genes with a negative correlation of gene expression and methylation. Lengths of bars represent negative log-transformed, adjusted p values using Fisher’s exact enrichment test. Cells indicate log2-fold changes (log2FC) between AL and DR per gene. CGI CpG island
Fig. 5
Fig. 5
Dietary restriction (DR) caused differential whole gene body methylation of lipid metabolism genes. a Differential methylation landscape of the Elovl6 gene locus at young and old age. Bins are represented as bars with color scale and height indicating methylation differences. Hatched bars indicate bins that show significantly different methylation between ad libitum (AL) and DR conditions. Arrows indicate gene orientation; merged mRNA structure is depicted below. b, c Scatterplot of differential expression versus whole gene body methylation differences at young (b) and old age (c). Number of genes per quadrant is denoted in corners; dashed lines indicate methylation difference cutoff of > ±2.5%. Fisher’s exact test indicates a significant (p < 0.032) inverse relationship (Pearson correlation −0.39) at old age but not at young age. d Gene ontology and reactome enrichment of genes with an inverse relationship of whole gene body methylation and differential expression at old age. Lengths of bars represent negative log-transformed, adjusted p values for Fisher’s exact enrichment test. Cells indicate log2-fold changes (log2FC) between AL and DR per gene
Fig. 6
Fig. 6
Lipidome profiling of dietary restriction (DR)-induced changes in triglyceride (TG) acyl chain length and saturation in the mouse liver. a Hepatic TG content of ad libitum-fed (AL) and DR animals at young and old age. There was a significant interaction between diet and age (two-way ANOVA p < 0.05). b-e Distribution of TG species in young (b, d) and old animals (c, e) classified according to the degree of saturation (b, c) and number of carbon atoms (d, e) as proxy for TG-associated fatty acid chain length. Values represent normalized relative abundances (0–100%) on a logarithmic scale. Indicated are p values for pairwise comparisons for each species (Tukey range test) and for specific intervals (paired Wilcoxon-rank-sum test). DR animals showed significantly more TGs with four or more double bonds at young age (b, p = 0.0039; paired Wilcoxon-rank-sum test) and significantly more TGs with 52 or fewer carbons at old age (e, p = 0.0078; paired Wilcoxon-rank-sum test). AL animals showed significantly more TGs with 54 or fewer carbons at old age (e, p = 0.052; paired Wilcoxon-rank-sum test). • p < 0.1, * p < 0.05, ** p < 0.01, *** p < 0.001. Error bars denote means ± SEM. f, g Schematic outline of differential methylation and gene expression in the Sreb1f (SREBP1) network under AL (f) and DR (g) conditions

References

    1. López-Otín C, Blasco MA, Partridge L, Serrano M, Kroemer G. The hallmarks of aging. Cell. 2013;153:1194–217. doi: 10.1016/j.cell.2013.05.039. - DOI - PMC - PubMed
    1. Longo VD, Antebi A, Bartke A, Barzilai N, Brown-Borg HM, Caruso C, et al. Interventions to slow aging in humans: are we ready? Aging Cell. 2015;14:497–510. doi: 10.1111/acel.12338. - DOI - PMC - PubMed
    1. Weindruch R, Walford RL, Fligiel S, Guthrie D. The retardation of aging in mice by dietary restriction: longevity, cancer, immunity and lifetime energy intake. J Nutr. 1986;116(4):641–54. - PubMed
    1. López-Otín C, Galluzzi L, Freije JMP, Madeo F, Kroemer G. Metabolic control of longevity. Cell. 2016;166:802–21. doi: 10.1016/j.cell.2016.07.031. - DOI - PubMed
    1. Fontana L, Partridge L, Longo VD. Extending healthy life span--from yeast to humans. Science. 2010;328:321–6. doi: 10.1126/science.1172539. - DOI - PMC - PubMed

Publication types