. 2018 Mar:22:29-35.
doi: 10.1016/j.epidem.2017.02.012. Epub 2017 Feb 24.

A simple approach to measure transmissibility and forecast incidence

Affiliations

A simple approach to measure transmissibility and forecast incidence

Pierre Nouvellet et al. Epidemics. 2018 Mar.

Abstract

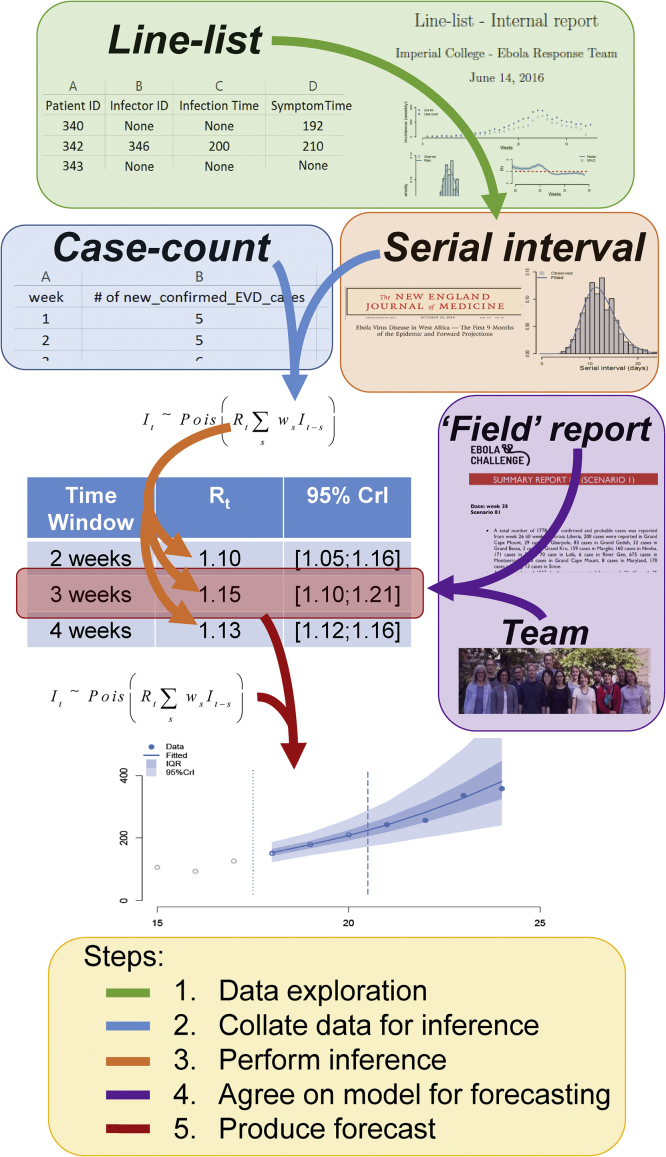
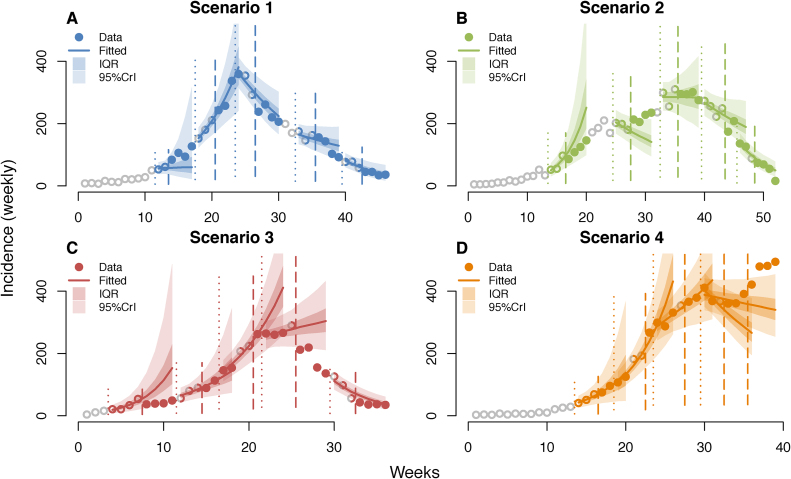
Outbreaks of novel pathogens such as SARS, pandemic influenza and Ebola require substantial investments in reactive interventions, with consequent implementation plans sometimes revised on a weekly basis. Therefore, short-term forecasts of incidence are often of high priority. In light of the recent Ebola epidemic in West Africa, a forecasting exercise was convened by a network of infectious disease modellers. The challenge was to forecast unseen "future" simulated data for four different scenarios at five different time points. In a similar method to that used during the recent Ebola epidemic, we estimated current levels of transmissibility, over variable time-windows chosen in an ad hoc way. Current estimated transmissibility was then used to forecast near-future incidence. We performed well within the challenge and often produced accurate forecasts. A retrospective analysis showed that our subjective method for deciding on the window of time with which to estimate transmissibility often resulted in the optimal choice. However, when near-future trends deviated substantially from exponential patterns, the accuracy of our forecasts was reduced. This exercise highlights the urgent need for infectious disease modellers to develop more robust descriptions of processes - other than the widespread depletion of susceptible individuals - that produce non-exponential patterns of incidence.

Keywords: Branching process; Forecasting; MCMC; Rapid response; Renewal equation.


Figures

Fig. 1
Fig. 1
Schematic of our forecasting process. First the line-list, if present, was used to 1) estimate the serial interval distribution, and 2) gain insight into the drivers of transmission and give us better situational awareness. Then we used the incidence of confirmed cases provided in the case-count and the serial interval distribution (either from the literature or from the line-list) to estimate the instantaneous reproduction number Rt. The estimation relied on the renewal equation and assumed transmissibility to be constant during a chosen time-window (either 2, 3 or 4 weeks). Then based on the ‘field report’ provided, assessment of the line-list (when present), and general trends in past incidence, an Rt estimate was chosen (by choosing a time-window) to be used to predict 4 weeks of future incidence. The same renewal equation was used for forecasting relying on posterior distribution of the estimated Rt.
Fig. 2
Fig. 2
Weekly incidence of confirmed cases for each scenario with forecasts (A-D). Dots represent the observed incidence while the solid lines show the median prediction (shaded envelopes show the interquartile range, IQR, and the 95% credible interval, CrI) at each time-point. Coloured open dots show the observed incidence used for inferring the reproduction numbers between the start (vertical dotted lines) and the end (dashed vertical lines) of the chosen time-windows. Filled coloured dots show the observed incidence in the forecast periods. Weekly observations predicted and subsequently used for inference are shown as solid dots (e.g. in scenario 3, the incidence predicted for the 3rd time-point overlap with incidence used for the 4th time-point forecasts). Grey open dots were not used for inference and never predicted.
Fig. 3
Fig. 3
Sample of information extracted from the line-list to inform our analysis. The example shown refers to the fourth time-point of scenario 1. A. Weekly incidence of confirmed cases from the line-list and the case-count data. B. Serial interval distribution observed and fitted using line-list data. C. Daily estimates of the reproduction number (Rt) (median and 95% CrI) on two-week sliding time-windows. The red horizontal dashed line represents the threshold 1, below which an epidemic is considered under control. D. Median (solid line) delay from onset to hospitalisation (blue curve associated with left y-axis) and proportion of cases in the line-list who were under surveillance prior to infection due to contact tracing activities. The shaded areas show the 95% confidence intervals (CIs). (For interpretation of the references to colour in this figure legend, the reader is referred to the web version of this article.)

Similar articles

Cited by

References

    1. Cauchemez S., Temime L., Guillemot D. Investigating heterogeneity in pneumococcal transmission. J. Am. Stat. Assoc. 2006;101(475):946–958.
    1. 2017. Chikungunya Forecasting.http://www.darpa.mil/news-events/2015-05-27
    1. Chretien J.-P., Riley S., George D.B. Mathematical modeling of the West Africa Ebola epidemic. eLife. 2015;4:e09186. - PMC - PubMed
    1. Cori A., Ferguson N.M., Fraser C., Cauchemez S. A new framework and software to estimate time-Varying reproduction numbers during epidemics. Am. J. Epidemiol. 2013;178(9):1505–1512. - PMC - PubMed
    1. Cori A., Donnelly C.A., Dorigatti I. Key data for outbreak evaluation: building on the Ebola experience. Philos. Trans. R. Soc. B. 2017 (in press) 20160371. - PMC - PubMed

Publication types