. 2017 Aug 1;23(15):4402-4415.
doi: 10.1158/1078-0432.CCR-16-3115. Epub 2017 Mar 28.

Genetic Heterogeneity in Therapy-Naïve Synchronous Primary Breast Cancers and Their Metastases

Affiliations

Genetic Heterogeneity in Therapy-Naïve Synchronous Primary Breast Cancers and Their Metastases

Charlotte K Y Ng et al. Clin Cancer Res. .

Abstract

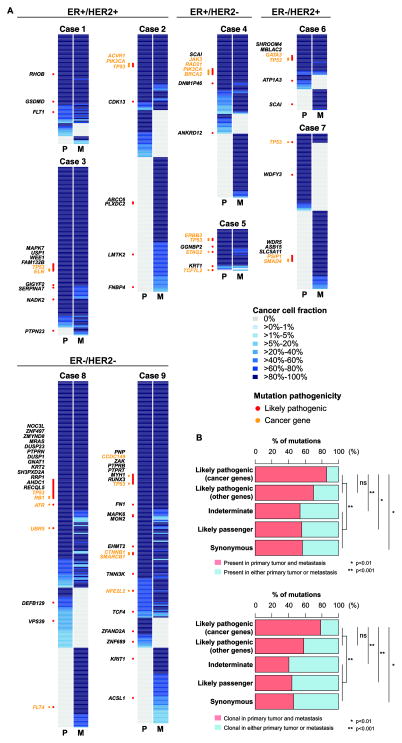
Purpose: Paired primary breast cancers and metachronous metastases after adjuvant treatment are reported to differ in their clonal composition and genetic alterations, but it is unclear whether these differences stem from the selective pressures of the metastatic process, the systemic therapies, or both. We sought to define the repertoire of genetic alterations in breast cancer patients with de novo metastatic disease who had not received local or systemic therapy.Experimental Design: Up to two anatomically distinct core biopsies of primary breast cancers and synchronous distant metastases from nine patients who presented with metastatic disease were subjected to high-depth whole-exome sequencing. Mutations, copy number alterations and their cancer cell fractions, and mutation signatures were defined using state-of-the-art bioinformatics methods. All mutations identified were validated with orthogonal methods.Results: Genomic differences were observed between primary and metastatic deposits, with a median of 60% (range 6%-95%) of shared somatic mutations. Although mutations in known driver genes including TP53, PIK3CA, and GATA3 were preferentially clonal in both sites, primary breast cancers and their synchronous metastases displayed spatial intratumor heterogeneity. Likely pathogenic mutations affecting epithelial-to-mesenchymal transition-related genes, including SMAD4, TCF7L2, and TCF4 (ITF2), were found to be restricted to or enriched in the metastatic lesions. Mutational signatures of trunk mutations differed from those of mutations enriched in the primary tumor or the metastasis in six cases.Conclusions: Synchronous primary breast cancers and metastases differ in their repertoire of somatic genetic alterations even in the absence of systemic therapy. Mutational signature shifts might contribute to spatial intratumor genetic heterogeneity. Clin Cancer Res; 23(15); 4402-15. ©2017 AACR.


Figures

Fig. 1
Fig. 1. Spatial and temporal heterogeneity in primary and metastatic lesions in treatment-naïve synchronous metastatic breast cancer
(A) Barplots depict the number of somatic mutations identified in single frozen biopsies of the primary tumors and metastatic lesions, and for seven patients, the additional mutations identified by analyzing an additional FFPE biopsy of the corresponding tumor. Available biopsy samples are indicated by black dots below the barplots. (B) Venn diagrams illustrate the number of somatic mutations and the number of likely pathogenic mutations (in bold) present in each of the biopsies. Genes affected by likely pathogenic mutations are listed, with those affecting cancer genes (–33) labeled in orange. PFr: frozen biopsy of primary; PFFPE: FFPE biopsy of primary; MFr: frozen biopsy of metastasis; MFFPE: FFPE biopsy of metastasis. FFPE, formalin-fixed paraffin-embedded.
Fig. 2
Fig. 2. Distinct repertoire of somatic genetic alterations in treatment-naïve primary breast cancers and synchronous metastatic deposits
(A) Heatmaps indicate the cancer cell fraction of somatic mutations as determined by ABSOLUTE (24) (blue, see color key) or their absence (grey) in each frozen biopsy. Likely pathogenic mutations are indicated by red dots and the affected genes are shown to the left of the heatmap. Likely pathogenic mutations affecting cancer genes (–33) are further indicated by orange dots and gene names labeled in orange. Cases are grouped according to their ER/HER2 status. P: primary tumor; M: metastatic tumor. (B) Barplots of the distribution of mutations (top) present and (bottom) clonal in frozen biopsies of the paired primary tumors and the metastatic lesions, classified as likely pathogenic (cancer genes), likely pathogenic (other genes), of indeterminate pathogenicity, likely passenger and synonymous mutations from all patients. Comparisons between the groups of mutations of different pathogenicity were performed using Fisher’s exact tests. *: p < 0.01, **: p < 0.001, ns: not significant.
Fig. 3
Fig. 3. Copy number alterations in treatment-naïve primary and synchronous metastatic lesions
(A) Heatmap illustrating the copy number alterations, where samples are presented on the X axis (columns) and chromosomal positions are presented on the Y axis (rows). ER/HER2 status of the tumor samples and sample types are indicated in the phenobar. Dark blue: amplification, light blue: copy number gain; white: neutral; light red: copy number loss; dark red: homozygous deletion. (B) Genome plots of the primary tumor and the distant metastatic lesion for cases 5, 7 and 9. In the genome plots, segmented Log2 ratios (y-axis) were plotted according to their genomic positions (x-axis). Alternating blue and grey demarcate the chromosomes. The amplifications and homozygous deletions restricted to the primary tumors or the distant metastatic lesions are highlighted with red and purple arrows, respectively.
Fig. 4
Fig. 4. Likely pathogenic mutations enriched in the metastases affect epithelial-mesenchymal transition-related genes
(A) Heatmaps indicate the cancer cell fractions of the somatic mutations as defined by ABSOLUTE (24) (blue boxes, see color key) or their absence (grey) in each biopsy. Red dots indicate likely pathogenic mutations and those affecting cancer genes (–33) are indicated by orange dots. Genes affected by likely pathogenic mutations are labeled and those affected by likely pathogenic mutations specific to or enriched in the metastatic lesions, or were associated with the loss of the wild-type allele in the metastatic lesions but not the primary tumors labeled in blue. Phylogenetic trees depicting the evolution of the biopsies were constructed using the maximum parsimony method. The colored branches represent each of the subclones identified, and selected somatic genetic alterations that define a given clone are illustrated along the branches. The length of the branches is representative of the number of somatic mutations and copy number alterations (amplifications and homozygous deletions) that distinguishes a given clone from its ancestral clone. PFr: frozen biopsy of primary; PFFPE: FFPE biopsy of primary; MFr: frozen biopsy of metastasis; MFFPE: FFPE biopsy of metastasis. (B) Venn diagram illustrates an enrichment of genes involved in EMT amongst the likely pathogenic mutations specific to, enriched in the distant metastasis or associated with the loss of the wild-type allele in the distant metastasis in the nine patients using Ingenuity Pathway Analysis. EMT, epithelial-mesenchymal transition.
Fig. 5
Fig. 5. Evolutionary dynamics of somatic mutations and copy number alterations
Barplots illustrate the cancer cell fractions of the somatic mutations (red and light blue bars) and of the copy number alterations (grey bars, excluding amplifications, see Supplementary Methods). Cancer cell fractions of the somatic mutations and the copy number alterations are sorted in increasing order. Bars for somatic mutations are color-coded based on the pathogenicity according to the color key.
Fig. 6
Fig. 6. Evolution of mutational signatures in treatment-naïve patients with de novo synchronous metastatic breast cancer
(A) Heatmaps depicting the mutational signatures that shaped the genomes (15, 36) of the tumor samples analyzed, separately as trunk mutations (yellow), mutations enriched in the primary tumor (green) and mutations enriched in the metastatic lesion (pink). The similarity of each mutational signature to the breast cancer-associated signatures (36) is indicated in blue according to the color key. (B) Barplots illustrating the mutational signatures of the mutations enriched in the primary tumor and the metastatic lesion of Cases 2, 4, 7 and 9. In each panel, the colored barplot illustrates each mutational signature according to the 96 substitution classification defined by the substitution classes (C>A, C>G, C>T, T>A, T>C and T>G bins) and the 5′ and 3′ sequence context, normalized using the observed trinucleotide frequency in the human exome to that in the human genome. The bars are ordered first by mutation class (C>A/G>T, C>G/G>C, C>T/G>A, T>A/A>T, T>C/A>G, T>G/A >C), then by the 5′ flanking base (A, C, G, T) and then by the 3′ flanking base (A, C, G, T). *: >20%.

References

    1. Andre F, Slimane K, Bachelot T, Dunant A, Namer M, Barrelier A, et al. Breast cancer with synchronous metastases: trends in survival during a 14-year period. J Clin Oncol. 2004;22:3302–8. - PubMed
    1. Bernards R, Weinberg RA. A progression puzzle. Nature. 2002;418:823. - PubMed
    1. Klein CA. Selection and adaptation during metastatic cancer progression. Nature. 2013;501:365–72. - PubMed
    1. Yates LR, Gerstung M, Knappskog S, Desmedt C, Gundem G, Van Loo P, et al. Subclonal diversification of primary breast cancer revealed by multiregion sequencing. Nat Med. 2015;21:751–9. - PMC - PubMed
    1. Garcia-Murillas I, Schiavon G, Weigelt B, Ng C, Hrebien S, Cutts RJ, et al. Mutation tracking in circulating tumor DNA predicts relapse in early breast cancer. Sci Transl Med. 2015;7:302ra133. - PubMed

MeSH terms

Substances