. 2017 Apr 11;114(15):4023-4028.
doi: 10.1073/pnas.1616438114. Epub 2017 Mar 28.

Comparing nonpharmaceutical interventions for containing emerging epidemics

Affiliations

Comparing nonpharmaceutical interventions for containing emerging epidemics

Corey M Peak et al. Proc Natl Acad Sci U S A. .

Abstract

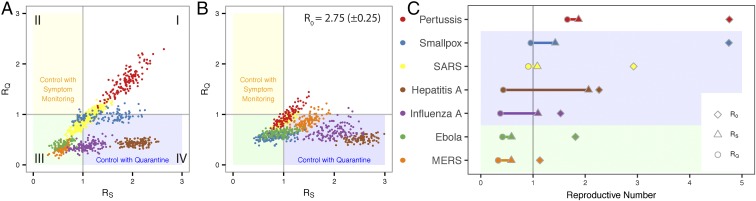
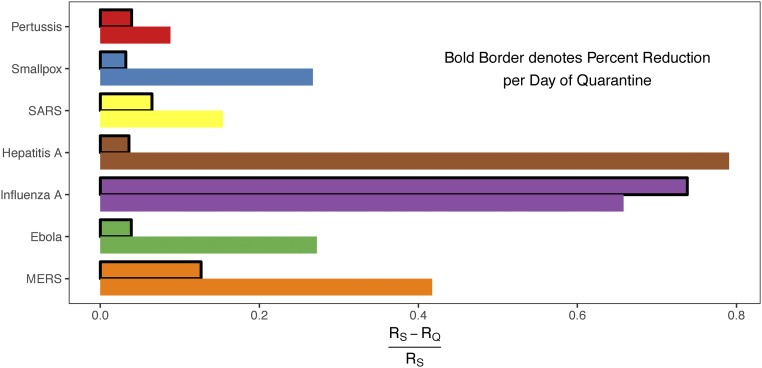
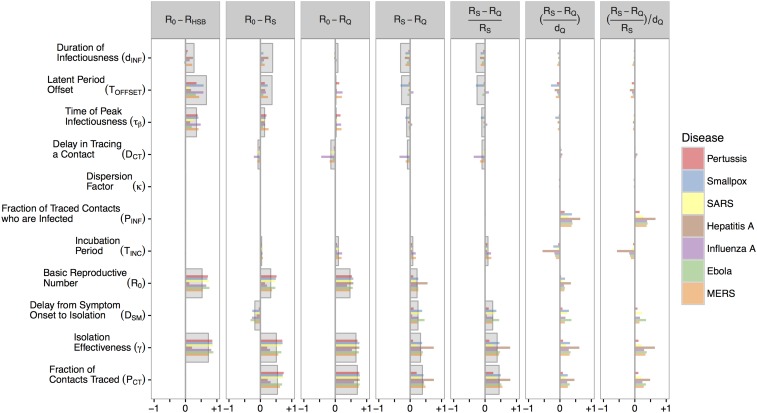
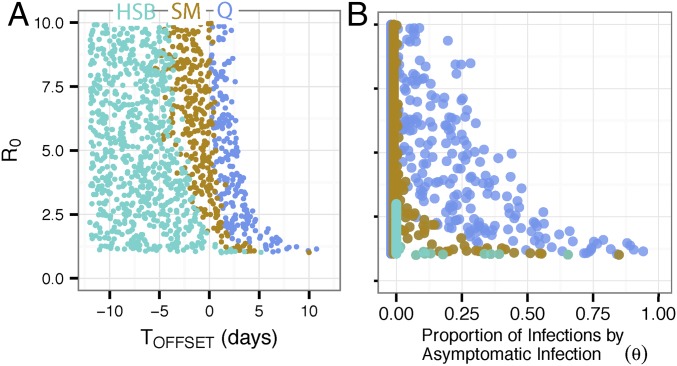
Strategies for containing an emerging infectious disease outbreak must be nonpharmaceutical when drugs or vaccines for the pathogen do not yet exist or are unavailable. The success of these nonpharmaceutical strategies will depend on not only the effectiveness of isolation measures but also the epidemiological characteristics of the infection. However, there is currently no systematic framework to assess the relationship between different containment strategies and the natural history and epidemiological dynamics of the pathogen. Here, we compare the effectiveness of quarantine and symptom monitoring, implemented via contact tracing, in controlling epidemics using an agent-based branching model. We examine the relationship between epidemic containment and the disease dynamics of symptoms and infectiousness for seven case-study diseases with diverse natural histories, including Ebola, influenza A, and severe acute respiratory syndrome (SARS). We show that the comparative effectiveness of symptom monitoring and quarantine depends critically on the natural history of the infectious disease, its inherent transmissibility, and the intervention feasibility in the particular healthcare setting. The benefit of quarantine over symptom monitoring is generally maximized for fast-course diseases, but we show the conditions under which symptom monitoring alone can control certain outbreaks. This quantitative framework can guide policymakers on how best to use nonpharmaceutical interventions and prioritize research during an outbreak of an emerging pathogen.

Keywords: active symptom monitoring; contact tracing; epidemiology; infectious disease dynamics; quarantine.


Conflict of interest statement

The authors declare no conflict of interest.

Figures

Fig. 1.
Fig. 1.
Schematic of the natural history of disease and the timing of interventions. Beginning on the left with the infection event, one progresses through a latent period (TLAT) before becoming infectious for dINF days with late peak infectiousness τβ. For diseases A–C, symptoms are shown to emerge before, concurrent with, and after onset of infectiousness, respectively. We show here an individual who is traced shortly after infection and placed under symptom monitoring or quarantine after a short delay DCT.
Fig. 2.
Fig. 2.
Model dynamics and output for influenza A. (A) Each line designates one model run initiated with 100 infectious individuals in generation 1 and submitted to no intervention (red), health-seeking behavior (teal), symptom monitoring every day (gold), or quarantine (blue) at generation 3. (B) Each point designates the simulated effective reproductive number from one model run with input reproductive number (x axis) between one and five. Loess curves are shown as heavier lines.
Fig. 3.
Fig. 3.
Infection control performance depends on disease biological dynamics and inherent transmissibility (R0). (A) The effective reproductive number under symptom monitoring (x axis) and quarantine (y axis) for 100 simulations of each disease when the basic reproductive number is set to published values (♢ in C). (B) The same as in A, but the basic reproductive number (R0) is set for all diseases to 2.75 (±0.25). (C) Disease-specific mean basic reproductive number (♢) and the mean effective reproductive numbers under symptom monitoring (△) and quarantine (○).
Fig. S1.
Fig. S1.
Relative comparative effectiveness and cost-effectiveness. The relative comparative effectiveness varies widely by disease, with quarantine reducing RS by >65% for influenza A and hepatitis A and <10% for pertussis. However, because of a much shorter incubation period of influenza A vs. hepatitis A (Table 2), the relative cost-effectiveness measured by the reduction per day of quarantine (outlined bars) is substantially higher for influenza A than hepatitis A.
Fig. 4.
Fig. 4.
Influence of disease characteristics and intervention performance metrics. Partial rank correlation coefficients (PRCCs; x axis) measuring the influence of disease characteristics and intervention performance metric (rows) on the absolute (red) and relative (green) comparative effectiveness of quarantine and symptom monitoring pooled for all case-study diseases. The 95% CIs from 100 bootstrapped samples are represented by error bars.
Fig. S2.
Fig. S2.
Number of generations until extinction decreases in the presence of overdispersion. As the dispersion factor (k) decreases (i.e., creating more superspreading), the average numbers of generations (red squares) before extinction of a single infectious case with an R0 of 0.75 are 1.43 for k = 1, 0.26 for k = 0.1, and 0.036 for k = 0.01. Each point indicates the number of generations (y axis; jittered for visibility) until a transmission tree initiated by a single case is contained; 95% CIs are shown in brackets.
Fig. S3.
Fig. S3.
Partial rank correlation coefficients for all outcomes. Partial rank correlation coefficients (x axis) measuring the influence of disease characteristics and intervention performance metrics (rows) on the impact, comparative effectiveness, and comparative cost-effectiveness of the interventions under study. Disease-specific estimates are shown with colored bars, and pooled estimates are shown with large gray bars. For example, increasing the delay in tracing a named contact DCT has a generally small negative effect on RS − RQ when pooled across diseases (large gray bars), but for influenza A specifically (purple bars), DCT has a rather large negative effect on RS − RQ. Note that pooled estimates for comparative cost-effectiveness are not available because of nonmonotonic relationships across diseases.
Fig. 5.
Fig. 5.
Minimally invasive interventions sufficient to control a hypothetical disease. (A) Points represent simulations where health-seeking behavior (teal), symptom monitoring (gold), or quarantine (blue) was the minimally sufficient intervention to bring Re below one. Disease characteristics drawn from Ebola, except symptoms, are assumed to precede infectiousness by up to 10 d (X = −10 d) or emerge up to 10 d after infectiousness onset (X = +10 d). (B) The same as in A, but the x axis is transformed to represent the proportion of infections that occurs before symptoms in an analogous way to Fraser et al. (17).
Fig. S4.
Fig. S4.
Demonstration of overdispersion parameter (k). In a system with 100,000 agents, as the dispersion parameter (k) decreases (i.e., creating more superspreading), the variance of the number of infections generated by each infectious individual increases, whereas the mean is approximately constant at the input value of two.
Fig. S5.
Fig. S5.
Distribution of infectiousness. Key time points in the distribution of infectiousness include the peak (τβ) and duration (dINF) of infectiousness.
Fig. S6.
Fig. S6.
Demonstration of the KS distance for the SMC parameterization method. The parameter set in A generates serial intervals (bars; blue line) that are poorly explained by the reference serial interval distribution (green line), generating a KS score of 0.25. (B) A later iteration of the SMC algorithm-generated parameter set, in which the generated serial intervals are more consistent with the reference serial interval (same green line).

Similar articles

Cited by

References

    1. McMichael AJ. Environmental and social influences on emerging infectious diseases: Past, present and future. Philos Trans R Soc Lond B Biol Sci. 2004;359:1049–1058. - PMC - PubMed
    1. Morens DM, Folkers GK, Fauci AS. The challenge of emerging and re-emerging infectious diseases. Nature. 2004;430:242–249. - PMC - PubMed
    1. Jones KE, et al. Global trends in emerging infectious diseases. Nature. 2008;451:990–993. - PMC - PubMed
    1. Barbera J, et al. Large-scale quarantine following biological terrorism in the United States: Scientific examination, logistic and legal limits, and possible consequences. JAMA. 2001;286:2711–2717. - PubMed
    1. American Civil Liberties Union, Yale Global Health Justice Partnership 2015 Fear, Politics, and Ebola. How Quarantines Hurt the Fight Against Ebola and Violate the Constitution. Available at https://www.aclu.org/sites/default/files/field_document/aclu-ebolareport.... Accessed March 10, 2017.

Publication types

MeSH terms

LinkOut - more resources