. 2017 Apr 11;114(15):3945-3950.
doi: 10.1073/pnas.1607551114. Epub 2017 Mar 28.

Range contraction enables harvesting to extinction

Affiliations

Range contraction enables harvesting to extinction

Matthew G Burgess et al. Proc Natl Acad Sci U S A. .

Abstract

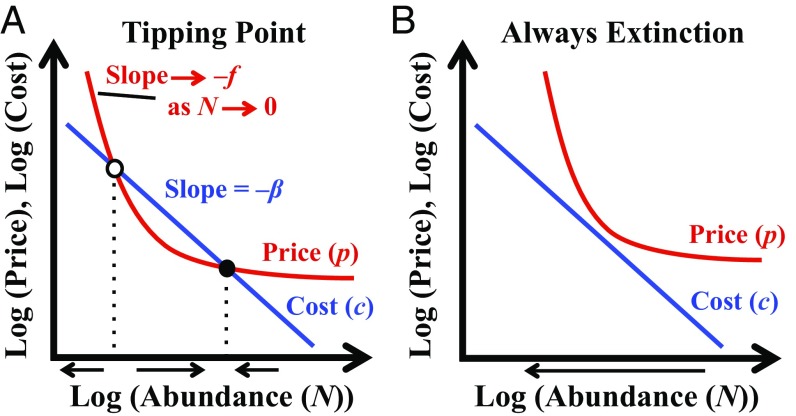
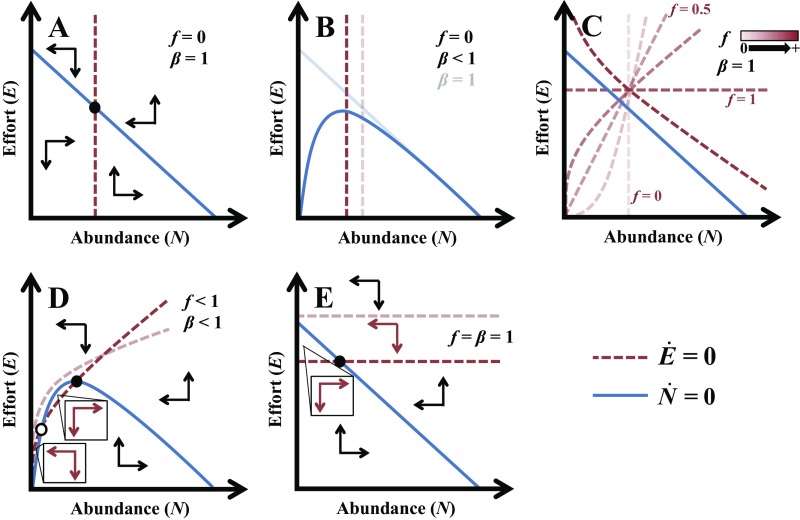
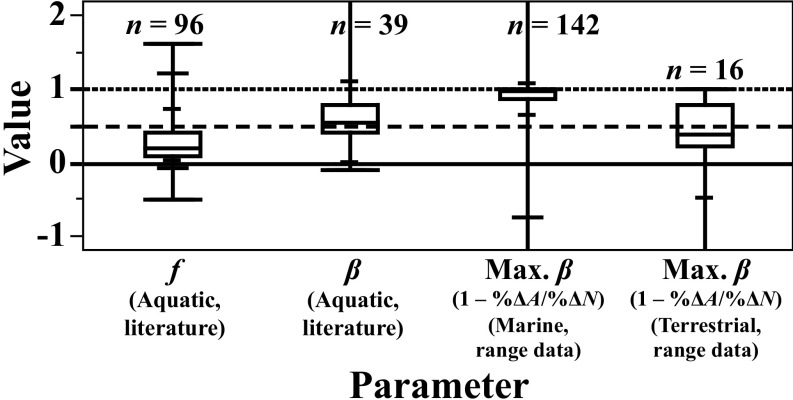
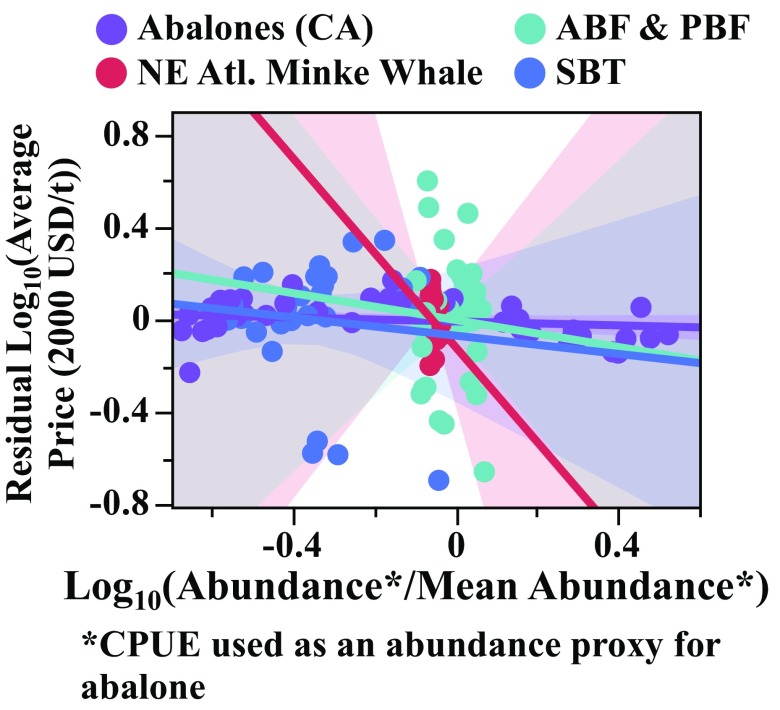
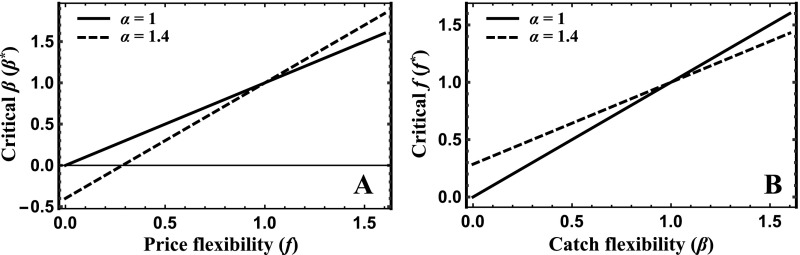
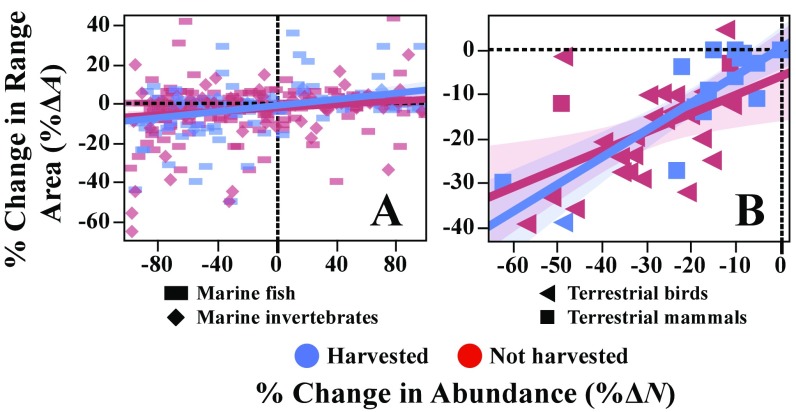
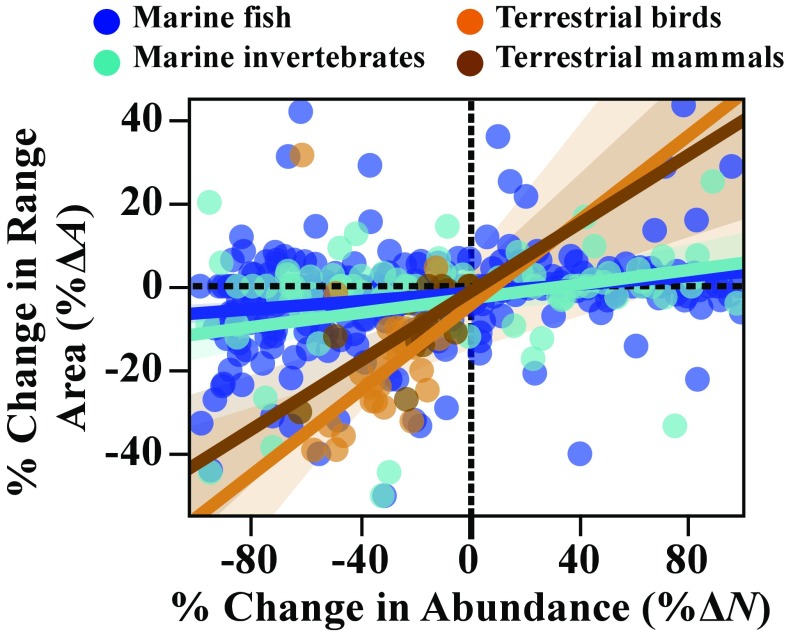
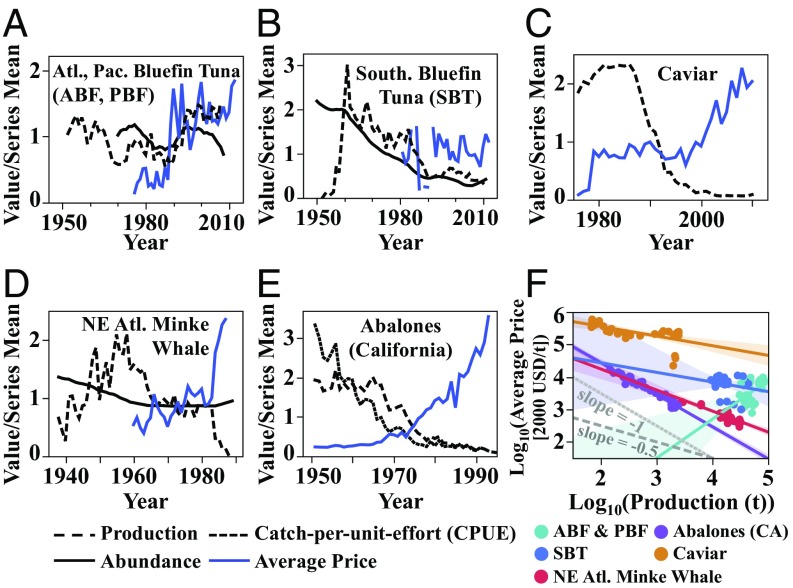
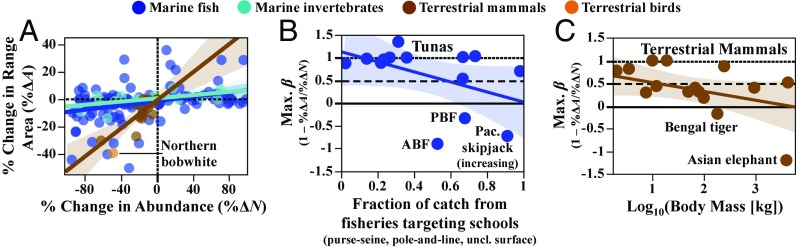
Economic incentives to harvest a species usually diminish as its abundance declines, because harvest costs increase. This prevents harvesting to extinction. A known exception can occur if consumer demand causes a declining species' harvest price to rise faster than costs. This threat may affect rare and valuable species, such as large land mammals, sturgeons, and bluefin tunas. We analyze a similar but underappreciated threat, which arises when the geographic area (range) occupied by a species contracts as its abundance declines. Range contractions maintain the local densities of declining populations, which facilitates harvesting to extinction by preventing abundance declines from causing harvest costs to rise. Factors causing such range contractions include schooling, herding, or flocking behaviors-which, ironically, can be predator-avoidance adaptations; patchy environments; habitat loss; and climate change. We use a simple model to identify combinations of range contractions and price increases capable of causing extinction from profitable overharvesting, and we compare these to an empirical review. We find that some aquatic species that school or forage in patchy environments experience sufficiently severe range contractions as they decline to allow profitable harvesting to extinction even with little or no price increase; and some high-value declining aquatic species experience severe price increases. For terrestrial species, the data needed to evaluate our theory are scarce, but available evidence suggests that extinction-enabling range contractions may be common among declining mammals and birds. Thus, factors causing range contraction as abundance declines may pose unexpectedly large extinction risks to harvested species.

Keywords: anthropogenic Allee effect; biogeography; endangered species; hyperstable; poaching.


Conflict of interest statement

The authors declare no conflict of interest.

Figures

Fig. 1.
Fig. 1.
Profitable harvesting to extinction [Courchamp et al.’s (3) anthropogenic Allee effect] under open access occurs when, at harvest levels at which abundance is not changing, harvest price (red, nonlinear due to density-dependent population growth) is greater than harvest cost (blue) as abundance approaches zero. Such conditions either can result in alternative stable states (A)—a tipping-point abundance (open circle) separates domains of attraction of a positive equilibrium abundance (solid circle) and extinction—or can cause profits to be positive at any abundance and make extinction the only possible outcome of open-access harvesting (B).
Fig. S1.
Fig. S1.
Isoclines and directions of change depicted in NE phase plane for different values of β and f. A illustrates the general concept of the isoclines; B and C illustrate the effects on the isoclines of varying values of β and f, respectively; and D and E illustrate scenarios in which extinction is possible, where f>β (D) or f=β (E). Open and solid circles in A, D, and E denote unstable and potentially stable (cycling) equilibria, respectively. Because both E and N are bounded and the phase plane is 2D, the dynamics of N and E must eventually reach the origin (extinction), the filled equilibrium point, or a limit cycle. Extinction is possible when the E isocline (red) lies above the N isocline at the limit when N approaches zero (equivalent to condition 4 in the main text).
Fig. 2.
Fig. 2.
Comparison of ranges of estimates of price flexibility (f: the percentage of increase in price, p, caused by a 1% decrease in harvest rate, Y) and catch flexibility (β: the percentage of decrease in CPUE caused by a 1% decrease in abundance, N) from the published literature for aquatic species and observed range-abundance relationships [which imply upper bounds on catch flexibility (Max. β) by inequality 11] in marine fish and invertebrates, terrestrial mammals, and one terrestrial bird species (northern bobwhite). Boxes show 25th to 75th percentile range; minima, maxima, and 2.5th, 10th, 90th, and 97.5th percentiles are marked on the whiskers. See Dataset S1 for all values and references. Two terrestrial mammal populations having no observed abundance change are excluded.
Fig. S2.
Fig. S2.
Historical relationships between price (p) and abundance (N), controlling for production (Y), for four of the populations analyzed in Fig. 3 (caviar not shown here due to lack of abundance information). None of these relationships were significant, suggesting price flexibility (f) may capture rarity effects for these products.
Fig. S3.
Fig. S3.
The impact of economies of scale (α>1) on the critical values of (A) β and (B) f needed for an extinction, illustrated with α=1.4 (dashed line, see Table S1) and α=1 (solid line, constant returns to scale).
Fig. S4.
Fig. S4.
Range–abundance relationships of (A) marine fish and invertebrates and (B) terrestrial mammals and birds, comparing harvested (blue) and nonharvested (red) populations. Lines indicate linear OLS fits within each group (harvested vs. not harvested), with 95% confidence intervals shaded. Two outliers among the birds were excluded in these fits, as indicated in Dataset S1.
Fig. S5.
Fig. S5.
Range–abundance relationships of all populations—both harvested and not harvested—for which data were available. Lines indicate linear OLS fits within each large taxonomic group, with 95% confidence intervals shaded, as indicated. Two outliers among the birds were excluded in these fits, as indicated in Dataset S1.
Fig. 3.
Fig. 3.
Price trends in highly valued marine species: (A) ABF and PBF [production (total catch) and abundance from ref. ; ex-vessel prices from ref. 34], (B) SBT [production (total catch) and abundance from ref. ; ex-vessel prices from ref. 34], (C) caviar (global production, average export prices from ref. 37), (D) the Northeast Atlantic minke whale (production, abundance, prices from ref. 38), and (E) California abalones (CPUE and prices from refs. and 39). All prices were converted to real USD value using the World Bank’s (40) published currency exchange and inflation rates. (F) Prices of each of these harvests have historically risen as fast as catch has declined (California abalone) or slower (others). For ABF and PBF, catch and prices rose together pre-1990, creating a positive correlation, likely due to the expansion of sashimi markets. Solid lines show linear fits of log-transformed price and production (supply) data, with 95% confidence intervals shaded. Dotted and dashed gray lines, respectively, illustrate slopes of −1 (implying 1% increase in price for 1% decrease in production) and −0.5, for reference.
Fig. 4.
Fig. 4.
Range–abundance relationships for populations of harvested US marine fish and invertebrates (1970s–2000s; from ref. 42); tuna and billfish (1960–1999; from refs. and 43); harvested terrestrial mammals, mostly from the Western Ghats of India [1978/79–2008/09; from ref. ; also the African forest elephant (Loxodonta cyclotis) from 2002–2011, ref. 45]; and northern bobwhite (Colinus virginianus), a North American game bird (1966–1993; from ref. 46). A shows all populations. B and C show relationships between the maximum catch flexibility (Max. β) and (B) a proxy for schooling behavior in tunas and (C) adult body mass in terrestrial mammals (Dataset S1). Harvested populations exhibiting hyperaggregation (Max. β < 0) are labeled; all are declining in abundance and range over the time periods in question, except for Pacific skipjack tuna (Katsuwonus pelamis), which is increasing. Colored lines in all panels represent linear ordinary least-squares (OLS) fits (within large taxonomic groups in A), with 95% confidence intervals shaded. Negative slopes in B and C are nearly significant (P<0.1).

References

    1. International Union for Conservation of Nature (IUCN) 2015. IUCN Red List of Threatened Species. Version 2016.3. Available at www.iucnredlist.org. Accessed January 14, 2017. - PubMed
    1. Clark CW. Mathematical Bioeconomics: The Optimal Management Resources. Wiley; New York: 1976.
    1. Courchamp F, et al. Rarity value and species extinction: The anthropogenic Allee effect. PLoS Biol. 2006;4(12):e415. - PMC - PubMed
    1. Graham-Rowe D. Biodiversity: Endangered and in demand. Nature. 2011;480(7378):S101–S103. - PubMed
    1. Palazy L, Bonenfant C, Gaillard JM, Courchamp F. Cat dilemma: Too protected to escape trophy hunting? PLoS One. 2011;6(7):e22424. - PMC - PubMed

Publication types