. 2017 Mar 26;9(3):627-649.
doi: 10.18632/aging.101213.

Mitochondrial protein Fus1/Tusc2 in premature aging and age-related pathologies: critical roles of calcium and energy homeostasis

Affiliations

Mitochondrial protein Fus1/Tusc2 in premature aging and age-related pathologies: critical roles of calcium and energy homeostasis

Roman Uzhachenko et al. Aging (Albany NY). .

Abstract

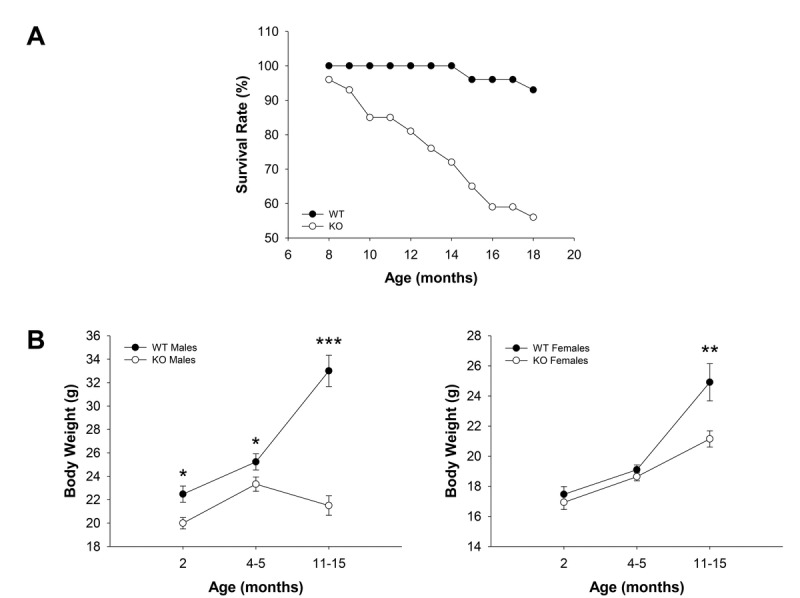
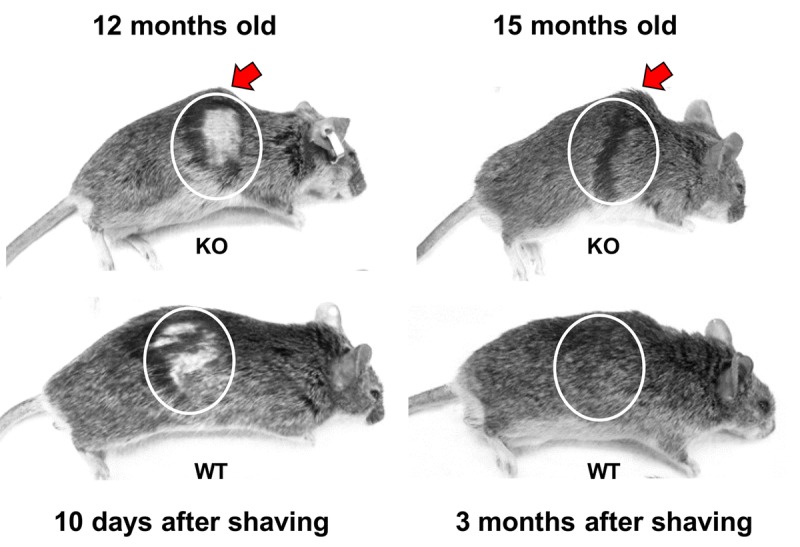
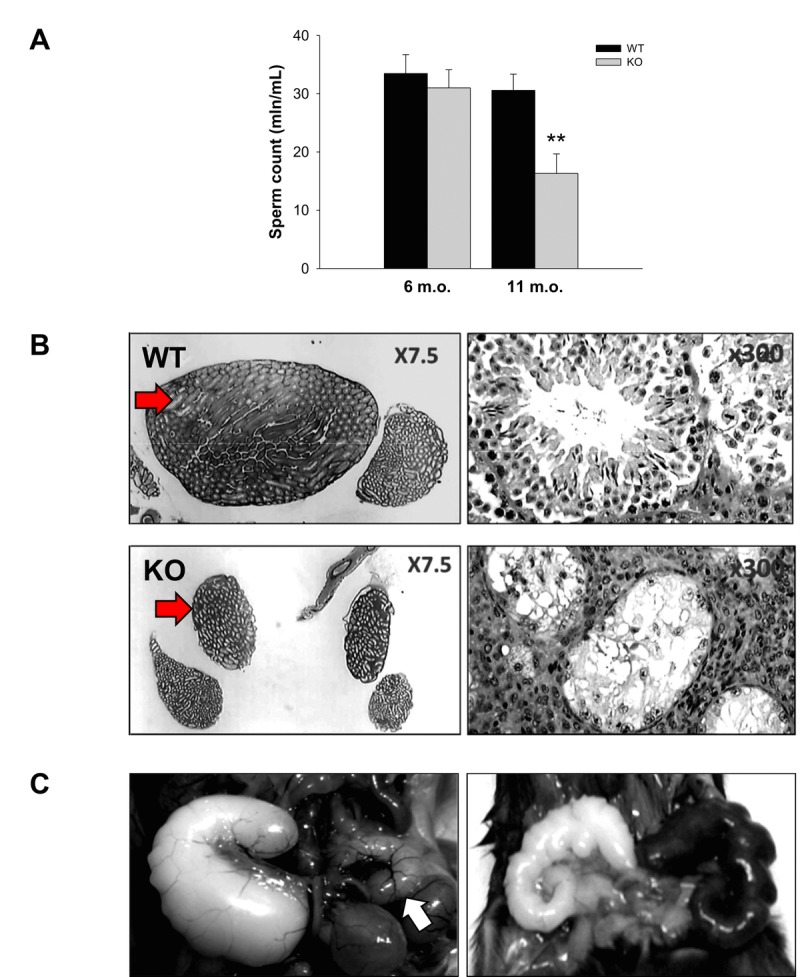
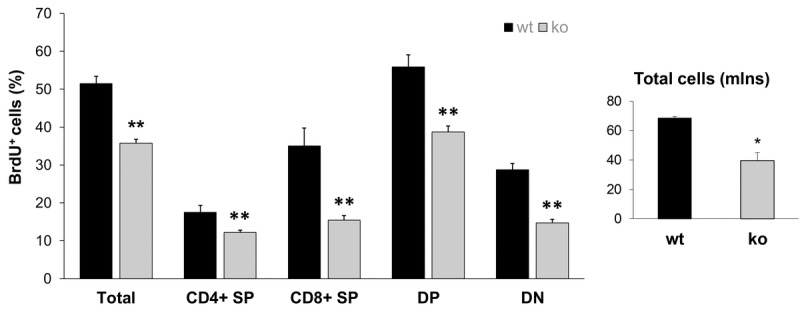
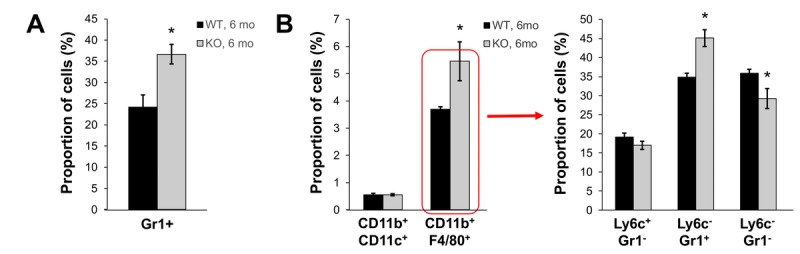
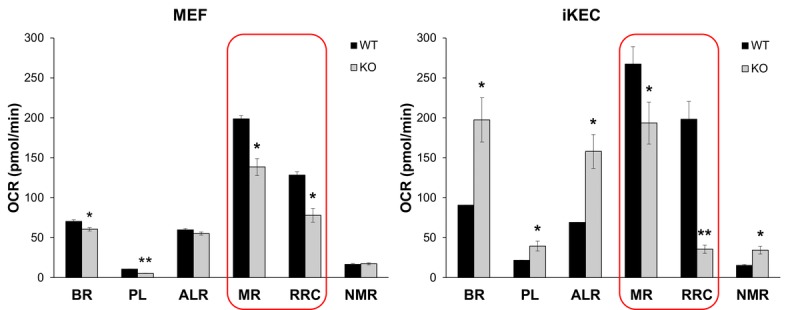
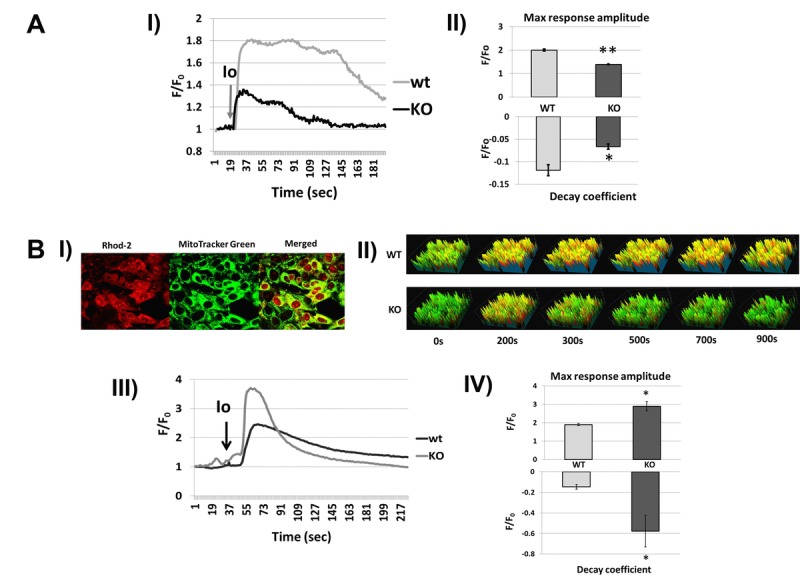
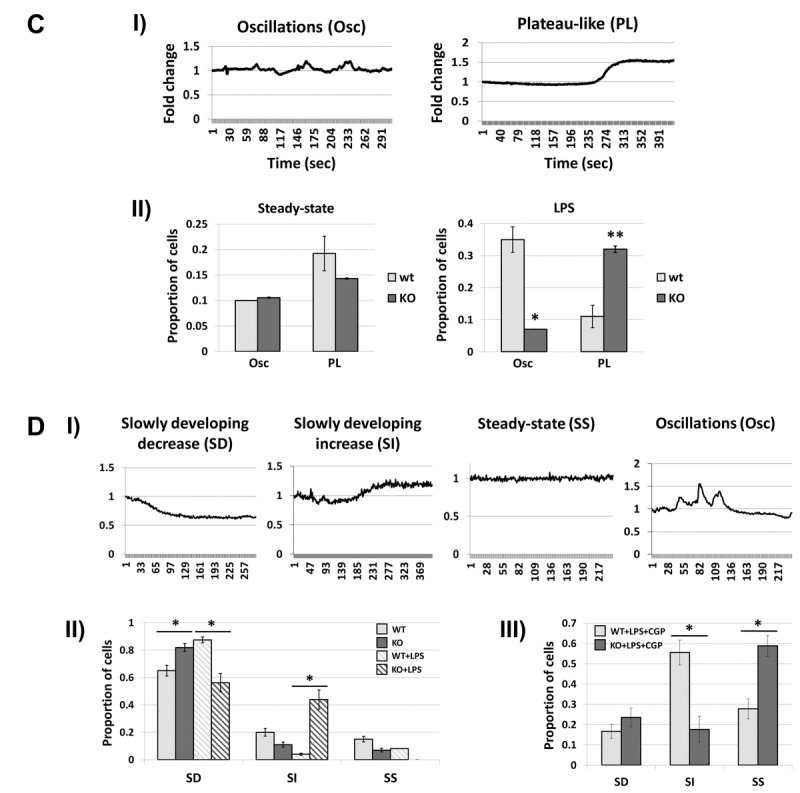
Decreased energy production and increased oxidative stress are considered to be major contributors to aging and aging-associated pathologies. The role of mitochondrial calcium homeostasis has also been highlighted as an important factor affecting different pathological conditions. Here, we present evidence that loss of a small mitochondrial protein Fus1 that maintains mitochondrial homeostasis results in premature aging, aging-associated pathologies, and decreased survival. We showed that Fus1KO mice develop multiple early aging signs including lordokyphosis, lack of vigor, inability to accumulate fat, reduced ability to tolerate stress, and premature death. Other prominent pathological changes included low sperm counts, compromised ability of adult stem cells to repopulate tissues, and chronic inflammation. At the molecular level, we demonstrated that mitochondria of Fus1 KO cells have low reserve respiratory capacity (the ability to produce extra energy during sudden energy demanding situations), and show significantly altered dynamics of cellular calcium response.Our recent studies on early hearing and memory loss in Fus1 KO mice combined with the new data presented here suggest that calcium and energy homeostasis controlled by Fus1 may be at the core of its aging-regulating activities. Thus, Fus1 protein and Fus1-dependent pathways and processes may represent new tools and targets for anti-aging strategies.

Keywords: Fus1/Tusc2; calcium response; chronic inflammation; mitochondrial Ca aging and age-related diseases 2+,; mitochondrial respiration.


Conflict of interest statement

CONFLICTS OF INTEREST

The authors declare no conflict of interest.

Figures

Figure 1
Figure 1. Survival and age-dependent dynamics of body weights in WT and Fus1 KO mice
(A) Survival curves for WT (n = 30) and Fus1 KO (n = 54) mice from 8 to 18 months of age. (B) Age-dependent changes in body weights of WT and Fus1 KO mice. *p-value ≤ 0.05; **p-value ≤ 0.005; ***p-value ≤ 0.0005 (Student's t-test, 2-sided unpaired). Number of mice used in the analysis: 2 m.o. males, n = 11-12/group; 2 m.o. females, n = 15-18/group; 4-5 m.o. males, n = 17-18/group; 4-5 m.o. females, n = 8/group; 11- 15 m.o. males, n = 10/group; 11- 15 m.o. females, n = 9-13/group. Data expressed as mean ± SEM.
Figure 2
Figure 2. Premature signs of systemic aging in Fus1 KO mice
KO mice (upper row) show signs of lordokyphosis (hunchbacked spine, pointed with arrow) and thinning of subcutaneous fat earlier than WT mice (bottom row). Also, hair-growth assay showed that 12 m.o. WT mice (n = 5) partially re-grew their hair at 10 days after shaving (bottom row) and had completely restored hair at 1 month after shaving while none of the KO mice (n = 5) showed hair growth at 10 days and all of them failed to close the shaved area even after 3 months. Shaving areas are circled.
Figure 3
Figure 3. Prematurely developed low sperm count, occasional testes degeneration or vesicle enlargement observed in Fus1 KO but not in WT mice
(A) Sperm count in WT and Fus1 KO mice of different ages (6 m.o.: WT mice, n = 10, KO mice, n = 9; 11-12 m.o.: WT mice, n = 6; KO mice, n = 9) revealed a premature sperm count decrease in 11-12 m.o. Fus1 KO mice; (B) Unilateral (not shown) and bilateral testes degeneration (shown at x7.5 and x300 magnification) were observed occasionally in adult Fus1 KO but not in WT mice. Arrows point to a normal testis from a WT mouse and a degenerated one from a Fus1 KO mouse; (C) Enlargement of seminal vesicles, an aging lesion that occurs spontaneously in some mice aged 24 mo or older were found in Fus1 KO mice of 16-20 months old. Lesions of different types were observed: asymmetrical vesicle enlargement (left), a normal size vesicle is shown by the arrow; symmetrical enlargement and discoloration of vesicles (right); symmetrical vesicle enlargement (not shown).
Figure 4
Figure 4. Lower proliferative capacity of Fus1 KO thymocytes revealed their lower renewal potential
Proliferation capacity was estimated by calculating the ratio of BrdU-positive T cells to the total number of T cells. *p-value ≤ 0.05; **p-value ≤ 0.005 (Student's t-test, 2-sided unpaired). Data expressed as mean ± SEM (n = 4 mice/group).
Figure 5
Figure 5. Fus1 KO mice (6 m.o.) show an increased number of inflammatory monocytes in peripheral blood and spleen
*p-value ≤ 0.05; **p-value ≤ 0.005 (Student's t-test, 2-sided unpaired). Data expressed as mean ± SEM (n = 6 mice/group).
Figure 6
Figure 6. Fus1 loss results in a decreased maximal respiration and respiratory reserve capacity in primary MEFs and immortalized epithelial Fus1 KO cells
High resolution respirometry oxygraph-2k (Oroboros Instruments) was used for analysis of cellular respiration. Abbreviations are as follows: OCR - oxygen consumption rate, BR - basal respiration rate, PL - proton leak rate, ALR - ATP-linked respiration; MR - maximal mitochondrial respiration, RRC – respiratory reserve capacity, NMR - non-mitochondrial respiration. Experiments were performed in triplicates. *p-value ≤ 0.05; **p-value ≤ 0.005 (Student's t-test, 2-sided unpaired). Data expressed as mean ± SEM.
Figure 7
Figure 7. Fus1 KO cells show aberrant [Ca2+]c and [Ca2+]m responses to different stimuli that were improved by inhibiting the mitochondrial sodium/calcium exchanger (mNCX)
(A) [Ca2+]c changes in Fus1 KO and WT iKEC in response to the calcium agonist Ionomycin. Panel I shows dynamic [Ca2+]c levels in WT and Fus1 KO iKEC after treatment with Ionomycin (Io, grey arrow) detected by Fura-2 Ca2+-sensitive fluorescent probe. Ratio 340/380 for Fura-2 in Io-stimulated iKEC (F) was normalized to the fluorescence value of control levels (without Io, Fo); Panel II shows parameters of [Ca2+]c response induced by Ionomycin in WT and Fus1 KO iKEC: maximal amplitude of response (upper section) and coefficient of decay phase (lower section). The level of statistical significance is designated as *p < 0.05, **p < 0.01. (B) changes in Fus1 KO and WT iKEC in response to Ionomycin. Panel I shows compartmentalization of Ca2+-sensitive fluorescent dye Rhod-2 (red) in iKE cells stained with mitochondria-specific dye MTG. Yellow color in the merged image represents staining of Rhod-2 in mitochondria. Panel II demonstrates snapshots showing Ionomycin-induced temporal changes of [Ca2+]m levels in WT and Fus1 KO iKEC double-stained with MTG/Rhod-2; Panel III shows [Ca2+]m dynamics profiles for WT and Fus1 KO iKEC obtained by double staining of iKEC with MTG/Rhod-2. Curves represent ratio of Rhod-2 fluorescence normalized to MTG fluorescence; Panel IV shows parameters of [Ca2+]m response induced by Ionomycin in WT and Fus1 KO iKEC: maximal amplitude of [Ca2+]m response (upper panel) and coefficient of [Ca2+]m decay phase after Ionomycin induction (lower panel). (C) Steady state and LPS-induced [Ca2+]c profiles in WT and Fus1 KO MEFs. Panel I demonstrates major patterns of [Ca2+]c responses in WT and Fus1 KO primary MEFs at steady state and after LPS treatment detected by Fura-2 Ca2+-sensitive fluorescent dye. Panel II demonstrates the proportion of cells with Osc- and PL-type [Ca2+]c responses at steady state and after treatment with LPS (100 ng/mL). (D) Dynamics of basal, LPS- and CGP-induced [Ca2+]m responses in WT and KO primary MEFs. Panel I shows major patterns of [Ca2+]m responses at steady state and after LPS treatment (100 ng/mL) detected by MTG/Rhod-2 co-staining. Panel II shows the proportion of cells with SD-, SI-, and SS-patterns of [Ca2+]m responses in WT and Fus1 KO MEFs at steady state and after treatment with LPS (100 ng/mL). Panel III demonstrates the proportion of cells with SD-, SI-, and SS-patterns of [Ca2+]m responses after co-treatment of MEFs with LPS (100 ng/mL) and CGP37157 (CGP), an inhibitor of mitochondrial of Na+/Ca2+ exchanger. *p-value ≤ 0.05; **p-value ≤ 0.005 (Student's t-test, 2-sided unpaired). Data expressed as mean ± SEM.
Figure 8
Figure 8. In silico analysis of Fus1 expression and co-expression data linked Fus1 with aging-associated diseases
(A) Fus1 co-expression analysis revealed tight link of Fus1 with oxidative phosphorylation and with multiple neurodegenerative diseases. (B) Fus1 expression level is downregulated in aged female muscle tissues. *p-value ≤ 0.05 (Student's t-test, 2-sided unpaired). Data expressed as mean ± SEM.
Figure 9
Figure 9. Hypothetical model of Fus1 activities in mitochondria
(A) At steady-state or low [Ca2+]c levels, Fus1 has a dual effect on [Ca2+]m: it (1) stimulates mitochondrial Na+/Ca2+ exchanger (mNCX) that is responsible for efflux of Ca2+ from the mitochondrial matrix in exchange for Na+ from the intermembrane space, and (2) inhibits mitochondrial Ca2+ uptake (mtCU) mechanisms (e.g., MCU). These data allow us to consider Fus1 as a gatekeeper for mtCU, which is potentially able to filter out Ca2+ signals with inappropriate characteristics (e.g., low-amplitude, short, etc.). (B) Binding of Ca2+ (dark circle inside Fus1) to Fus1 after [Ca2+]c elevation leads to a release of myristoil residue (purple tail) and its anchoring to the mitochondrial matrix membrane. It is accompanied by mNCX inhibition and mtCU activation. The latter has an ability of self-inhibition by Ca2+ (negative feedback loop), the mechanism that is probably suppressed by Fus1 thereby letting mtCU to gain inward Ca2+ currents in a dynamic mode demonstrating a feature of a positive feedback loop. (C) In the absence of Fus1, mitochondria accumulate more Ca2+ at steady state or at the beginning of a Ca2+ response due to the lack of the gatekeeping function of Fus1 and decreased activity of mNCX. (D) During the dynamic development of a Ca2+ response, mtCU in mitochondria lacking Fus1 is auto-inhibited by Ca2+ while mNCX is activated due to the lack of Fus1 suppressive activities, which results in an elevated efflux of Ca2+ from mitochondria.

References

    1. Di Lisa F, Bernardi P. Mitochondrial function and myocardial aging. A critical analysis of the role of permeability transition. Cardiovasc Res. 2005;66:222–32. doi: 10.1016/j.cardiores.2005.02.009. - DOI - PubMed
    1. Pi Y, Goldenthal MJ, Marín-García J. Mitochondrial channelopathies in aging. J Mol Med (Berl) 2007;85:937–51. doi: 10.1007/s00109-007-0190-5. - DOI - PubMed
    1. Conley KE, Marcinek DJ, Villarin J. Mitochondrial dysfunction and age. Curr Opin Clin Nutr Metab Care. doi: 10.1097/MCO.0b013e3282f0dbfb. - DOI - PubMed
    1. Bratic A, Larsson NG. The role of mitochondria in aging. J Clin Invest. 2013;123:951–57. doi: 10.1172/JCI64125. - DOI - PMC - PubMed
    1. Elchuri S, Oberley TD, Qi W, Eisenstein RS, Jackson Roberts L, Van Remmen H, Epstein CJ, Huang TT. CuZnSOD deficiency leads to persistent and widespread oxidative damage and hepatocarcinogenesis later in life. Oncogene. 2005;24:367–80. doi: 10.1038/sj.onc.1208207. - DOI - PubMed

Publication types

MeSH terms