. 2017 Mar 28;7(1):461.
doi: 10.1038/s41598-017-00564-3.

Protein tyrosine phosphatase Shp2 deficiency in podocytes attenuates lipopolysaccharide-induced proteinuria

Affiliations

Protein tyrosine phosphatase Shp2 deficiency in podocytes attenuates lipopolysaccharide-induced proteinuria

Ming-Fo Hsu et al. Sci Rep. .

Abstract

Podocytes are specialized epithelial cells that play a significant role in maintaining the integrity of the glomerular filtration barrier and preventing urinary protein leakage. We investigated the contribution of protein tyrosine phosphatase Shp2 to lipopolysaccharide (LPS)-induced renal injury. We report increased Shp2 expression in murine kidneys and cultured podocytes following an LPS challenge. To determine the role of podocyte Shp2 in vivo, we generated podocyte-specific Shp2 knockout (pod-Shp2 KO) mice. Following administration of LPS, pod-Shp2 KO mice exhibited lower proteinuria and blood urea nitrogen concentrations than controls indicative of preserved filter integrity. In addition, renal mRNA and serum concentrations of inflammatory cytokines IL-1β, TNFα, INFγ and IL-12 p70 were significantly decreased in LPS-treated knockout mice compared with controls. Moreover, the protective effects of podocyte Shp2 deficiency were associated with decreased LPS-induced NF-κB and MAPK activation, nephrin phosphorylation and attenuated endoplasmic reticulum stress. These effects were recapitulated in differentiated E11 murine podocytes with lentiviral-mediated Shp2 knockdown. Furthermore, Shp2 deficient podocytes displayed reduced LPS-induced migration in a wound healing assay. These findings identify Shp2 in podocytes as a significant contributor to the signaling events following LPS challenge and suggest that inhibition of Shp2 in podocytes may present a potential therapeutic target for podocytopathies.


Conflict of interest statement

The authors declare that they have no competing interests.

Figures

Figure 1
Figure 1
LPS treatment increases renal and podocyte Shp2 expression. (a) Immunoblots of Shp2 and tubulin in total kidney lysates. Control (saline, n = 6) and LPS-injected (n = 6) wild-type male mice were sacrificed 24 hours after injection. Representative images are shown and each lane represents an animal. Shp2 protein expression (left, normalized to tubulin) and mRNA (right, normalized to Tbp) presented in bar charts as means + SEM. *p < 0.05 indicates a significant difference between saline and LPS-treated mice. (b) Co-immunostaining of Shp2 (green) and synaptopodin (Synpo, red) in kidney sections from saline and LPS-treated wild-type mice. Scale bar: 20 µm. (c) Differentiated E11 podocytes were treated with PBS for 24 hours and with LPS for 6, 12 and 24 hours. Cell lysates were immunoblotted for Shp2, synaptopodin, and actin. Protein expression was normalized to actin and presented in a bar chart as means + SEM from three independent experiments. *p < 0.05 and # p < 0.05 indicate a significant difference between PBS (24 h) and LPS-treated groups for Shp2 and synaptopodin, respectively. A.U., arbitrary units.
Figure 2
Figure 2
Efficient and specific deletion of Shp2 in podocytes. (a) Genomic DNA was extracted from tissues (as indicated) of control (Ctrl) and pod-Shp2 knockout (KO) mice. Deletion of the floxed allele was detected by PCR, and GAPDH served as a loading control. (b) Immunoblots of Shp2 protein expression in isolated primary podocytes, adipose (epididymal fat), liver and muscle from Ctrl and KO mice. Tubulin and synaptopodin (Synpo, for podocytes) presented as loading controls. (c) Immunostaining of Shp2 (green) and synaptopodin (red) in kidney sections from Ctrl and KO mice. Scale bar: 50 µm.
Figure 3
Figure 3
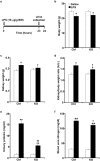
Pod-Shp2 KO mice are more resistant than controls to LPS-induced renal injury. (a) Schematic of experimental timeline for LPS administration and mice sacrifice. Body weight (b), kidney weight (c), kidney/body weight ratio (d), urinary proteins concentration (e) and blood urea nitrogen (f) of control (Ctrl, n = 8) and pod-Shp2 knockout (KO, n = 8) mice without (saline) and with LPS treatment. *p < 0.05 and **p < 0.01 indicate a significant difference between saline and LPS treatments; p < 0.05 and †† p < 0.01 indicate a significant difference between Ctrl and KO mice. Data were presented as means + SEM. A.U., arbitrary units.
Figure 4
Figure 4
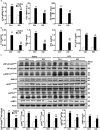
Attenuated LPS-induced inflammatory response in pod-Shp2 KO mice. Renal mRNA of Il-1b, Il-6 and Tnfa (a), and plasma concentrations of IL-1β, TNFα, INFγ and IL-12 p70 (b) in saline and LPS-treated control (Ctrl, n = 6) and pod-Shp2 knockout (KO, n = 6) mice. (c) Kidney lysates from Ctrl and KO mice without (saline) and with LPS treatment were immunoblotted for phosphorylated NF-κB p65, JNK, p38, peIF2α and their respective proteins, spliced XBP1 (sXBP1), and actin as a loading control. Representative images are shown. Bar charts represent pNF-κB p65/NF-κB p65, pJNK/JNK, pp38/p38, peIF2α/eIF2α and sXBP1/actin as means + SEM. For all bar charts, *p < 0.05 and **p < 0.01 indicate a significant difference between saline and LPS treatments; p < 0.05 and †† p < 0.01 indicate a significant difference between Ctrl and KO mice. A.U., arbitrary units.
Figure 5
Figure 5
Attenuated LPS-induced Shp2 and nephrin phosphorylation in pod-Shp2 KO mice. (a) Kidney lysates from control (Ctrl) and pod-Shp2 knockout (KO) mice without (saline) and with LPS treatment were immunoblotted for pShp2 (Tyr542), Shp2 and actin as a loading control. Representative images are shown and each lane represents an animal. Bar chart represents pShp2 (Tyr542)/actin as means + SEM (n = 6). *p < 0.05 indicates a significant difference between saline and LPS treatments; p < 0.05 indicates a significant difference between Ctrl and KO mice. A.U., arbitrary units. (b) Immunostaining of pNephrin (Y1176/Y1193) in kidney sections from Ctrl and KO mice without (saline) and with LPS treatment. Lower panel includes enlarged images that are highlighted by white boxes in the upper panel. Scale bar: 50 µm.
Figure 6
Figure 6
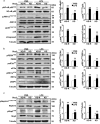
Shp2 deficiency in E11 podocytes attenuates LPS-induced inflammatory response and ER stress. Differentiated podocytes with Shp2 knockdown (KD) and rescue (KD-R) were treated with PBS and with LPS for 24 hours. Cell lysates were subjected to immunoblots with primary antibodies as indicated. Representative images are shown. Bar charts of pNF-κB p65/NF-κB p65, pJNK/JNK, pp38/p38, cleaved Caspase3/tubulin (a), pPERK/PERK, peIF2α/eIF2α, pIRE1α/IRE1α and sXBP1/tubulin (b), pNephrin/Nephrin and pShp2/tubulin (c) are presented as means + SEM from three independent experiments. *p < 0.05 and **p < 0.01 indicate a significant difference between PBS and LPS treatments; p < 0.05 and †† p < 0.01 indicate a significant difference between KD-R and KD podocytes. A.U., arbitrary units.
Figure 7
Figure 7
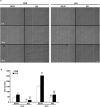
Decreased LPS-induced cell migration in Shp2 deficient podocytes. (a) Differentiated E11 podocytes with Shp2 knockdown (KD) and rescue (KD-R) were cultured with PBS and LPS for 48 hours after wound induction. Images were acquired before treatment (0 h) and at 24 and 48 h post wound. Scale bar: 200 µm. Cell numbers in the wound track were counted and presented in the bar chart (b) as means + SEM from four independent experiments. *p < 0.05 and **p < 0.01 indicate a significant difference between PBS and LPS treatments; †† p < 0.01 indicates a significant difference between KD-R and KD podocytes.

Similar articles

Cited by

References

    1. Greka A, Mundel P. Cell biology and pathology of podocytes. Annu Rev Physiol. 2012;74:299–323. doi: 10.1146/annurev-physiol-020911-153238. - DOI - PMC - PubMed
    1. Grahammer F, Schell C, Huber TB. The podocyte slit diaphragm–from a thin grey line to a complex signalling hub. Nat Rev Nephrol. 2013;9:587–598. doi: 10.1038/nrneph.2013.169. - DOI - PubMed
    1. El Karoui K, et al. Endoplasmic reticulum stress drives proteinuria-induced kidney lesions via Lipocalin 2. Nat Commun. 2016;7:10330. doi: 10.1038/ncomms10330. - DOI - PMC - PubMed
    1. New LA, et al. Nephrin Tyrosine Phosphorylation Is Required to Stabilize and Restore Podocyte Foot Process Architecture. J Am Soc Nephrol. 2016;27:2422–2435. doi: 10.1681/ASN.2015091048. - DOI - PMC - PubMed
    1. Tonks NK. Protein tyrosine phosphatases: from genes, to function, to disease. Nat Rev Mol Cell Biol. 2006;7:833–846. doi: 10.1038/nrm2039. - DOI - PubMed

Publication types

MeSH terms

Substances