. 2017 Mar 28;7(1):475.
doi: 10.1038/s41598-017-00560-7.

PKCα diffusion and translocation are independent of an intact cytoskeleton

Affiliations

PKCα diffusion and translocation are independent of an intact cytoskeleton

Xin Hui et al. Sci Rep. .

Abstract

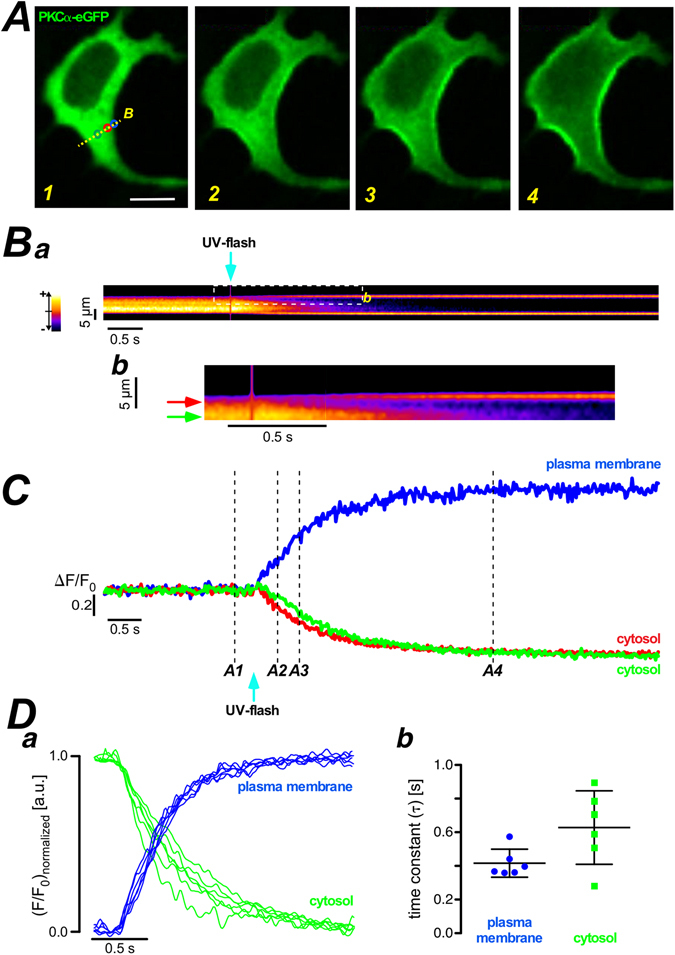
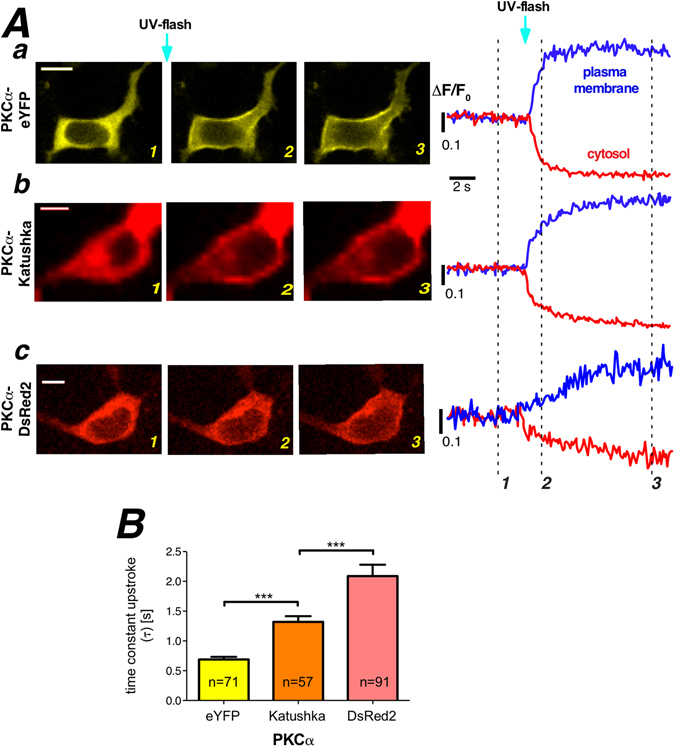
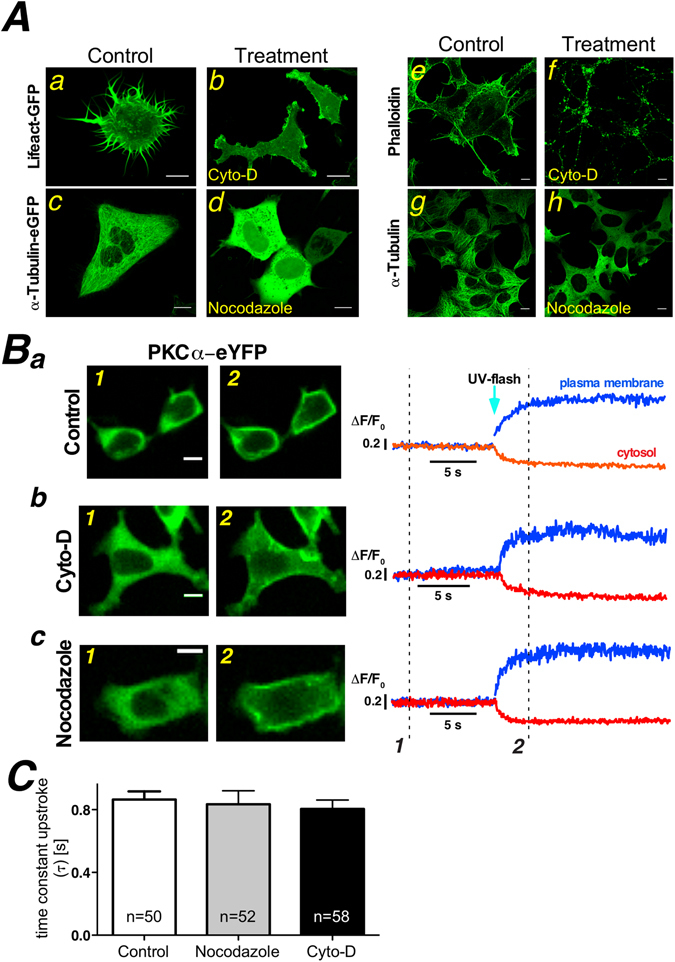
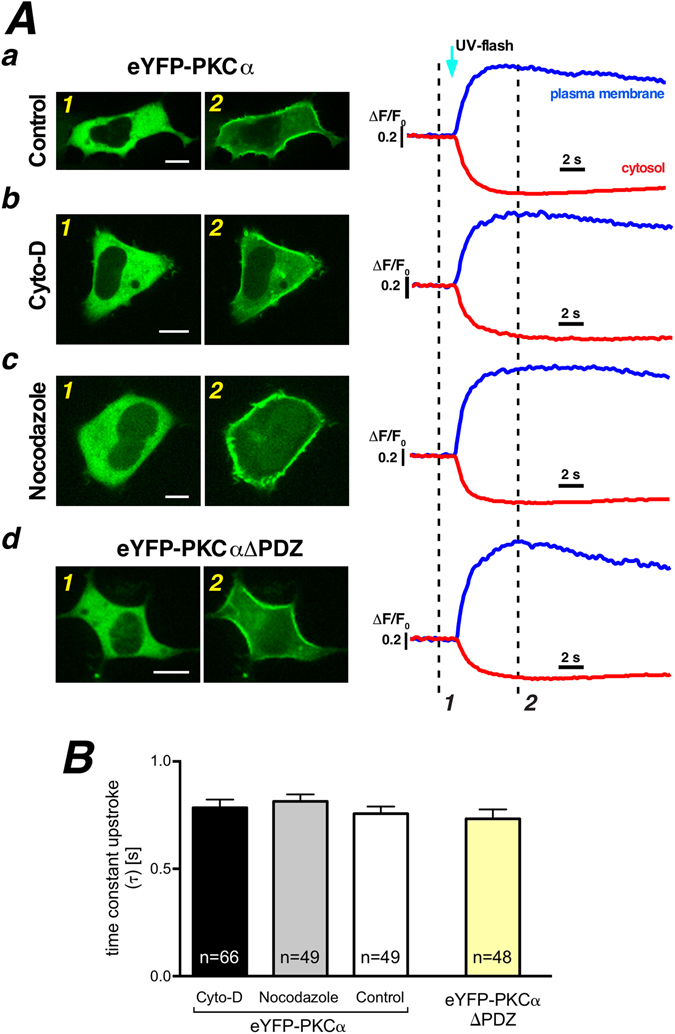
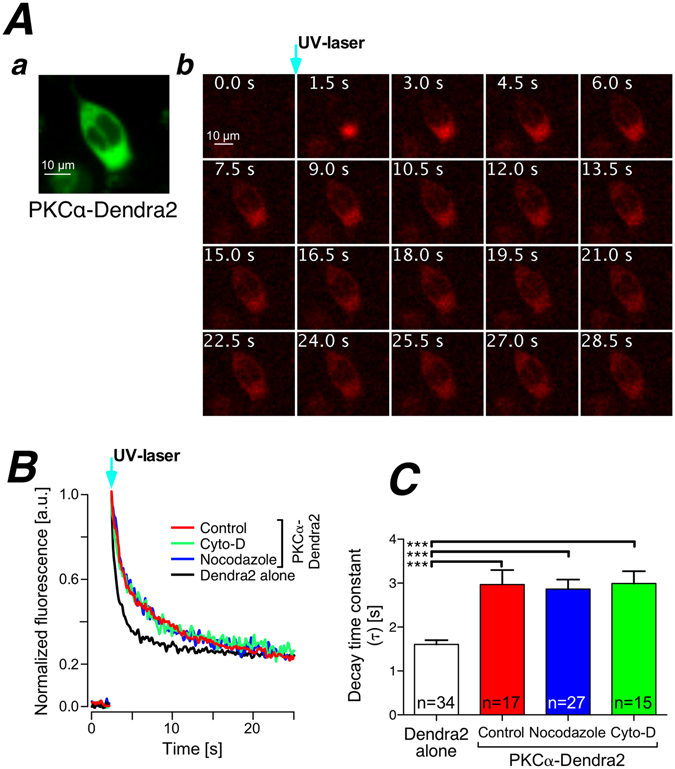
Translocation of cytosolic cPKC to the plasma membrane is a key event in their activation process but its exact nature is still unclear with particular dispute whether sole diffusion or additional active transport along the cell's cytoskeleton contributes to cPKC's dynamics. This was addressed by analyzing the recruitment behavior of PKCα while manipulating the cytoskeleton. Photolytic Ca2+ uncaging allowed us to quantify the kinetics of PKCα redistribution to the plasma membrane when fused to monomeric, dimeric and tetrameric fluorescence proteins. Results indicated that translocation kinetics were modulated by the state of oligomerization as expected for varying Stokes' radii of the participating proteins. Following depolymerization of the microtubules and the actin filaments we found that Ca2+ induced membrane accumulation of PKCα was independent of the filamentous state of the cytoskeleton. Fusion of PKCα to the photo-convertible fluorescent protein Dendra2 enabled the investigation of PKCα-cytoskeleton interactions under resting conditions. Redistribution following spatially restricted photoconversion showed that the mobility of the fusion protein was independent of the state of the cytoskeleton. Our data demonstrated that in living cells neither actin filaments nor microtubules contribute to PKCα's cytosolic mobility or Ca2+-induced translocation to the plasma membrane. Instead translocation is a solely diffusion-driven process.


Conflict of interest statement

The authors declare that they have no competing interests.

Figures

Figure 1
Figure 1
Quantitative analysis of PKCα-eGFP translocation from cytosol to plasma membrane. (A) PKCα-eGFP distribution in HEK293 cells at the resting state – left panel. Fluorescent images of PKCα-eGFP distribution upon UV-flash in NP-EGTA loaded HEK293 cells at the time points indicated in (C). Scale bar is 10 μm. (Ba) The pseudo line scan at the labeled position (yellow dash line in the panel A1). Part of the pseudo line scan image (dashed box) was redrawn at a higher magnification in (Bb). The color wedge in (Ba) shows the color-coding of the relative fluorescence changes as indicated. (C) Plots of fluorescence over time at the plasma membrane (blue) and the cytosol (green and red) from the regions of interest, marked in panel A1. The numbers at the traces correspond to the numbered images in (A). (Da) Fluorescence over time plots of 6 regions of interest randomly chosen in the cytosolic (green) and at the plasma membrane (blue). (Db) Statistical summary of the analysis of the time constant for the traces depicted in the left panel. The scatter plot depicts individual values (symbols), the mean and the standard deviation. Similar results were found in all 7 cells analyzed in a similar way.
Figure 2
Figure 2
Properties of oligomerized PKCα-fluorescent protein. (A) Properties of PKCα translocation to the plasma membrane following UV flash photolysis for (Aa) PKCα-eYFP (monomeric fluorescent protein), (Ab) PKCα-Katushka (dimeric fluorescent protein), and (Ac) PKCα-DsRed2 (tetrameric fluorescent protein). Labeling of the images corresponds to the three different time points highlighted with the dashed lines. Scale bars indicate 10 μm. (B) Translocation processes were quantified by fitting a mono-exponential function to the plasma membrane association traces. Statistical summary for PKCα-eYFP, PKCα-Katushka, and PKCα-DsRed2. Numbers given on the bars indicate number of cells in at least 5 independent experiments. Scale bars indicate 10 μm.
Figure 3
Figure 3
Depolymerization of actin filaments and microtubules does not alter Ca2+ induced PKCα translocation. (A) Cytochalasin-D (4 µM, 2 hours) (b,f) or nocodazole (10 µM, 2 hours) (d,h) treatment of HEK cells, either expressing Lifeact-GFP (a,b) and α-tubulin-eGFP (c,d), staining with phalloidin (e,f) or immunofluorescence with primary antibodies against α-tubulin (g,h), results in depolymerisation of actin filaments (b,f) and microtubules (d,h), respectively. Note that the confocal sections in Aa and Ab were deliberately close to the bottom of the cell to highlight the spiky plasma membrane protrusion while all other confocal sections were placed in the middle of the nucleus. (B) Exemplified single images of PKCα-eYFP distribution before (Ba1, Bb1, Bc1) and following (Ba2, Bb2, Bc2) photolytic Ca2+ increase at the time points marked in the traces to the right. Three different experimental conditions are depicted (Ba-control, Bb-cytochalasin-D treatment, Bc- nocodazole treatment). Traces were generated from regions of interest in the cytosol (red traces) and on the plasma membrane (blue traces). (C) The plasma membrane accumulation was characterized by fitting an exponential to the upstroke following the flash photolytic Ca2+ increase. The statistical summary demonstrates that the state of polymerization of the cytoskeleton does not influence the speed at which PKCα-eYFP accumulates at the plasma membrane after Ca2+ UV flash photolysis. Numbers given on the bars indicate number of cells in at least 5 independent experiments.
Figure 4
Figure 4
PDZ ligand motif of PKCα does not contribute to Ca2+ induced PKCα translocation. (A) Exemplified single images of eYFP-PKCα distribution before (Aa1, Ab1, Ac1) and following photolytic Ca2+ increase (Aa2, Ab2, Ac2) at the time points marked in the traces to the right. Three different experimental treatments are depicted (Aa-control, Ab-Cyto-D treatment, Ac-nocodazole treatment). Distribution of eYFP-PKCαΔPDZ in HEK293 cell before (Ad1) and after photolytic Ca2+ increase (Ad2). Traces were generated from regions of interest in the cytosol (red traces) and on the plasma membrane (blue traces). (B) The statistical summary of plasma membrane accumulation time by fitting an exponential to the upstroke following the flash photolytic Ca2+ increase. Numbers given on the bars indicate number of cells in at least 5 independent experiments.
Figure 5
Figure 5
Cytosolic PKCα mobility is not modulated by the state of the cytoskeleton under resting conditions. (A) Photoconversion of PKCα-Dendra2 by spatially restricted illumination with a focused UV-laser. Inset shows green fluorescence of Dendra2 under resting conditions. The sequence of images depicts the time course of the red PKCα-Dendra2 fluorescence following UV illumination. Time points are given in each image. (B) Fluorescence time course at the point of photoconversion under various experimental conditions (given in the inset). (C) Statistical summary of the fluorescence decay at the point of photoconversion during the experimental conditions given. Numbers given on the bars indicate number of cells in at least 3 independent experiments.

Similar articles

Cited by

References

    1. Gallegos LL, Newton AC. Spatiotemporal dynamics of lipid signaling: Protein kinase C as a paradigm. IUBMB Life. 2008;60:782–789. doi: 10.1002/iub.122. - DOI - PMC - PubMed
    1. Lipp P, Reither G. Protein Kinase C: The ‘Masters’ of Calcium and Lipid. Cold Spring Harb. Perspect. Biol. 2011;3:a004556–a004556. doi: 10.1101/cshperspect.a004556. - DOI - PMC - PubMed
    1. House C, Kemp BE. Protein kinase C contains a pseudosubstrate prototope in its regulatory domain. Science. 1987;238:1726–1728. doi: 10.1126/science.3686012. - DOI - PubMed
    1. Steinberg SF. Structural Basis of Protein Kinase C Isoform Function. Physiol. Rev. 2008;88:1341–1378. doi: 10.1152/physrev.00034.2007. - DOI - PMC - PubMed
    1. Medkova M, Cho W. Mutagenesis of the C2 domain of protein kinase C-alpha. Differential roles of Ca2+ ligands and membrane binding residues. J. Biol. Chem. 1998;273:17544–17552. doi: 10.1074/jbc.273.28.17544. - DOI - PubMed

Publication types

LinkOut - more resources