. 2017 Mar 28;7(1):467.
doi: 10.1038/s41598-017-00543-8.

Bats pre-adapt sensory acquisition according to target distance prior to takeoff even in the presence of closer background objects

Affiliations

Bats pre-adapt sensory acquisition according to target distance prior to takeoff even in the presence of closer background objects

Eran Amichai et al. Sci Rep. .

Abstract

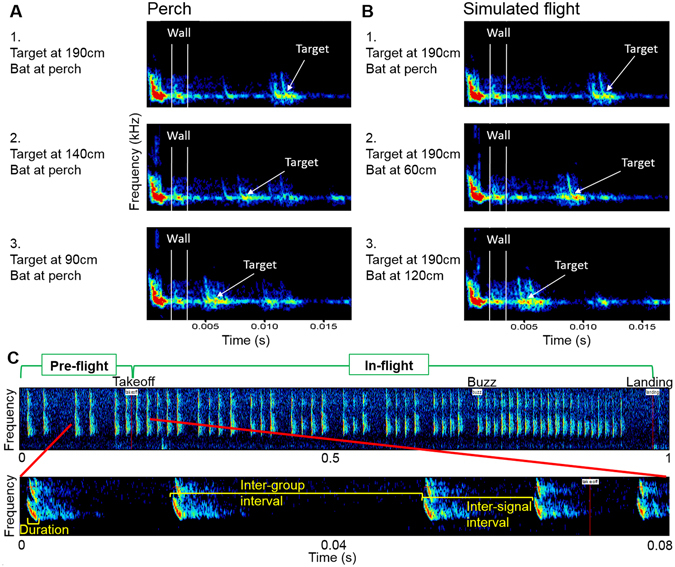
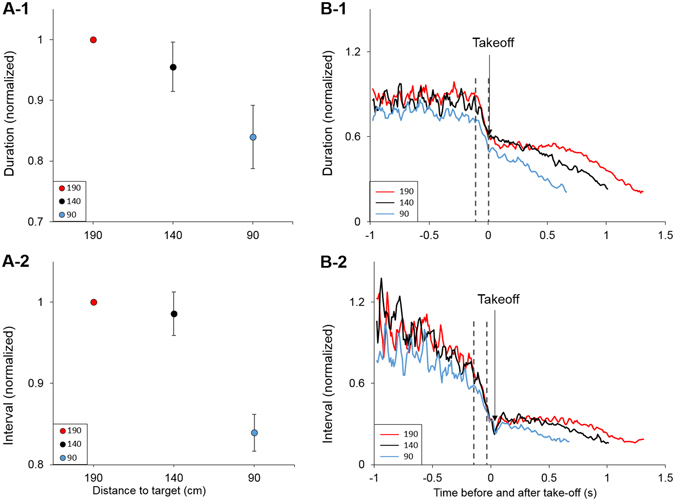
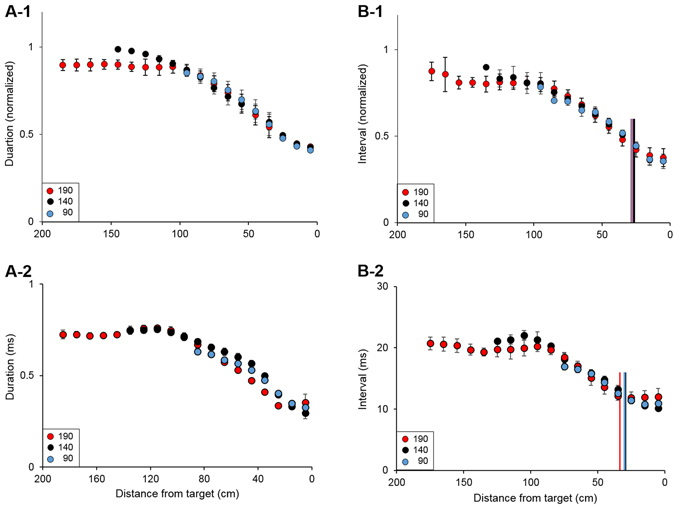
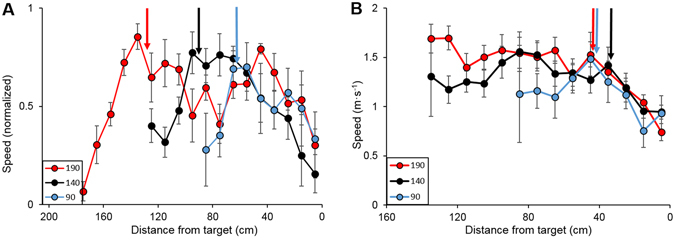
Animals execute sensorimotor sequences to optimize performance of complex actions series. However, the sensory aspects of these sequences and their dynamic control are often poorly understood. We trained bats to fly to targets at different distances, and analysed their sensory behavior before and during flight to test whether they assess target distance before flight and how they adapt sensory acquisition in different situations. We demonstrate that bats' sensory acquisition during approach-flight is more flexible than previously described. We identified acoustic parameters that illustrate that bats assess target distance before takeoff. We show that bats adapt their echolocation approach-sequences to target distance - ignoring closer background objects. At shorter distances, bats initiated their echolocation approach-sequence with distance-appropriate parameters, thus entering the approach sensory sequence "in step". Our results suggest that in order to perform fine flight-manoeuvres, bats must maintain their sensorimotor plan in phase. To do this, they adapt acquisition according to target distance before initiating a complex sensory sequence based on a sensorimotor feedback-loop, even in complex acoustic environments, which impose other sensory reactions and restrictions. Though studying this in non-echolocating animals may prove difficult, such mechanisms are probably widely used in nature whenever complex series of sensorimotor actions are required.


Conflict of interest statement

The authors declare that they have no competing interests.

Figures

Figure 1
Figure 1
Background vs. target echoes and parameters for analysis. Ensonification of the target and the resulting echoes (A,B). Echoes from near background objects reached the bat after 1.7 ms, before those of the target. From the perch (takeoff point) (A), the echoes from the side walls (between white lines) reached the bat well before target echoes (marked by an arrow), whether the target is positioned at 190 cm (A1), 140 cm (A2) or 90 cm (A3). The same is true along a simulated flight path (B) to a target (positioned at 190 cm) from takeoff point (B1), after 60 cm of flight (B2) and after 120 cm of flight (B3). Though background echoes appear weaker than target echoes, this is a result of the higher directionality of the speaker compared to a bat’s echolocation beam (see methods). (C) Acoustic parameters used for analysis: Spectrogram of a typical flight’s echolocation sequence (top), beginning on the wall before takeoff. Notice the buzz- the terminal sequence of signals emitted right before contact with a target (the word Buzz marks its initiation), before the landing (depicted at the end). Enlarged (bottom) is a segment containing the takeoff, illustrating the parameters analyzed in the study: signal duration, interval between signal groups (inter-group interval, used for pre-takeoff analysis) and interval between signals (inter-signal interval, used for in-flight analysis).
Figure 2
Figure 2
Bats assess distance to target before takeoff. (A) Echolocation signal duration (A-1) and interval between signal groups (A-2) are significantly shorter immediately before takeoff when the target is closer. Individual one-way ANOVA followed by Tukey’s post-hoc were performed for each individual for which values distribution was normal. For individuals whose values’ distribution was not normal we performed Kruskal-Wallis ANOVA on ranks followed by Dunn’s post-hoc. In all cases differences were significant between 190 cm and 90 cm. 140 cm was not always significantly different from both 90 and 190. For duration: Bat 1: H = 19.29, df = 2, P < 0.001 (N = 96[190 cm], 15[140 cm], 40[90 cm]). Bat 2: F = 6.77, df = 2, P = 0.002 (N = 19[190 cm], 32[140 cm], 32[90 cm]). Bat 3: F = 23.21, df = 2, P < 0.001 (N = 42[190 cm], 23[140 cm], 22[90 cm]). Bat 4: F = 14.75, df = 2, P < 0.001 (N = 118[190 cm], 65[140 cm], 76[90 cm]). For intervals: Bat 1: F = 4.44, df = 2, P = 0.017 (N = 12[190 cm], 6[140 cm], 34[90 cm]). Bat 2: H = 7.94, df = 2, P = 0.019 (N = 10[190 cm], 19[140 cm], 22[90 cm]). Bat 3: F = 7.04, df = 2, P = 0.03 (N = 18[190 cm], 11[140 cm], 12[90 cm]). Bat 4: H = 6.41, df = 2, P = 0.041 (N = 44[190 cm], 29[140 cm], 35[90 cm]). Statistical analyses were performed on raw individual data. Data were normalized for presentation (due to the differences in absolute individual values). We normalized by dividing each bat’s data by its 190 mean value (thus giving the mean at 190 an absolute value of 1 without variation, hence – no error bars). Data shown are the mean ± se for all bats. (B) Signal duration and intervals between signal groups as a function of time before and after takeoff (time point ‘0’). Longer signals and intervals are evident before takeoff and were probably used to assess the distance. Gray dashed lines mark the location in the sequence of the values shown in panels A-1 and 2. At takeoff there was a dramatic drop in these parameters. The mean of all bats is shown. See also Supplementary Figs S3 and S4.
Figure 3
Figure 3
Bats maintained a fixed approach phase during flight. (A) When flying to a closer target (blue or black circles) the bats started their approach ‘in step’, meaning that signal duration at takeoff was appropriate as if the bat reached this distance at flight from a greater distance. Data are aligned to landing (distance ‘0’), shown are mean ± se, smoothed over a three-window period. A-1 All individuals, normalized data. A-2 An example of one individual. (B) The same strategy was evident with regards to emission rate and buzz initiation distance (vertical lines in panels B1-2, colours encoding is the same as the circles) – intervals between signals at the beginning of flight for a closer target were ‘in step’ as if the bat reached that distance from a farther starting point. Buzz was initiated at a fixed distance from target regardless of total flight distance. B-1 shows normalized data of all bats (normalization is the same as in Fig. A), B-2 is an example of one individual. See also Supplementary Figs S3 and S5.
Figure 4
Figure 4
Bats reduce speed towards landing at a constant distance from target. Speed over distance to target for the 3 different takeoff distances. After initially increasing speed to reach a roughly stable ‘cruising’ speed (end of acceleration marked with correspondingly coloured arrows in panel A), the bats then decreased speed in preparation for landing. This was done at a constant distance from target (on average 50–60 cm), regardless of initial distance at takeoff (marked with arrows on panel B to simplify the presentation). Data are aligned to landing (distance ‘0’), shown are mean ± se. (A) Mean + se for all individuals. Data were normalized by dividing each bat’s average values for a given trial (target distance at takeoff) by the maximum value in that trial. (B) Non-normalized data from one individual. For two individuals the camera did not cover the first 30 cm of the flights to 190 cm.

References

    1. Kalko EV, Schnitzler HU. Plasticity in echolocation signals of European pipistrelle bats in search flight: implications for habitat use and prey detection. Behav. Ecol. Sociobiol. 1993;33:415–428. doi: 10.1007/BF00170257. - DOI
    1. Obrist MK. Flexible bat echolocation: the influence of individual, habitat and conspecifics on sonar signal design. Behav. Ecol. Sociobiol. 1995;36:207–219. doi: 10.1007/BF00177798. - DOI
    1. Jones G, Holderied MW. Bat echolocation calls: adaptation and convergent evolution. Proc. R. Soc. Lond. B: Biol. Sci. 2007;274:905–912. doi: 10.1098/rspb.2006.0200. - DOI - PMC - PubMed
    1. Schmieder DA, Kingston T, Hashim R, Siemers BM. Breaking the trade-off: rainforest bats maximize bandwidth and repetition rate of echolocation calls as they approach prey. Biol. Lett. 2010;6:604–609. doi: 10.1098/rsbl.2010.0114. - DOI - PMC - PubMed
    1. Simmons J, Fenton M, O’Farrell M. Echolocation and pursuit of prey by bats. Science. 1979;203:16–21. doi: 10.1126/science.758674. - DOI - PubMed

Publication types

LinkOut - more resources