Fixed-dose combination orally disintegrating tablets to treat cardiovascular disease: formulation, in vitro characterization and physiologically based pharmacokinetic modeling to assess bioavailability
- PMID: 28352156
- PMCID: PMC5358997
- DOI: 10.2147/DDDT.S126035
Fixed-dose combination orally disintegrating tablets to treat cardiovascular disease: formulation, in vitro characterization and physiologically based pharmacokinetic modeling to assess bioavailability
Abstract
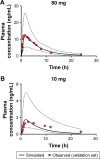
Cardiovascular disease (CVD) is the leading cause of death among men and women worldwide. In CVD, hypertension and dyslipidemia commonly coexist and are managed through coadministration of amlodipine and atorvastatin, respectively. The case for fixed-dose combination (FDC) oral dosage forms and orally disintegrating tablet (ODT) technology to enhance outcomes and compliance is strong. This work follows the development and characterization of single and FDC ODTs containing amlodipine and atorvastatin, followed by bioequivalence comparison between these single and FDC formulations, using in vitro dissolution and Caco-2 apparent permeability (Papp) and in silico physiologically based pharmacokinetic modeling approaches. ODTs containing amlodipine (5 mg) and atorvastatin (10 mg) either alone or in combination rapidly disintegrated (<30 s) while displaying a radial crushing strength in excess of 100 N and friability ≤1%. In vitro dissolution test was performed in fasted and fed-state simulated intestinal fluid (FeSSIF) and analyzed using high-performance liquid chromatography. Dissolution profiles for single and FDC ODTs were compared using US FDA recommended difference (f1) and similarity (f2) factor testing for bioequivalence. In all cases, there was no difference in active pharmaceutical ingredient dissolution between single or FDC ODTs, with the exception of amlodipine in FeSSIF. Pharmacokinetic clinical trial simulations were conducted using Simcyp (Version 14), incorporating Papp and dissolution data. Simulated clinical trials in healthy volunteers showed no difference in bioavailability based on pharmacokinetic parameters between single and combination doses with either active pharmaceutical ingredient. An increase in Cmax and AUC for atorvastatin in fed subjects was attributed to extended transit along the gut lumen and reduced atorvastatin metabolism due to lower CYP3A4 expression at more distal small intestine absorption sites. The results demonstrated bioequivalence of an FDC ODT for amlodipine and atorvastatin, while highlighting several limitations of f1 and f2 bioequivalence testing and strengths of mechanistic pharmacokinetic modeling for oral drug absorption.
Keywords: bioavailability; bioequivalence; cardiovascular disease; fixed-dose combination; orally disintegrating tablet; physiologically based pharmacokinetic modeling.
Conflict of interest statement
Disclosure The authors report no conflicts of interest in this work.
Figures


Similar articles
-
Formulation and Bioequivalence Testing of Fixed-Dose Combination Orally Disintegrating Tablets for the Treatment of Tuberculosis in the Paediatric Population.J Pharm Sci. 2020 Oct;109(10):3105-3113. doi: 10.1016/j.xphs.2020.07.016. Epub 2020 Jul 22. J Pharm Sci. 2020. PMID: 32710905
-
Comparison of Pharmacokinetics of a Fixed-Dose Combination of Amlodipine/Losartan/Rosuvastatin with Concomitant Administration of Amlodipine/Losartan and Rosuvastatin in Healthy Volunteers.Drug Des Devel Ther. 2020 Feb 19;14:661-668. doi: 10.2147/DDDT.S233014. eCollection 2020. Drug Des Devel Ther. 2020. PMID: 32109991 Free PMC article. Clinical Trial.
-
Pharmacokinetic comparison of 2 fixed-dose combination tablets of amlodipine and valsartan in healthy male Korean volunteers: a randomized, open-label, 2-period, single-dose, crossover study.Clin Ther. 2013 Jul;35(7):934-40. doi: 10.1016/j.clinthera.2013.05.021. Clin Ther. 2013. PMID: 23870605 Clinical Trial.
-
Amlodipine/Atorvastatin: a review of its use in the treatment of hypertension and dyslipidaemia and the prevention of cardiovascular disease.Drugs. 2010;70(2):191-213. doi: 10.2165/11204420-000000000-00000. Drugs. 2010. PMID: 20108992 Review.
-
Amlodipine/atorvastatin fixed-dose combination: a review of its use in the prevention of cardiovascular disease and in the treatment of hypertension and dyslipidemia.Am J Cardiovasc Drugs. 2008;8(1):51-67. doi: 10.2165/00129784-200808010-00007. Am J Cardiovasc Drugs. 2008. PMID: 18303938 Review.
Cited by
-
Guiding dose adjustment of amlodipine after co-administration with ritonavir containing regimens using a physiologically-based pharmacokinetic/pharmacodynamic model.J Pharmacokinet Pharmacodyn. 2018 Jun;45(3):443-456. doi: 10.1007/s10928-018-9574-0. Epub 2018 Feb 9. J Pharmacokinet Pharmacodyn. 2018. PMID: 29427135 Free PMC article.
-
Method development for simultaneous estimation of Amlodipine Besylate and Perindopril Tertbutyl amine in fixed-dose.Heliyon. 2023 Mar 1;9(3):e14209. doi: 10.1016/j.heliyon.2023.e14209. eCollection 2023 Mar. Heliyon. 2023. PMID: 36923897 Free PMC article.
-
Effects of Ginkgo leaf tablets on the pharmacokinetics of atovastatin in rats.Pharm Biol. 2019 Dec;57(1):403-406. doi: 10.1080/13880209.2019.1622569. Pharm Biol. 2019. PMID: 31188698 Free PMC article.
-
Effects of Danshen tablets on pharmacokinetics of atorvastatin calcium in rats and its potential mechanism.Pharm Biol. 2018 Dec;56(1):104-108. doi: 10.1080/13880209.2018.1424209. Pharm Biol. 2018. PMID: 29322864 Free PMC article.
-
In Vitro Dissolution and in Silico Modeling Shortcuts in Bioequivalence Testing.Pharmaceutics. 2020 Jan 4;12(1):45. doi: 10.3390/pharmaceutics12010045. Pharmaceutics. 2020. PMID: 31947944 Free PMC article. Review.
References
-
- Mozaffarian D, Benjamin EJ, Go AS, et al. American Heart Association Statistics Committee and Stroke Statistics Subcommittee Heart disease and stroke statistics – 2015 update: a report from the American Heart Association. Circulation. 2015;131(4):e29–e322. - PubMed
-
- Ivanovic B, Tadic M. Fixed combination of amlodipine/atorvastatin from mechanisms to trials. J Cardiovasc Pharmacol Ther. 2013;18(6):544–549. - PubMed
-
- Curran MP. Amlodipine/atorvastatin: a review of its use in the treatment of hypertension and dyslipidaemia and the prevention of cardiovascular disease. Drugs. 2010;70(2):191–213. - PubMed
-
- Kannel WB. Risk stratification in hypertension: new insights from the Framingham Study. Am J Hypertens. 2000;13(1 Pt 2):3s–10s. - PubMed
-
- Johnson ML, Pietz K, Battleman DS, Beyth RJ. Prevalence of comorbid hypertension and dyslipidemia and associated cardiovascular disease. Am J Manag Care. 2004;10(12):926–932. - PubMed
Publication types
MeSH terms
Substances
LinkOut - more resources
Full Text Sources
Other Literature Sources
Miscellaneous

