

Embedding and Chemical Reactivation of Green Fluorescent Protein in the Whole Mouse Brain for Optical Micro-Imaging
- PMID: 28352214
- PMCID: PMC5349086
- DOI: 10.3389/fnins.2017.00121
Embedding and Chemical Reactivation of Green Fluorescent Protein in the Whole Mouse Brain for Optical Micro-Imaging
Abstract
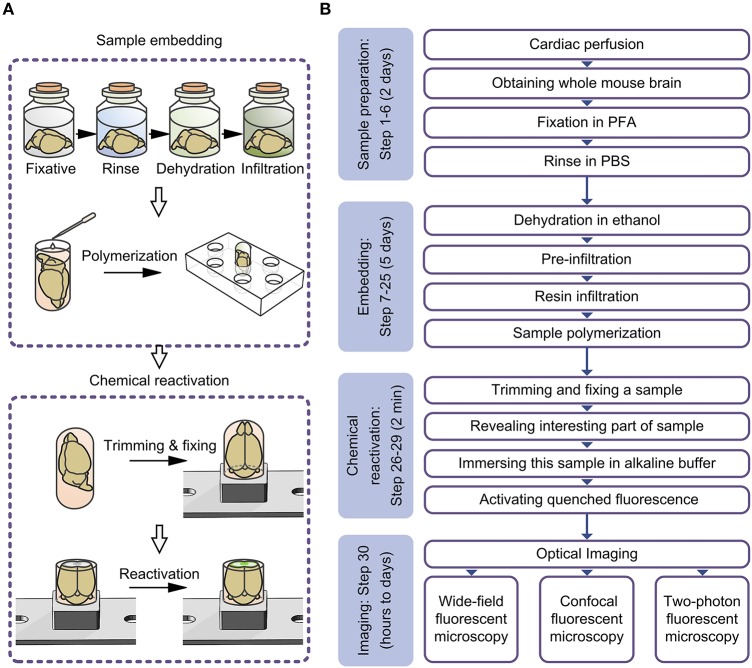
Resin embedding has been widely applied to fixing biological tissues for sectioning and imaging, but has long been regarded as incompatible with green fluorescent protein (GFP) labeled sample because it reduces fluorescence. Recently, it has been reported that resin-embedded GFP-labeled brain tissue can be imaged with high resolution. In this protocol, we describe an optimized protocol for resin embedding and chemical reactivation of fluorescent protein labeled mouse brain, we have used mice as experiment model, but the protocol should be applied to other species. This method involves whole brain embedding and chemical reactivation of the fluorescent signal in resin-embedded tissue. The whole brain embedding process takes a total of 7 days. The duration of chemical reactivation is ~2 min for penetrating 4 μm below the surface in the resin-embedded brain. This protocol provides an efficient way to prepare fluorescent protein labeled sample for high-resolution optical imaging. This kind of sample was demonstrated to be imaged by various optical micro-imaging methods. Fine structures labeled with GFP across a whole brain can be detected.
Keywords: chemical reactivation; embedding; fluorescent proteins; micro-imaging; whole mouse brain.
Figures


Similar articles
-
Simultaneous Acquisition of Multicolor Information From Neural Circuits in Resin-Embedded Samples.Front Neurosci. 2018 Nov 30;12:885. doi: 10.3389/fnins.2018.00885. eCollection 2018. Front Neurosci. 2018. PMID: 30555296 Free PMC article.
-
Penetration model for chemical reactivation for resin-embedded green fluorescent protein imaging.J Biomed Opt. 2018 Nov;24(5):1-6. doi: 10.1117/1.JBO.24.5.051406. J Biomed Opt. 2018. PMID: 30484293 Free PMC article.
-
Chemical reactivation of fluorescein isothiocyanate immunofluorescence-labeled resin-embedded samples.J Biomed Opt. 2018 Feb;23(2):1-4. doi: 10.1117/1.JBO.23.2.020501. J Biomed Opt. 2018. PMID: 29427410
-
Application of fluorescence micro-optical sectioning tomography in the cerebrovasculature and applicable vascular labeling methods.Brain Struct Funct. 2023 Sep;228(7):1619-1627. doi: 10.1007/s00429-023-02684-1. Epub 2023 Jul 23. Brain Struct Funct. 2023. PMID: 37481741 Review.
-
One for All, All for One: A Close Look at In-Resin Fluorescence Protocols for CLEM.Front Cell Dev Biol. 2022 Jun 30;10:866472. doi: 10.3389/fcell.2022.866472. eCollection 2022. Front Cell Dev Biol. 2022. PMID: 35846358 Free PMC article. Review.
Cited by
-
Genetic Single Neuron Anatomy Reveals Fine Granularity of Cortical Axo-Axonic Cells.Cell Rep. 2019 Mar 12;26(11):3145-3159.e5. doi: 10.1016/j.celrep.2019.02.040. Cell Rep. 2019. PMID: 30865900 Free PMC article.
-
Pinpointing Morphology and Projection of Excitatory Neurons in Mouse Visual Cortex.Front Neurosci. 2019 Aug 29;13:912. doi: 10.3389/fnins.2019.00912. eCollection 2019. Front Neurosci. 2019. PMID: 31555081 Free PMC article.
-
DeepBouton: Automated Identification of Single-Neuron Axonal Boutons at the Brain-Wide Scale.Front Neuroinform. 2019 Apr 18;13:25. doi: 10.3389/fninf.2019.00025. eCollection 2019. Front Neuroinform. 2019. PMID: 31105547 Free PMC article.
-
Anatomically revealed morphological patterns of pyramidal neurons in layer 5 of the motor cortex.Sci Rep. 2020 May 13;10(1):7916. doi: 10.1038/s41598-020-64665-2. Sci Rep. 2020. PMID: 32405029 Free PMC article.
-
Reconstruction of Intratelencephalic Neurons in the Mouse Secondary Motor Cortex Reveals the Diverse Projection Patterns of Single Neurons.Front Neuroanat. 2018 Oct 30;12:86. doi: 10.3389/fnana.2018.00086. eCollection 2018. Front Neuroanat. 2018. PMID: 30425624 Free PMC article.
References
-
- Echlin P. (2009). Handbook of Sample Preparation for Scanning Electron Microscopy and X-Ray Microanalysis. New York, NY: Springer Science and Business Media Press.
LinkOut - more resources
Full Text Sources
Other Literature Sources