. 2017 Mar 14:9:61.
doi: 10.3389/fnagi.2017.00061. eCollection 2017.

A Novel Genetic Screen Identifies Modifiers of Age-Dependent Amyloid β Toxicity in the Drosophila Brain

Affiliations

A Novel Genetic Screen Identifies Modifiers of Age-Dependent Amyloid β Toxicity in the Drosophila Brain

Lautaro F Belfiori-Carrasco et al. Front Aging Neurosci. .

Abstract

The accumulation of amyloid β peptide (Aβ) in the brain of Alzheimer's disease (AD) patients begins many years before clinical onset. Such process has been proposed to be pathogenic through the toxicity of Aβ soluble oligomers leading to synaptic dysfunction, phospho-tau aggregation and neuronal loss. Yet, a massive accumulation of Aβ can be found in approximately 30% of aged individuals with preserved cognitive function. Therefore, within the frame of the "amyloid hypothesis", compensatory mechanisms and/or additional neurotoxic or protective factors need to be considered and investigated. Here we describe a modifier genetic screen in Drosophila designed to identify genes that modulate toxicity of Aβ42 in the CNS. The expression of Aβ42 led to its accumulation in the brain and a moderate impairment of negative geotaxis at 18 days post-eclosion (d.p.e) as compared with genetic or parental controls. These flies were mated with a collection of lines carrying chromosomal deletions and negative geotaxis was assessed at 5 and 18 d.p.e. Our screen is the first to take into account all of the following features, relevant to sporadic AD: (1) pan-neuronal expression of wild-type Aβ42; (2) a quantifiable complex behavior; (3) Aβ neurotoxicity associated with progressive accumulation of the peptide; and (4) improvement or worsening of climbing ability only evident in aged animals. One hundred and ninety-nine deficiency (Df) lines accounting for ~6300 genes were analyzed. Six lines, including the deletion of 52 Drosophila genes with human orthologs, significantly modified Aβ42 neurotoxicity in 18-day-old flies. So far, we have validated CG11796 and identified CG17249 as a strong candidate (whose human orthologs are HPD and PRCC, respectively) by using RNAi or mutant hemizygous lines. PRCC encodes proline-rich protein PRCC (ppPRCC) of unknown function associated with papillary renal cell carcinoma. HPD encodes 4-hydroxyphenylpyruvate dioxygenase (HPPD), a key enzyme in tyrosine degradation whose Df causes autosomal recessive Tyrosinemia type 3, characterized by mental retardation. Interestingly, lines with a partial Df of HPD ortholog showed increased intraneuronal accumulation of Aβ42 that coincided with geotaxis impairment. These previously undetected modifiers of Aβ42 neurotoxicity in Drosophila warrant further study to validate their possible role and significance in the pathogenesis of sporadic AD.

Keywords: Alzheimer’s disease; Drosophila; amyloid β; dementia; genetic screen; neurodegeneration.


Figures

Figure 1
Figure 1
Flow chart illustrating the overall strategy and steps of the modifier genetic screen. In stage I, G4 > amyloid β peptide 1-42 (Aβ42) line was compared to each of the G4 > Aβ42/Deficiency (Df) lines in a single negative geotaxis experiment. *In stage II, those G4 > Aβ/Df lines selected in stage I were examined in three independent biological experiments for statistical significance at 18 days post eclosion (d.p.e), (one-way ANOVA followed by least significant difference (LSD) Fisher’s test p < 0.05). **Human orthologs were defined as those with the highest score according to Drosophila RNAi Screen Center (DRSC) integrative ortholog prediction tool (DIOPT). Depending on the number of deleted orthologs (> or ≤ 10), Df lines were selected for stage III or back to stage II analysis with overlapping deletions to narrow down the number of candidates (***Overlapping deletions were compared in three independent biological experiments).
Figure 2
Figure 2
(A) Representative Western blot of fly brain homogenates at 5 and 18 d.p.e showing Aβ42 expression detected with anti-Aβ monoclonal antibody 6E10. The 4.5 kDa band (arrow) indicates Aβ42 correctly processed in the secretory pathway. The arrowhead indicates a band consistent with sodium dodecyl sulfate (SDS)-resistant Aβ42 oligomers. A G4>+ brain homogenate was spiked with synthetic Aβ1-42 (Aβ42 Synt.) for electrophoretic mobility control. Membrane was cut above the 31 kDa marker and probed with anti-actin for normalization. (B) Quantification of Aβ42 levels relative to actin in arbitrary units (A.U.). Bars represent the mean ± SEM from three independent experiments; **p < 0.01 (Student’s t-test). (C) Pan-neuronal Aβ42-expressing flies (G4 > Aβ42) showed climbing impairment at 18 d.p.e as compared with genetic controls (G4>+ and +>Aβ42). Bars represent the mean ± SEM from at least three independent biological experiments; ***p < 0.001 (repeated measures [RM] two-way ANOVA followed by Bonferroni’s post hoc test).
Figure 3
Figure 3
Negative geotaxis assay of G4 > Aβ42 compared to G4 > Aβ42/Df at 5 and 18 d.p.e. The graphic shows examples of the three possible outcomes according to the quantitative criterion of at least a 50% difference in negative geotaxis (dashed lines): Df 29667 had no modifier effect, Df 27917 worsened and Df 7681 improved the climbing ability of Aβ42-expressing flies at 18 d.p.e. Bars represent the mean ± SEM from a single biological experiment (five technical repeats) and therefore, at this stage of the screen, no statistical analyses were performed.
Figure 4
Figure 4
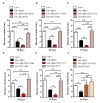
Negative geotaxis assay of G4>+, G4 > Aβ42, G4 > Aβ42/Df and G4 > Df at 18 d.p.e. (A) Df 24392; (B) Df 27369; (C) Df 27372; (D) Df 27404; and (E) Df 27917, worsened the Aβ42-induced phenotype. (F) Df 7681 improved the climbing ability of Aβ42-expressing flies. Df lines had no effect in the absence of Aβ expression. Bars represent the mean ± SEM from at least three independent biological experiments; *p < 0.5, **p < 0.01, ***p < 0.001 (RM one-way ANOVA followed by LSD Fisher’s test).
Figure 5
Figure 5
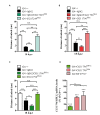
Mutants and RNAi of candidate genes enhance Aβ toxicity. (A) CG17249 hemizygous mutant (human ortholog, PRCC); (B) CG11796 hemizygous mutant (human ortholog, HPD) and (C) CG11796 RNAi. Mutant and RNAi lines had no effect in the absence of Aβ42 expression. Bars represent mean ± SEM from at least three independent biological experiments; *p < 0.5; **p < 0.01; ***p < 0.001 (one-way ANOVA followed by LSD Fisher’s test). (D) Quantification of CG11796 endogenous mRNA showed a ~40%–50% reduction in Df 27917 and CG11796Mut lines, while for CG11796RNAi a ~ 85% reduction was observed. Brain samples were taken from 5 day-old flies and RPL32 mRNA was used for normalization in each quantitative real-time PCR (qRT-PCR) assay. ***p < 0.001 for Df 27917, CG11796Mut and CG11796RNAi as compared to G4>+. *p < 0.05 (RM one-way ANOVA followed by LSD Fisher’s test from three independent biological experiments).
Figure 6
Figure 6
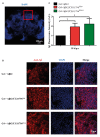
Immunofluorescence of Aβ deposits in the brains of transgenic lines. (A) Representative image of a brain section at low magnification stained with DAPI. The red square depicts the region used for quantification in each genotype. Scale bar = 100 μm. (B) Representative images of the selected region as in panel (A) showing from left to right: anti-Aβ, DAPI nuclear staining and the merge of both signals. Scale bar = 10 μm. Genotypes G4 > Aβ42, G4 > Aβ42/CG11796Mut and G4 > Aβ42/CG11796 RNAi are shown. (C) Quantification of Aβ fluorescence intensity normalized to G4 > Aβ42 in A.U. showing the increment induced by CG11796 mRNA reduction. Bars represent the mean-ratio ± SEM of three independent experiments; *p < 0.05 (Wilcoxon test).
Figure 7
Figure 7
Western blot of Aβ accumulation in the brain of CG11796 RNAi and mutant lines. (A) Representative Western blot of fly brain homogenates in RIPA buffer at 18 d.p.e showing Aβ42 expression detected with monoclonal antibody 6E10. The arrow indicates Aβ42 monomers. Membranes were cut above the 31 kDa marker and probed with anti-actin for normalization. (B) Quantification of Aβ42 levels relative to actin in A.U. normalized to G4 > Aβ42 showing the increase of Aβ42 in CG11796 mutant and RNAi lines. Bars represent the mean-ratio ± SEM of three independent experiments; *p < 0.05 (Wilcoxon test).
Figure 8
Figure 8
Negative thioflavine S (ThS) staining of Aβ42 transgenic flies brains. (A–C) Representative images of ThS staining of fly brains at 18 d.p.e from G4 > Aβ42, G4 > Aβ42/CG11796Mut and G4 > Aβ42/CG11796RNAi showing no detection of amyloid fibrils. Scale bar = 100 μm. (D) A brain section of transgenic mouse Tg2576 showing ThS-positive plaques (arrows) is shown for comparison. Scale bar = 500 μm.
Figure 9
Figure 9
Brain vacuolization in Aβ-expressing lines alone and in a background of CG11796 Df. (A) Representative whole brain section of G4>+ stained with H&E used for tissue loss analysis by bright-field microscopy. The rectangle demarcates a typical area with a high number of neuronal bodies. (B) The region depicted in (A) is shown for each genotype. Arrows indicate vacuoles with a diameter of at least 3 μm. Scale bar = 50 μm. (C) Quantification of tissue loss in hemi-brains was calculated as the percentage of the section area occupied by vacuoles. Flies expressing Aβ42 showed increased vacuolization as compared to control flies G4>+. No differences were found in G4 > Aβ42/CG11796Mut and G4 > Aβ42/CG11796RNAi compared with G4 > Aβ42. ***p < 0.001 (one way ANOVA followed by Tukey’s post hoc test).

Similar articles

Cited by

References

    1. Aksenov M., Aksenova M., Butterfield D. A., Markesbery W. R. (2000). Oxidative modification of creatine kinase BB in Alzheimer’s disease brain. J. Neurochem. 74, 2520–2527. 10.1046/j.1471-4159.2000.0742520.x - DOI - PubMed
    1. Aksenov M. Y., Aksenova M. V., Markesbery W. R., Butterfield D. A. (1998). Amyloid β-peptide (1–40)-mediated oxidative stress in cultured hippocampal neurons. Protein carbonyl formation, CK BB expression and the level of Cu, Zn and Mn SOD mRNA. J. Mol. Neurosci. 10, 181–192. 10.1007/bf02761773 - DOI - PubMed
    1. Attrill H., Falls K., Goodman J. L., Millburn G. H., Antonazzo G., Rey A. J., et al. . (2016). FlyBase: establishing a gene group resource for Drosophila melanogaster. Nucl. Acids Res. 44, D786–D792. 10.1093/nar/gkv1046 - DOI - PMC - PubMed
    1. Bennett D. A., Schneider J. A., Arvanitakis Z., Kelly J. F., Aggarwal N. T., Shah R. C., et al. . (2006). Neuropathology of older persons without cognitive impairment from two community-based studies. Neurology 66, 1837–1844. 10.1212/01.WNL.0000219668.47116.e6 - DOI - PubMed
    1. Bouleau S., Tricoire H. (2015). Drosophila models of Alzheimer’s disease: advances, limits and perspectives. J. Alzheimers Dis. 45, 1015–1038. 10.3233/JAD-142802 - DOI - PubMed

LinkOut - more resources