. 2017 Feb 9;10(4):348-365.
doi: 10.1111/eva.12454. eCollection 2017 Apr.

Keeping things local: Subpopulation Nb and Ne in a stream network with partial barriers to fish migration

Affiliations

Keeping things local: Subpopulation Nb and Ne in a stream network with partial barriers to fish migration

Andrew R Whiteley et al. Evol Appl. .

Abstract

For organisms with overlapping generations that occur in metapopulations, uncertainty remains regarding the spatiotemporal scale of inference of estimates of the effective number of breeders (N^b) and whether these estimates can be used to predict generational Ne. We conducted a series of tests of the spatiotemporal scale of inference of estimates of Nb in nine consecutive cohorts within a long-term study of brook trout (Salvelinus fontinalis). We also tested a recently developed approach to estimate generational Ne from N^b and compared this to an alternative approach for estimating N^e that also accounts for age structure. Multiple lines of evidence were consistent with N^b corresponding to the local (subpopulation) spatial scale and the cohort-specific temporal scale. We found that at least four consecutive cohort-specific estimates of N^b were necessary to obtain reliable estimates of harmonic mean N^b for a subpopulation. Generational N^e derived from cohort-specific N^b was within 7%-50% of an alternative approach to obtain N^e, suggesting some population specificity for concordance between approaches. Our results regarding the spatiotemporal scale of inference for Nb should apply broadly to many taxa that exhibit overlapping generations and metapopulation structure and point to promising avenues for using cohort-specific N^b for local-scale genetic monitoring.

Keywords: brook trout; effective number of breeders; effective population size; linkage disequilibrium; metapopulation; salmonid; stream fishes; temporal estimator.


Figures
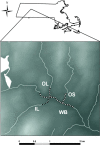
Figure 1
Figure 1
Map of study area of the West Brook, Massachusetts, USA. Brook trout were sampled four times per year from the black and white highlighted area. Natural waterfalls that serve as barriers to fish movement occur at the upstream extent of the highlighted portions of OS, OL, and IL, and at the mouth of IL. The tributaries empty into WB and the direction of stream flow is from left to right for WB. PIT tag antennas are located at the upper end of the study reach (WB) and the mouth of tributaries (OS, OL, IL)
Figure 2
Figure 2
Proportion of the genome (q) of each individual assigned by STRUCTURE to each subpopulation within a Massachusetts metapopulation. Results are shown for the = 3 model for a representative (2005) cohort; all cohorts are shown in Fig. S2. This analysis is based on one YOY randomly selected per full‐sib family. Each bar (column) represents one individual sampled in 2005 from OL, WB, OS, or IL
Figure 3
Figure 3
N^bLDNe within subpopulations of a Massachusetts brook trout metapopulation based on entire cohort samples. N^bLDNe is shown separately for WB/OS (gray triangles), OL (gray circles), and IL (black squares) for each cohort (x‐axis). 95% confidence intervals are based on jackknifing over individuals. The upper limit on the confidence interval for OL in 2006 was infinity, and all other upper confidence limits were finite
Figure 4
Figure 4
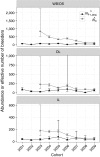
Estimates of N^bLDNe and adult abundance (N^C) over time within the three subpopulations of a Massachusetts brook trout metapopulation. N^bLDNe is shown with black‐filled circles. N^C is shown with gray triangles. N^C is lagged by 1 year relative to the spring‐defined birth year of cohorts; that is, N^C represents the fall from the year prior to the year shown on the x‐axis. 95% confidence intervals are based on jackknifing over individuals. The upper limit on the confidence interval for OL in 2006 was infinity, and all other upper confidence limits were finite
Figure 5
Figure 5
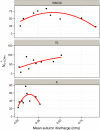
Relationship between autumn stream flow (discharge) and N^bLDNe in subpopulations within a Massachusetts brook trout metapopulation. Mean autumn discharge is the average of mean daily discharge taken from 1 October to 31 December (when reproduction occurred) in the year preceding a spring‐born cohort. The regression lines show a fitted linear model with quadratic term
Figure 6
Figure 6
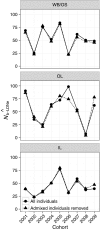
The effect of admixture on N^bLDNe. Shown are estimates of N^bLDNe with all individuals (solid lines connecting circles) from each cohort or with admixed (.3 < < .7) individuals removed (dashed lines connecting triangles) for each of the three subpopulations
Figure 7
Figure 7
The effect of population subdivision on N^bLDNe. All individuals from WB/OS cohorts were used to estimate N^bLDNe (WB/OS). Individuals from divergent subpopulations OL and IL were added separately or jointly to WB/OS to test for an effect of mixing populations on N^bLDNe for each cohort
Figure 8
Figure 8
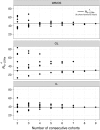
Test of the number of consecutive cohorts needed to reliably estimate N^bLDNe for each of the three brook trout subpopulations. The x‐axis represents the number of consecutive cohorts subsampled (from two successive cohorts to nine). The y‐axis shows the harmonic mean of the N^bLDNe obtained from each of the successive cohorts subsampled. All possible successive subsets for each value of consecutive cohorts were obtained. For example, there were eight possible consecutive cohorts of size two for the nine cohorts. The harmonic mean of all nine cohorts is shown with a horizontal line. This value must equal the value of consecutive cohorts = 9, by definition, and is shown for heuristic purpose
Figure 9
Figure 9
Test of the number of consecutive cohorts needed to reliably estimate N^e(Adj) from N^bLDNe for each of the three brook trout subpopulations. The x‐axis represents the number of consecutive cohorts subsampled (from two successive cohorts to nine). The y‐axis shows N^e following the Waples et al. (2014) approach. The harmonic means of the N^bLDNe obtained from subsampled successive cohorts were used to obtain N^e(Adj). All possible successive subsets for each value of consecutive cohorts were obtained. Overall N^eJR obtained with the Jorde and Ryman (Jorde and Ryman (1995) approach is shown with a horizontal line

References

    1. Allendorf, F. W. , & Phelps, S. R. (1981). Use of allelic frequencies to describe population structure. Canadian Journal of Fisheries and Aquatic Sciences, 38, 1507–1514.
    1. Anderson, E. C. , & Dunham, K. K. (2008). The influence of family groups on inferences made with the program Structure. Molecular Ecology Resources, 8(6), 1219–1229. - PubMed
    1. Annett, B. , Gerlach, G. , King, T. L. , & Whiteley, A. R. (2012). Conservation genetics of remnant coastal brook trout populations at the southern limit of their distribution: Population structure and effects of stocking. Transactions of the American Fisheries Society, 141, 1399–1410.
    1. Bassar, R. D. , Letcher, B. H. , Nislow, K. H. , & Whiteley, A. R. (2016). Hanges in seasonal climate outpace compensatory density‐dependence in eastern brook trout. Global Change Biology, 22(2), 577–593. - PubMed
    1. Caswell, H. (2001). Matrix population models: Construction, analysis, and interpretation. Sunderland, MA: Sinauer Associates.

LinkOut - more resources