. 2017 Mar 23;2(6):e83527.
doi: 10.1172/jci.insight.83527.

Attenuated and vectored vaccines protect nonhuman primates against Chikungunya virus

Affiliations

Attenuated and vectored vaccines protect nonhuman primates against Chikungunya virus

Pierre Roques et al. JCI Insight. .

Abstract

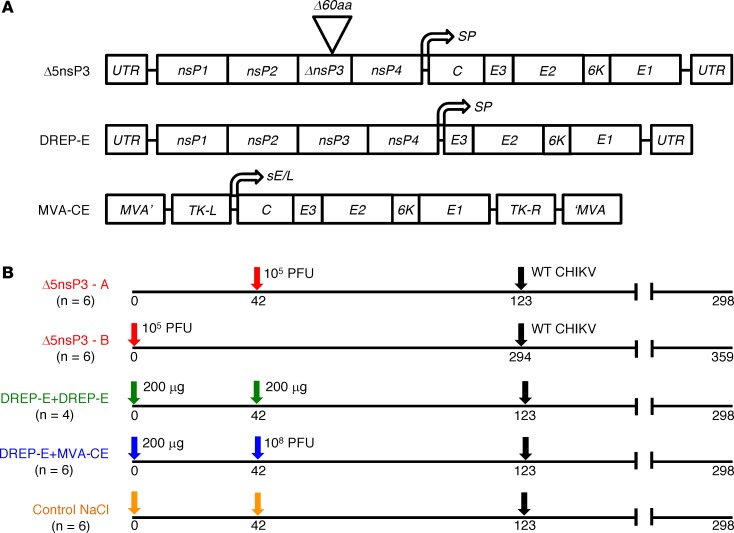
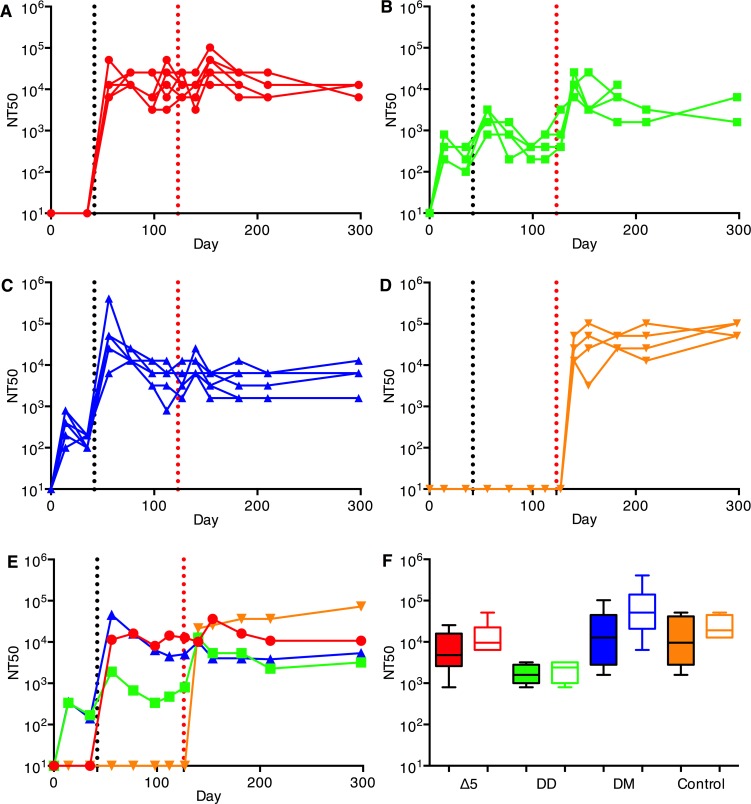
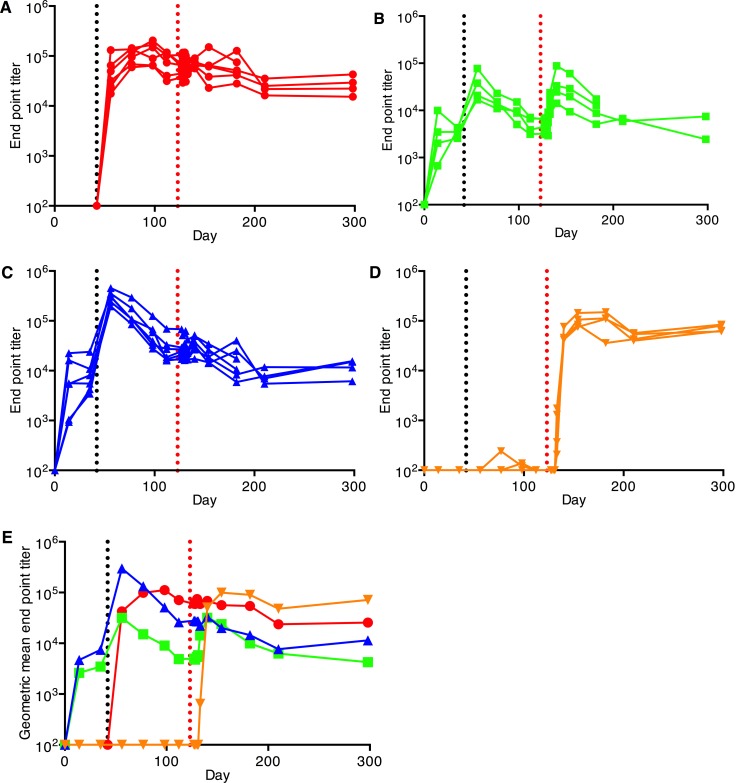
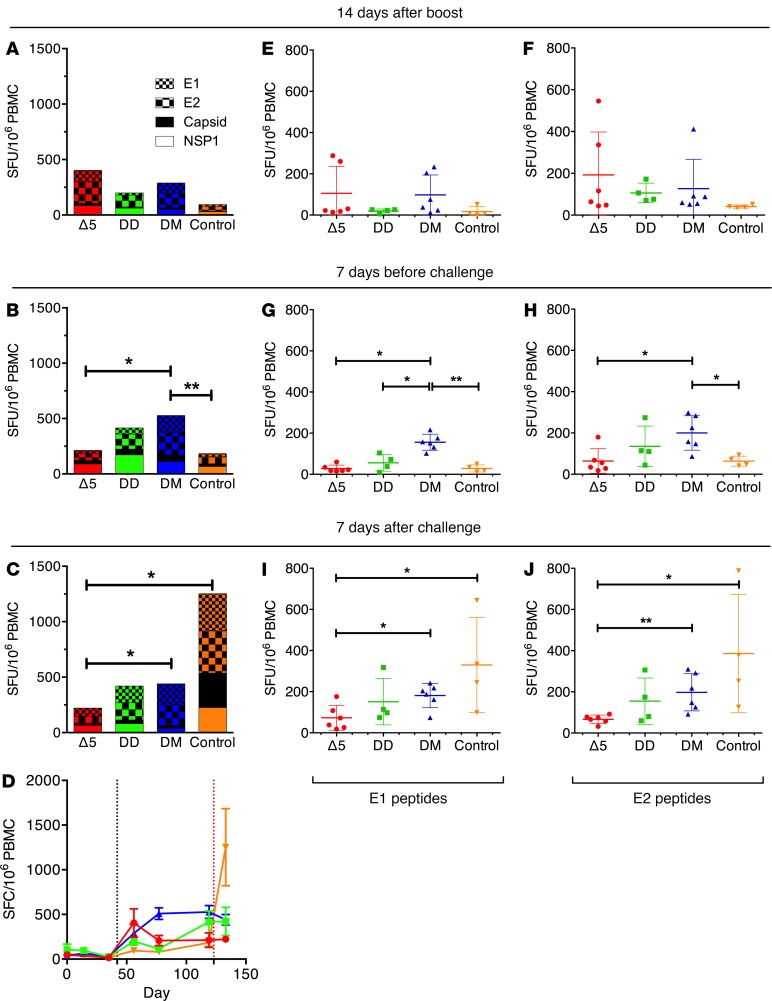
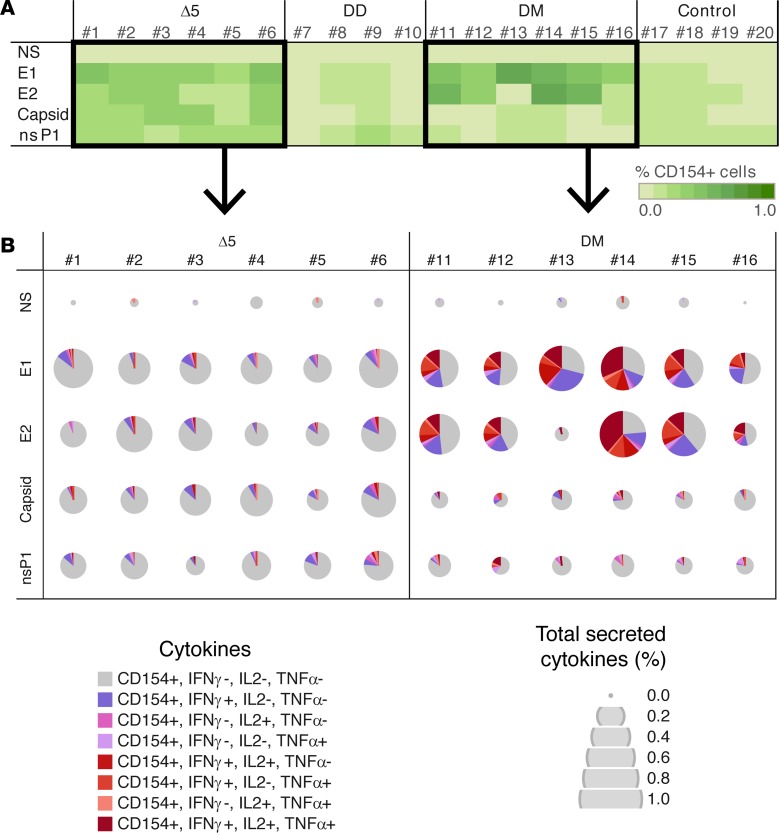
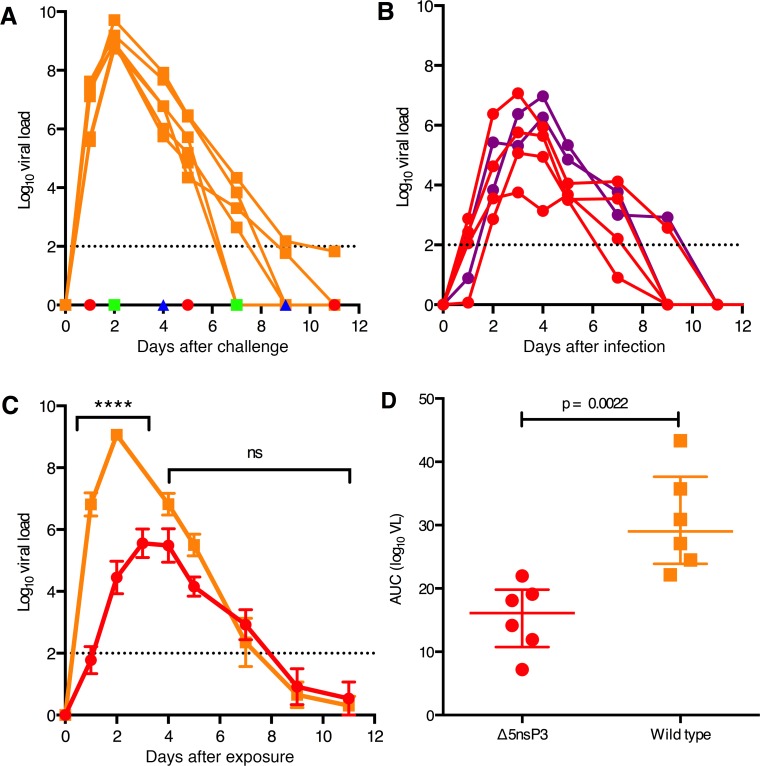
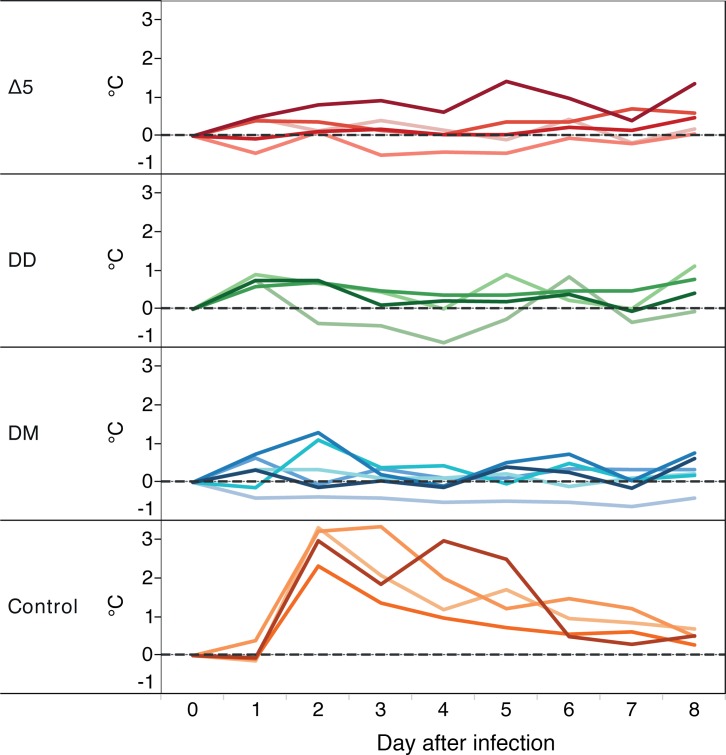
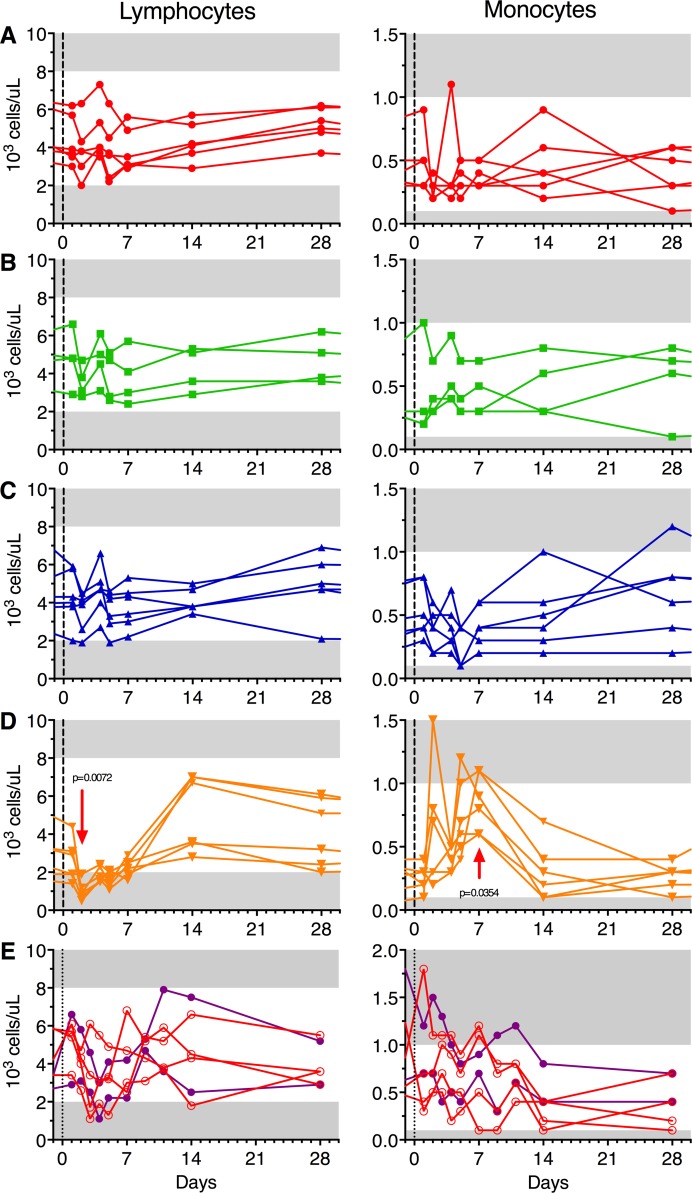
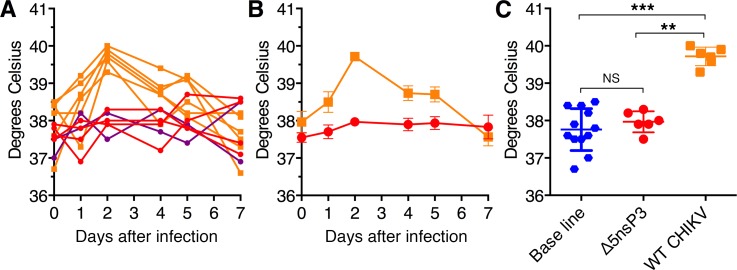
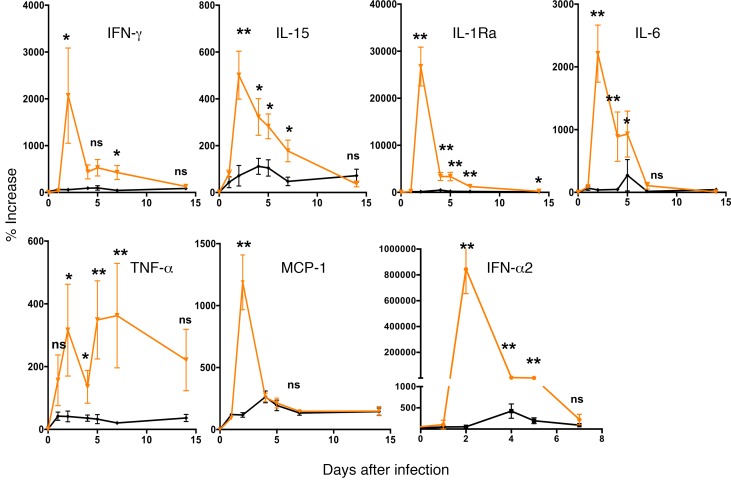
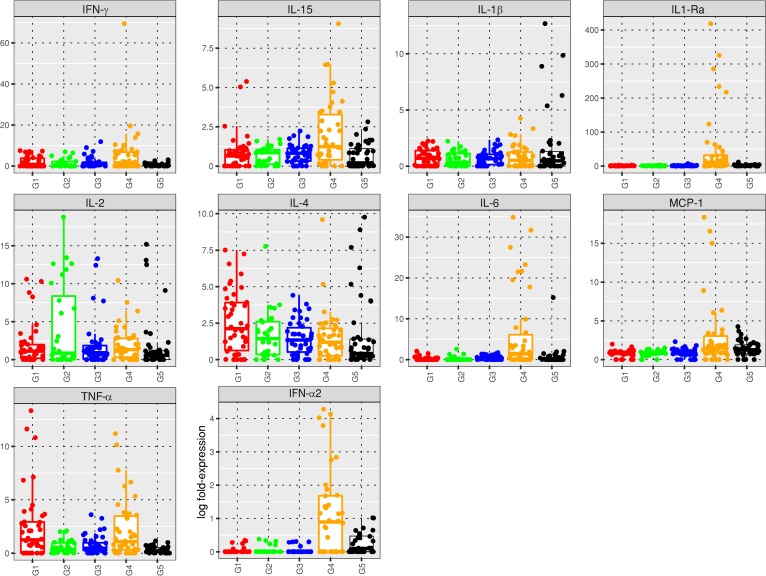
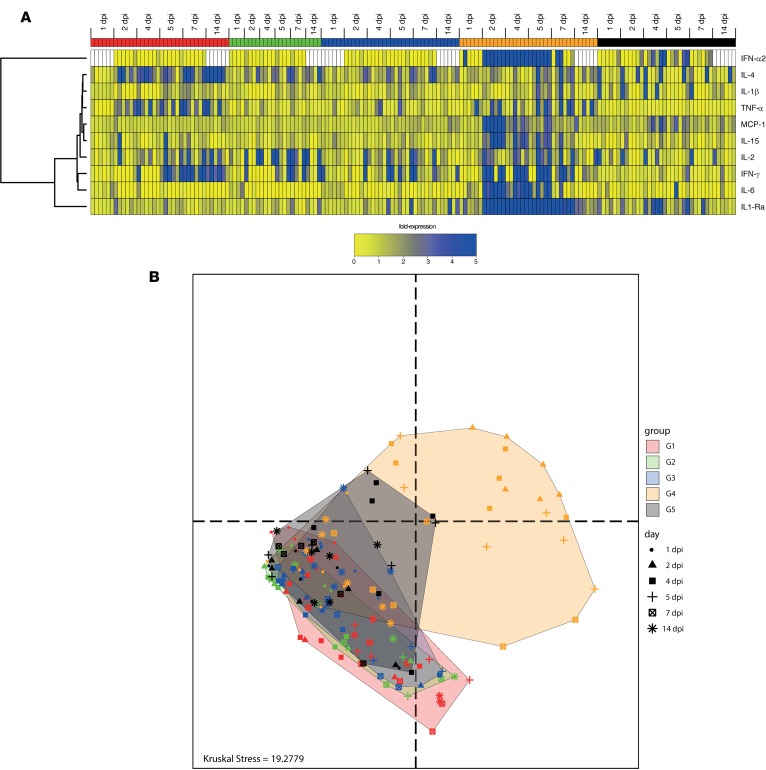
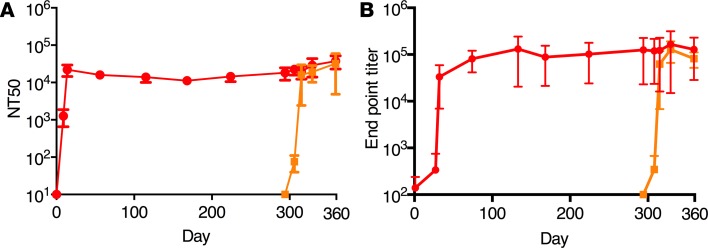
Chikungunya virus (CHIKV) is rapidly spreading across the globe, and millions are infected. Morbidity due to this virus is a serious threat to public health, but at present, there is no vaccine against this debilitating disease. We have recently developed a number of vaccine candidates, and here we have evaluated 3 of them in a nonhuman primate model. A single immunization with an attenuated strain of CHIKV (Δ5nsP3), a homologous prime-boost immunization with a DNA-launched RNA replicon encoding CHIKV envelope proteins (DREP-E), and a DREP-E prime followed by a recombinant modified vaccinia virus Ankara encoding CHIKV capsid and envelope (MVA-CE) boost all induced protection against WT CHIKV infection. The attenuated Δ5nsP3 virus proved to be safe and did not show any clinical signs typically associated with WT CHIKV infections such as fever, skin rash, lymphopenia, or joint swelling. These vaccines are based on an East/Central/South African strain of Indian Ocean lineage, but they also generated neutralizing antibodies against an isolate of the Asian genotype that now is rapidly spreading across the Americas. These results form the basis for clinical development of an efficacious CHIKV vaccine that generates both humoral and cellular immunity with long-term immunological memory.


Conflict of interest statement

Conflict of interest: A. Meinke is an employee of Valneva Austria GmbH.

Figures

Figure 1
Figure 1. CHIKV vaccines and immunizations.
(A) Vaccine constructs are based on the LR-CHIKV strain LR-2006OPY1. Top, Δ5nsP3, (Δ5), an infectious attenuated virus carrying a 60 amino acid–long deletion in the nsP3 replicase protein (9). Middle, the DREP-E (D) replicon DNA vaccine (9). Bottom, the recombinant modified vaccinia virus Ankara MVA-CE (M) vaccine (8) has a cDNA copy of the CHIKV structural gene cassette (C-E3-E2-6K-E1) inserted into the MVA genome and is expressed under the control of the MVA sE/L promoter. (B) Immunization schedule of cynomolgus macaques. Group Δ5nsP3-A received one s.c. injection of 1 × 10⁵ PFU of Δ5 virus on day 42 (red arrow). Group Δ5nsP3-B received one s.c. injection of 1 × 10⁵ PFU of Δ5 virus on day 0 (red arrow). Group DREP-E received 200 μg of D by intradermal (i.d.) injection followed by electroporation (EP) on days 0 and 42 (green arrows). Group DREP-E+MVA-CE was primed on day 0 with 200 μg of D followed by an i.m. injection of 1 × 10⁸ PFU of M on day 42 (blue arrows). Group 4 (controls) received 0.9% NaCl injections i.d. followed by EP on day 0 and s.c, i.m., and i.d. injections followed by EP on day 42 (orange arrows). All animals were challenged with 100 animal infectious doses 50% (AID50) WT LR-CHIKV on day 123 for groups 1A, 2, 3, and 4 and on day 294 for group 1B (black arrows). The study ended on day 298 for all groups except group 1B, which ended on day 359.
Figure 2
Figure 2. Neutralizing antibodies against CHIKV vaccine.
Animals were immunized on days 0 and/or 42 (y axis and black vertical dotted line). Animals were bled on days 0, 14, 34, 56, 77, 98, 112, 123, 127, 140, 154, 182, 210, and 298 (end of followup), and antibody levels in serum were determined. (A) Δ5 virus (red, 1×) corresponding to group Δ5-A (see Figure 1B), (B) DD (green), (C) DM (blue), (D) saline (orange). Animals were challenged on day 123 (red vertical dotted line). Panels AD show antibody levels in individual animals. Panel E compares the geometric mean titers obtained for animals in panels AD. Panel F shows NT titer of sera against Caribbean (CB, filled boxes) CHIKV isolate compared with response against East/Central/South African (ECSA) strain from day 56 (14 days after Δ5 or after D or M boost, respectively) for the vaccinated sera (panels AC) or from day 140 (14 days after challenge with WT CHIKV) for the vaccine control animals (D). Sera from control animals were sampled after challenge with WT CHIKV. Statistical analyses were performed using the Kruskal-Wallis test followed by a 2-tailed Mann-Whitney U test to analyze differences between two.
Figure 3
Figure 3. Binding antibody responses to CHIKV vaccines as described in Figure 2 (A–D) determined by ELISA.
Animals were immunized on days 0 and/or 42 (y axis and black vertical dotted line). (A) Δ5 virus (red, 1×), (B) DD (green), (D) DM (blue), (D) saline (orange). Animals were challenged on day 123 (red vertical dotted line). Panels (AD) show antibody levels in individual animals. Panel E compares the geometric mean titers obtained for animals in panels AD.
Figure 4
Figure 4. CHIKV-specific T cell responses induced by CHIKV vaccine candidates.
Δ5, attenuated virus (n = 6) (red); DD, homologous prime-boost (n = 4) (green); DM, heterologous prime-boost (n = 6) (blue); Control, no vaccine but NaCl injection only (n = 4) (orange). Panels compare the sum of IFN-γ T cell responses from each group measured by FluoroSpot assays on PBMC collected at 14 days after boost (A), 7 days before challenge (B), and 7 days after challenge (C) and stimulated with envelope E1 and E2, Capsid, and nsP1 peptide pools. Statistical comparisons were performed at 14 days after boost, 7 days prechallenge, and 7 days after challenge. Panel D compares cumulated IFN-γ responses against all peptides for each group (mean ± SEM). Animals were immunized on days 0 and/or 42 (y axis and black vertical dotted line) and challenged on day 123 (red vertical dotted line). CHIKV-specific IFN-γ T cells responses against E1 (E, G, I) and E2 (F, H, J) peptide pools at 14 days after boost (E and F), 7 days before challenge (G and H), and 7 days after challenge (I and J). Panels show IFN-γ responses in individual animals with mean (± SEM). For statistical analyses, the Kruskal-Wallis test followed by the Mann-Whitney U test were used to identify differences between groups. Significance is represented by *P < 0.05 or **P < 0.01; 95% CI.
Figure 5
Figure 5. Activation of CD154+ CD4 T cells and CHIKV-specific cytokine secretion induced by different CHIKV vaccine candidates using ICS assay.
Δ5, attenuated virus (n = 6) (red); DD, homologous prime-boost (n = 4) (green); DM, heterologous prime-boost (n = 6) (blue); Control, no vaccine but NaCl injection only (n = 4) (orange). Antigens used for stimulation of T cells: medium only (NS), envelope E1, envelope E2, Capsid, and nsP1. (A) The percentage of CD154+ cells among the CD4 T cells (green scale with 10 steps from 0.0%–1.0%) from each animal in each group at 14 days after boost. (B) The quality and the quantity of the cytokine response (IFN-γ, IL-2, and TNF-α) by the CD154+ CD4 T cells in Δ5 and DM groups at 14 days after boost. Secreted cytokines are represented with color: no cytokine (gray), one secreted cytokine (range of pink), 2 or more secreted cytokines (range of red). Quantity of secreted cytokines is presented as percentage among the CD4 T cells and represented by a 5-size scale of pies (0.0%–1.0%).
Figure 6
Figure 6. Viremia in macaques following challenge with WT LR-CHIKV (vaccine study) or infection with Δ5 virus (safety study).
(A) Plasma viremia of vaccinated animals after challenge. Vaccinated animals (groups Δ5, DD, DM) or control animals that had received saline only (group 4) were challenged with 100 50% animal infections dose (AID50) (about 7,000–10,000 PFU) of WT LR-CHIKV. Only the control group (NaCl, orange squares) displayed any viremia. The groups Δ5 (red circle), DD (green square), and DM (blue triangle) did not display any viremia. (B) Plasma viremia of naive animals infected with 1 × 10⁵ PFU of the Δ5 virus (group Δ5-B in Figure 1). Animals shown in red (n = 4) were infected by inoculating the virus s.c. in the back, whereas animals inoculated s.c. in the wrist (SCw) (n = 2) are indicated in purple. (C) Comparison of mean viremia + SEM in LR-CHIKV (WT CHIKV) challenged control animals (from A) with mean viremia + SEM in Δ5 infected animals (from B). The viremia from WT and Δ5 differ significantly at the time point indicated (****P < 0.0001; 2-way ANOVA + Bonferroni’s multiple comparisons test). (D) Total viral production in LR-CHIKV challenged control animals and Δ5 infected animals. AUC were computed using trapezoid rules taking in account a baseline setup at the limit of quantitation of the qPCR we used (100 copies/ml = 2 in Log10). Statistics was done using Mann & Whitney U test.
Figure 7
Figure 7. Vaccines protect against Chikungunya-associated fever.
Variation of body temperature compared with baseline (gray horizontal dotted line) from cynomolgus macaques immunized with the different CHIKV vaccine candidates and challenged at day 0. Animals were immunized with Δ5 virus (red), DD (green), or DM (blue) or injected with saline (i.v. route; orange). Temperature measured at midnight each day is plotted during the first 8 days following the challenge. Temperature at day 0 is the reference temperature and calculated with the mean of day –6 to day 0 (7 measures) from temperature of each animal at midnight (black horizontal dotted line).
Figure 8
Figure 8. Vaccines protect against WT Chikungunya–induced lymphopenia and monocytosis.
White blood cell subset absolute counts at each bleeding point after challenge. Animals were immunized with Δ5 virus (A; red), DD (B; green), DM (C; blue), or saline (D; orange) and challenged at day 0 (black vertical dotted line corresponding to day 123 in the Figure 1 schedule). Panel E shows animals that were infected with Δ5 virus at day 0 either s.c. (clear red circles; n = 4) or s.c. in the wrist (SCw, filled purple dots; n = 2). Horizontal gray area on panels represent the values out of normal range (lymphocytes normal range: 2 × 10³ to 8 × 10³ cells/μl; monocytes normal range: 0.1 × 10³ to 1 × 10³ cells/μl). Statistics by Friedman + Dunn’s post test for multiple comparison of time point values to baseline.
Figure 9
Figure 9. Attenuated virus (Δ5) vaccine does not induce fever.
Rectal body temperature were recorded each morning at time of bleeding and clinical examination. (A and B) Day-to-day followup of macaques infected with the Δ5 virus (red and purple lines, dots) and of control animals infected with LR-CHIKV WT strain (orange lines, squares). Temperature at day 0 is the reference temperature and calculated with the mean of day –6 to day 0 (2 measures) from temperature of each animal. (C) Comparison of rectal temperature increase between day 0 and day 2 after infection. (**P < 0.01; ***P < 0.001; Kruskal-Wallis followed by Mann & Whitney U rank test).
Figure 10
Figure 10. Profile of cytokines associated with infection and inflammation induced after infection of naive animals with WT CHIKV (orange curves) or with attenuated Δ5 virus (black curves).
Animals were inoculated with virus on day 0. Statistical analysis using Kruskall-Wallis test (P < 0.0001) for all except IFN-γ P < 0.01, then Mann & Whitney U test to compare each days between WT and attenuated virus groups. **P < 0.01; *P < 0.05.
Figure 11
Figure 11. Box plot and plot-jittering representations of the cytokine levels reached in plasma of macaques within 1 week after exposure to WT CHIKV after vaccination (G1 to G4) or Δ5 attenuated virus (G5, safety study).
Animals were inoculated with virus on day 0, which corresponded to day 123 of immunization schedule for groups G1 to G4. G1 = 1× Δ5 virus (red), G2 = DD (green), G3 = DM (blue), G4 = control saline (orange), G5 = safety study (black). For each cytokine, the box plots show the first and third quartiles, together with the medians of the cytokine expressions.
Figure 12
Figure 12. Cytokine levels and profiles in macaques.
(A) Heatmap of cytokine levels in plasma of macaque within 1 week after exposition to WT CHIKV after vaccination (G1 to G4) or infection of naive animals with Δ5 virus (G5, safety study). Animals were inoculated with virus on day 0, which corresponded to day 123 in Figure 1 for groups 1–4. Δ5 virus (1×, red), DD (green), DM (blue), control saline (orange), Δ5 virus in the safety study in (black). Missing values are indicated by white boxes. Hierarchical clustering of cytokines and samples were created based on the Euclidean distance and using the complete linkage method. (B) Multidimensional scaling (MDS) representation of samples based on their cytokine profiles from day 1 to day 14 after exposition to the virus (data from A). Each dot represents the cytokine profile of a sample, plotted in the space of cytokine expressions. The distances between the dots are proportional the Euclidian distances computed between the samples, restricted to the cytokines as in A. Each group is delineated by a convex hull (i.e., the smallest convex set containing the points). The Kruskal Stress indicated at the bottom of the representation quantifies the quality of the representation as the percentage of information lost in the dimensionality reduction process.
Figure 13
Figure 13. Antibody levels in the safety study.
CHIKV specific neutralizing (A) and binding (B) antibodies in sera of cynomolgus macaques infected with CHIKV. Animals were infected on day 0 with Δ5 virus (n = 6, red curve) or challenged with WT CHIKV on day 294 (n = 2, orange curve).

Similar articles

Cited by

References

    1. Rougeron V, Sam IC, Caron M, Nkoghe D, Leroy E, Roques P. Chikungunya, a paradigm of neglected tropical disease that emerged to be a new health global risk. J Clin Virol. 2015;64:144–152. doi: 10.1016/j.jcv.2014.08.032. - DOI - PubMed
    1. Weaver SC, Lecuit M. Chikungunya virus and the global spread of a mosquito-borne disease. N Engl J Med. 2015;372(13):1231–1239. doi: 10.1056/NEJMra1406035. - DOI - PubMed
    1. Delisle E, et al. Chikungunya outbreak in Montpellier, France, September to October 2014. Euro Surveill. 2015;20(17):17. - PubMed
    1. Ljungberg K, Liljeström P. Self-replicating alphavirus RNA vaccines. Expert Rev Vaccines. 2015;14(2):177–194. doi: 10.1586/14760584.2015.965690. - DOI - PubMed
    1. Voss JE, et al. Glycoprotein organization of Chikungunya virus particles revealed by X-ray crystallography. Nature. 2010;468(7324):709–712. doi: 10.1038/nature09555. - DOI - PubMed

Publication types

MeSH terms