. 2017 Mar 23;2(6):e90531.
doi: 10.1172/jci.insight.90531.

Serum Gp96 is a chaperone of complement-C3 during graft-versus-host disease

Affiliations

Serum Gp96 is a chaperone of complement-C3 during graft-versus-host disease

Antoine Seignez et al. JCI Insight. .

Abstract

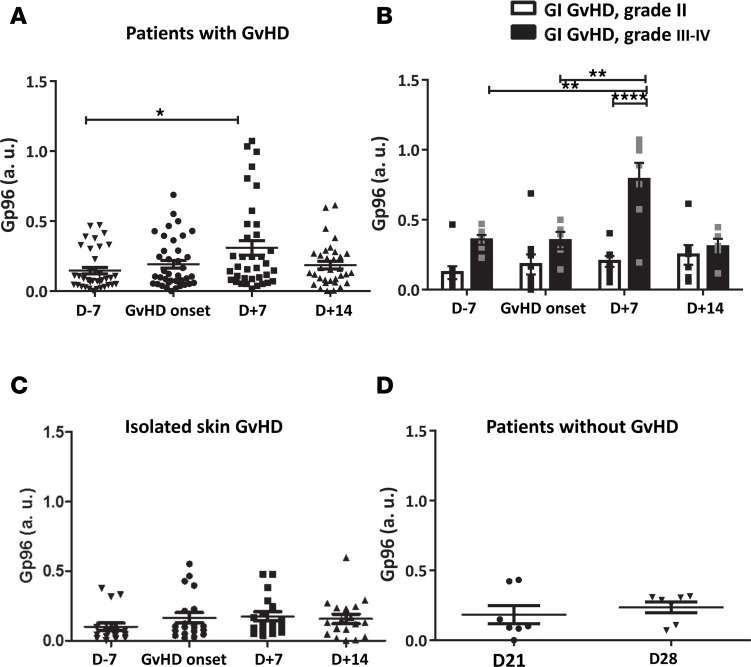
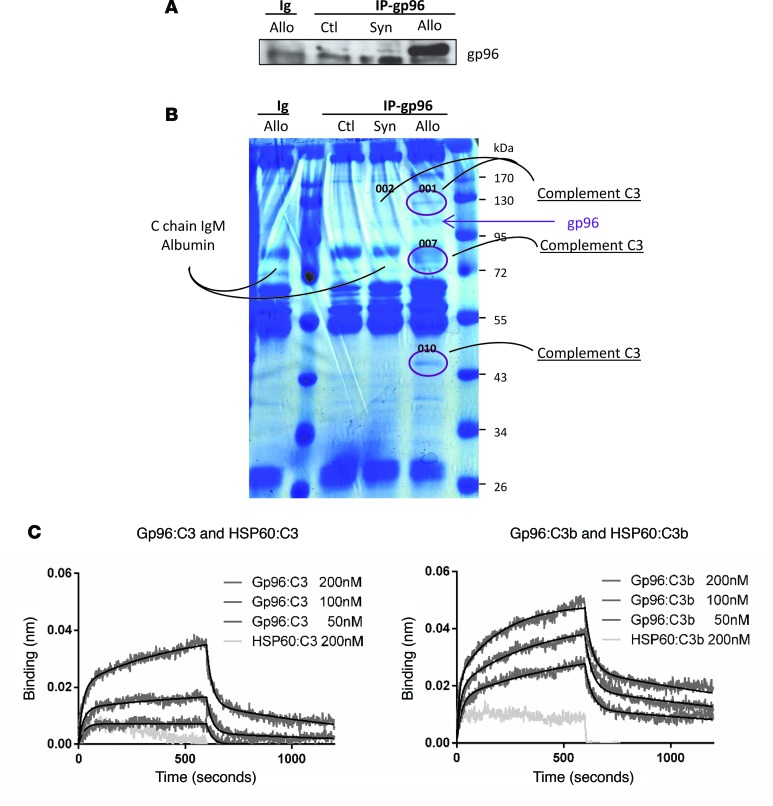
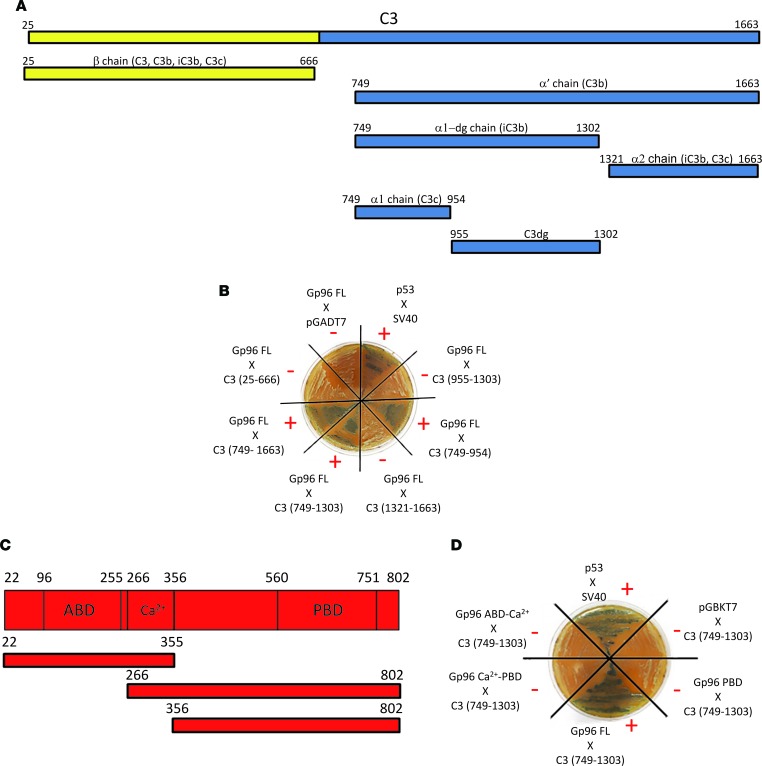
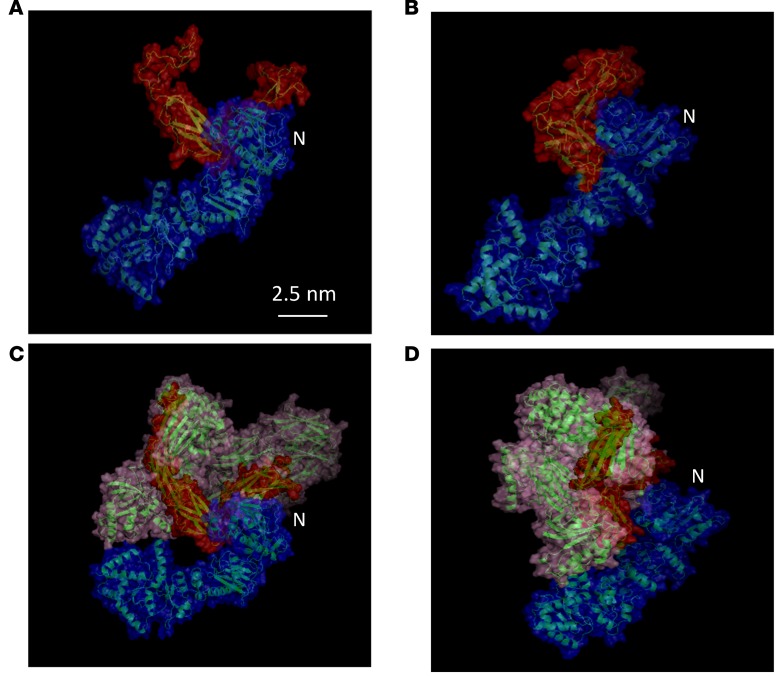
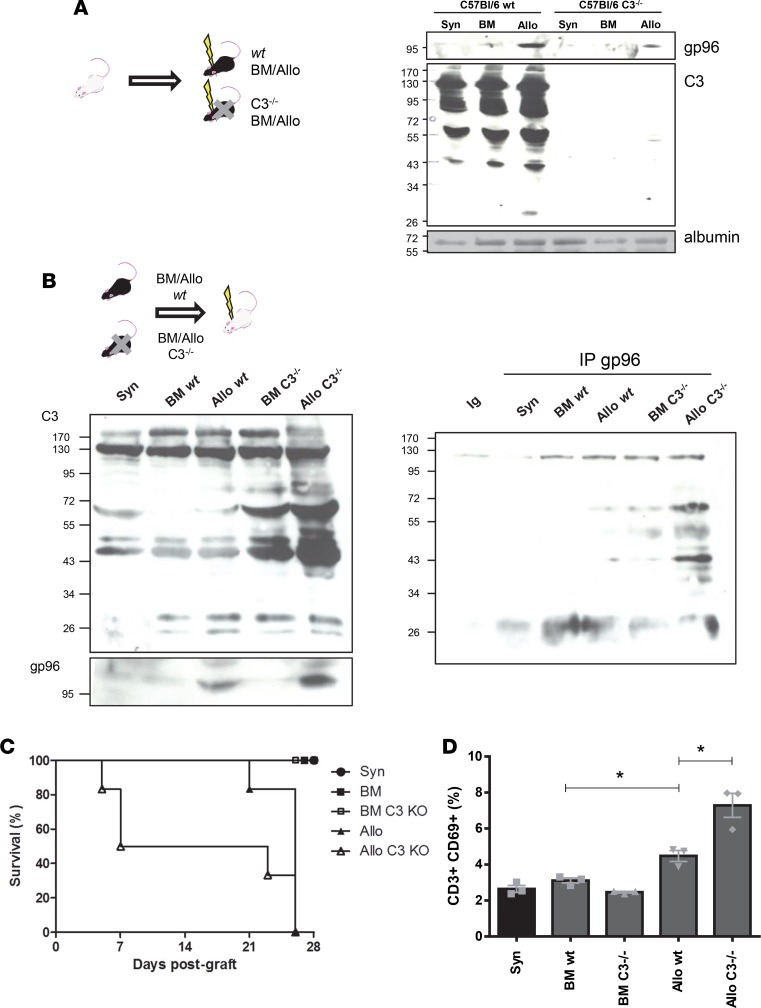
Better identification of severe acute graft-versus-host disease (GvHD) may improve the outcome of this life-threatening complication of allogeneic hematopoietic stem cell transplantation. GvHD induces tissue damage and the release of damage-associated molecular pattern (DAMP) molecules. Here, we analyzed GvHD patients (n = 39) to show that serum heat shock protein glycoprotein 96 (Gp96) could be such a DAMP molecule. We demonstrate that serum Gp96 increases in gastrointestinal GvHD patients and its level correlates with disease severity. An increase in Gp96 serum level was also observed in a mouse model of acute GvHD. This model was used to identify complement C3 as a main partner of Gp96 in the serum. Our biolayer interferometry, yeast two-hybrid and in silico modeling data allowed us to determine that Gp96 binds to a complement C3 fragment encompassing amino acids 749-954, a functional complement C3 hot spot important for binding of different regulators. Accordingly, in vitro experiments with purified proteins demonstrate that Gp96 downregulates several complement C3 functions. Finally, experimental induction of GvHD in complement C3-deficient mice confirms the link between Gp96 and complement C3 in the serum and with the severity of the disease.


Conflict of interest statement

Conflict of interest: The authors have declared that no conflict of interest exists.

Figures

Figure 1
Figure 1. Gp96 expression in acute GvHD patient sera.
Available sera from 39 patients were sampled 7 days before onset (D-7), the day of acute GvHD onset, and 7 days and 14 days after diagnosis (D+7 and D+14, respectively). Gp96 was quantified by ELISA. (A) All acute GvHD patients included. It is worth noting that, for some patients, data at one specific time point may be missing. Statistical analysis performed using a 1-way ANOVA test (Dunn’s multiple comparisons test). *P < 0.05. (B) Patients (n = 17) with grade II (n = 10) vs. III–IV intestinal (GI) GvHD (n = 7). Statistical analysis performed using a 2-way ANOVA test (Tukey’s multiple comparisons test). **P < 0.01, ****P < 0.0001. (C) Patients presenting isolated skin GvHD (n = 18). (D) Non-GvHD patients (n = 7). Gp96 levels were measured 3 weeks after hematopoietic stem cell transplantation (median: D21, most often the onset of GvHD) and 1 week later (median: D28).
Figure 2
Figure 2. Gp96 expression in the murine GvHD model.
(A) Left panel: mouse model of acute GvHD. Syn: syngeneic graft (no GvHD developed). BM: allogeneic graft without splenocytes (no GvHD). Allo: allogeneic graft with splenocytes (acute GvHD). Right panel: survival of the mice belonging to the different groups. (B) Western blot analysis of Gp96 and HSP90 in sera at day 7 after transplantation. Recombinant proteins were run as a control. (C) Western blot analysis of Gp96 expression at the indicated days after transplantation in sera of mice developing GvHD (Allo) or not (Syn). The lanes were run on the same gel but were noncontiguous. (D) Proportion of splenic macrophages (according to F4/80 staining) expressing Gp96 at the surface was determined by FACS analysis 7 days after hematopoietic stem cell transplantation. Statistical analysis performed using a 1-way ANOVA test. ****P < 0.0001. A representative experiment is shown (n = 3).
Figure 3
Figure 3. C3 associates with Gp96 in mouse sera during GvHD.
(A) Western blot analysis of Gp96. (B) Coomassie blue coloration of proteins coimmunoprecipitated with Gp96 (bottom panel) in mice developing GvHD (Allo) or not (Syn) 7 days after hematopoietic stem cell transplantation. Ctl, mice with no transplantation. The proteins indicated were determined by mass spectrometry. One representative experiment is shown (n = 2). (C) Protein-protein interaction data between Gp96 or HSP60 immobilized onto the biosensor and C3 (left panel) or C3b (right panel) as analytes.
Figure 4
Figure 4. Mapping of Gp96 interaction with C3.
(A) Linear structure of C3 (β-chain in yellow, α-chain in blue) and of the tested complement C3 fragments (see also Supplemental Figure 2). (B) Yeast two-hybrid assay between the C3 fragments described in A and full-length Gp96. A representative picture is shown. (C) Linear structure of Gp96 and the analyzed deletion mutants. ABD, ATP-binding domain; Ca2+, charged linker domain; PBD, peptide-binding domain. (D) Two-hybrid assay between complement C3 749–1,303 amino acid fragment and Gp96 deletion mutants. A representative image is shown (n = 3).
Figure 5
Figure 5. Atomistic models of the Gp96-C3 complex.
The N-terminus of Gp96 is indicated. Each structure is represented by a transparent surface superposed to the ribbon diagram of the protein backbone. The color code is the following: red for the C3 fragment (749–955), blue for the Gp96 and pink for the C3 complementary structure (1–748; 956–1641). (A and B) Two views of the Gp96-C3 fragment model. (C and D) Two views of the Gp96 full-length C3 model. This figure was prepared with PyMOL (http://www.pymol.org). N = N-terminal domain.
Figure 6
Figure 6. Gp96 effect on complement C3 activity.
(A) Gp96 inhibits C3b cleavage by factors I and H. Upper panel: Western blot analysis of the α’-chain (C3b) and the α2-chain (iC3b and C3c) both labeled with anti-C3c antibody, and of the α1-dg-chain (iC3b) labeled with anti-C3d antibody, after C3b incubation (0.3 μM) with normal human serum, supplemented with factors I and H with or without purified human Gp96 (1.2 μM). Lower panel: densitometry quantification. Cleavage without Gp96 is rationalized to 1. Statistical analysis performed using a 2-tailed Mann-Whitney U test. *P < 0.05; **P < 0.01 (n = 4 or 5). (B) Gp96 effect on opsonophagocytosis. Flow cytometry analysis of phagocytosis by human purified macrophages of Alexa Fluor 488–conjugated (AF 488–conjugated) E. coli bioparticles after opsonization by healthy human serum with or without Gp96 (1.5 mM). A representative image of AF 488 fluorescence in living cells is shown: the filled gray curve represents opsonization without serum, gray line with serum alone, black line with serum and Gp96, and dotted black line with serum and “BSA in buffer.” Histograms of mean fluorescence intensity ± SEM are shown. Statistical analysis performed using a one-tailed Mann-Whitney U test. *P < 0.05 (n = 3). (C) Gp96 effect on opsonization. AF 488–E. coli bioparticles were incubated with serum with or without Gp96 (1.5 mM). C3 and C4 were determined by Western blot in supernatants after deesterification of proteins tagged on bioparticles. One representative experiment is shown (n = 3). (D) Microscopy on AF 488–bioparticles after C3 AF568 staining. Right panel: C3 bioparticle quantification (median of fluorescence of AF 568 staining ± SEM). Statistical analysis performed using a one-tailed Mann-Whitney U test. *P < 0.05 (n = 3). (E and F) Gp96 effect on complement activation pathways. (E) Antibody-coated sheep erythrocytes (for classical pathway) (n = 6) and (F) rabbit erythrocytes hemolysis (for alternative pathway) (n = 4), in presence of Gp96 or controls. Percent of hemolysis are shown. Statistical analysis performed using a 2-tailed Mann-Whitney U test. *P < 0.05; **P < 0.01 (E: n = 6; F: n = 4).
Figure 7
Figure 7. Study of Gp96 in GvHD using complement C3 KO animals.
(A) Left, schematic representation of the model of GvHD used with a C3–/– recipient: FvB/N WT or C3–/– C57BL/6. Right, Western blot analysis of C3 and Gp96 in day 7 sera of WT or C3–/– mice, developing GvHD (Allo) or not (Syn and BM). (B) Top, schematic representation of the mice model with a C3–/– donor: WT or C3–/– C57BL/6 BALB/c. Lower left panel, Western blot analysis of C3 and Gp96 in day 7 sera of mice receiving a WT or a C3–/– graft, developing GvHD (Allo) or not (Syn and BM). Samples from 7 animals per group were pooled. Lower right panel, immunoprecipitation of Gp96 in the sera from the different described animals groups was followed by complement C3 immunoblotting. One representative experiment out of 3 performed is shown. (C) Survival of the mice belonging to the different groups described in B, (n = 4) from 2 independent experiments. (D) Percentage of activated, splenic T cells (CD3+CD69+) 7 days after hematopoietic stem cell transplantation in mice receiving either a WT or a C3–/– graft, developing GvHD (Allo) or not (Syn and BM). Statistical analysis performed using a one-tailed Mann-Whitney U test. *P < 0.05 (n = 3).

References

    1. Ramadan A, Paczesny S. Various forms of tissue damage and danger signals following hematopoietic stem-cell transplantation. Front Immunol. 2015;6:14. - PMC - PubMed
    1. Wingard JR, et al. Long-term survival and late deaths after allogeneic hematopoietic cell transplantation. J Clin Oncol. 2011;29(16):2230–2239. doi: 10.1200/JCO.2010.33.7212. - DOI - PMC - PubMed
    1. Ferrara JL, Levine JE, Reddy P, Holler E. Graft-versus-host disease. Lancet. 2009;373(9674):1550–1561. doi: 10.1016/S0140-6736(09)60237-3. - DOI - PMC - PubMed
    1. Ferrara JL, et al. Regenerating islet-derived 3-alpha is a biomarker of gastrointestinal graft-versus-host disease. Blood. 2011;118(25):6702–6708. doi: 10.1182/blood-2011-08-375006. - DOI - PMC - PubMed
    1. Garrido C, Solary E. A role of HSPs in apoptosis through “protein triage”? Cell Death Differ. 2003;10(6):619–620. doi: 10.1038/sj.cdd.4401229. - DOI - PubMed

Publication types