. 2017 Mar 23;2(6):e91863.
doi: 10.1172/jci.insight.91863.

Insulin's direct hepatic effect explains the inhibition of glucose production caused by insulin secretion

Affiliations

Insulin's direct hepatic effect explains the inhibition of glucose production caused by insulin secretion

Dale S Edgerton et al. JCI Insight. .

Abstract

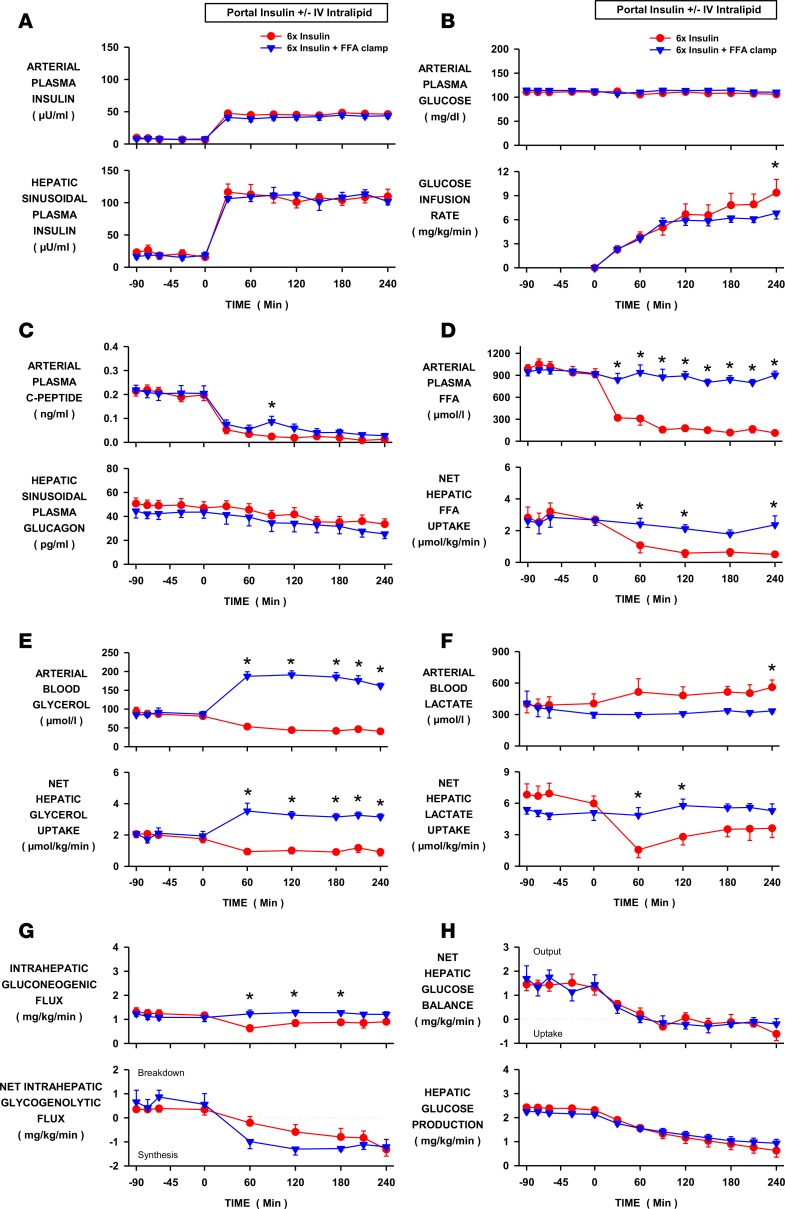
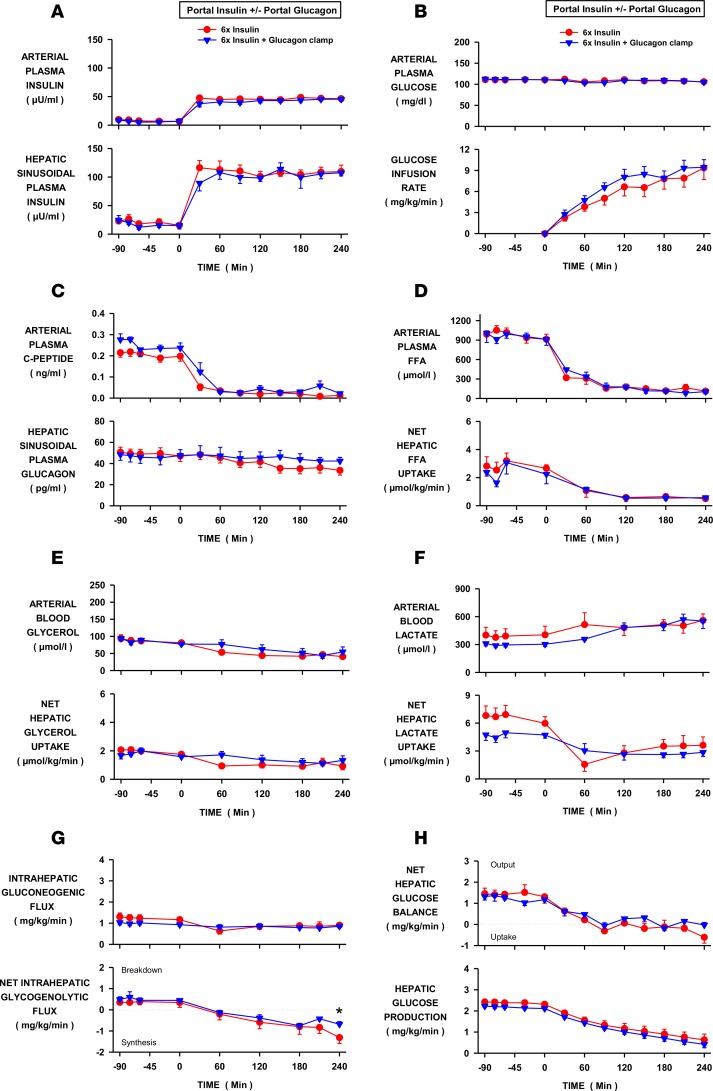
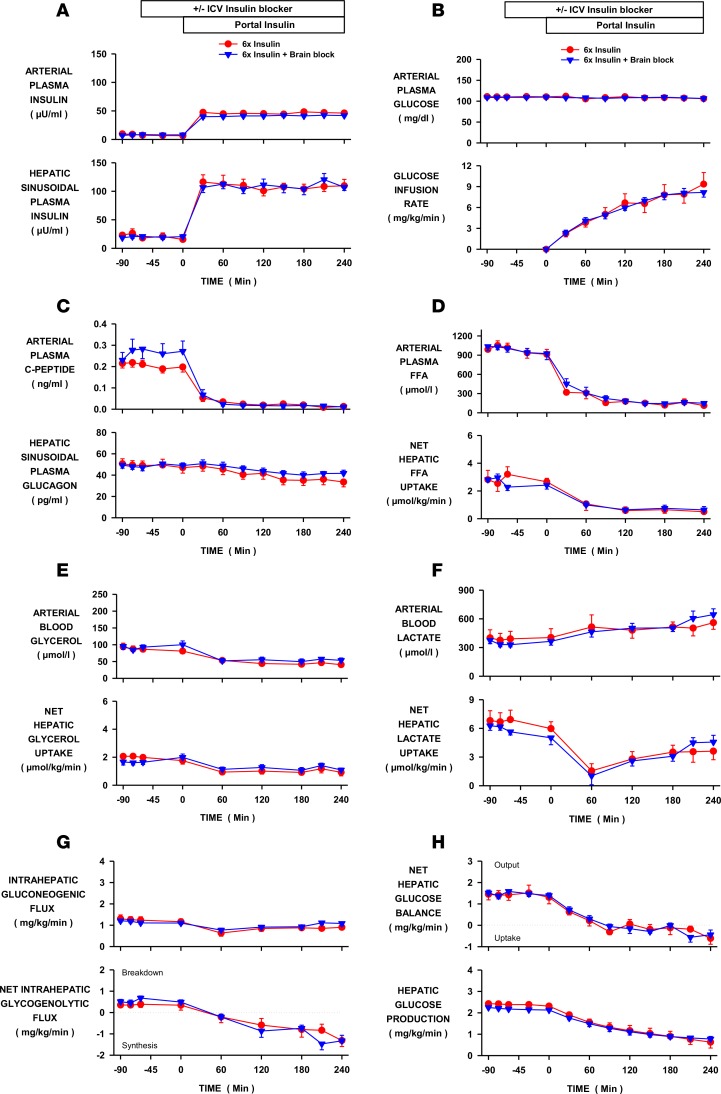
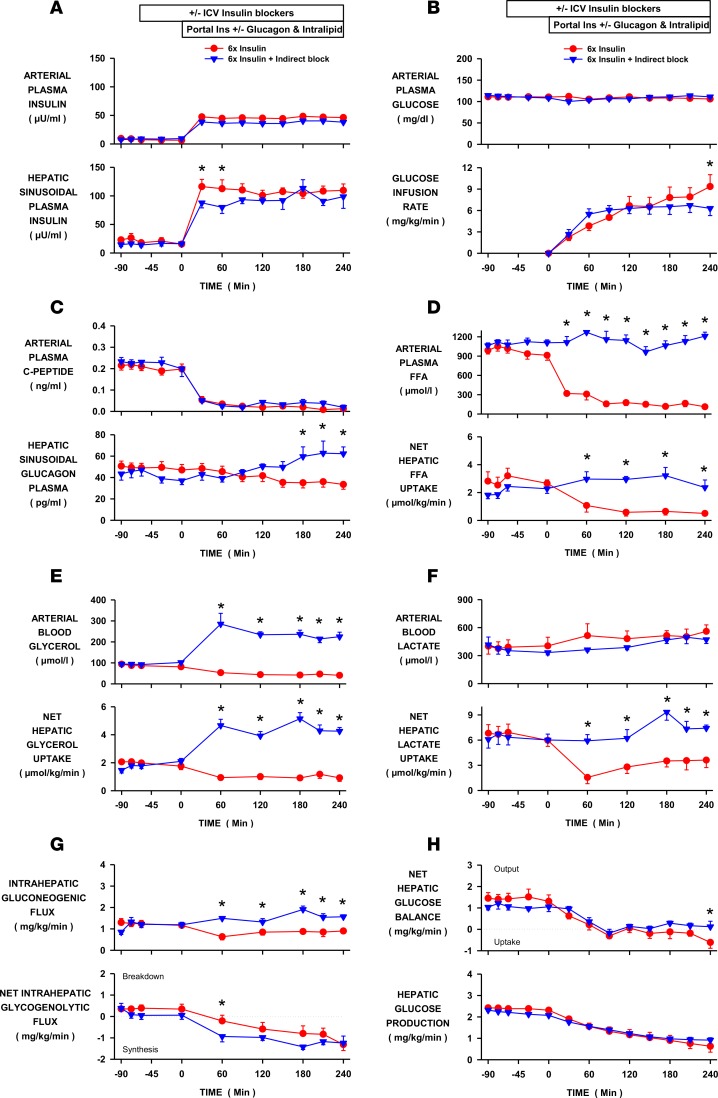
Insulin can inhibit hepatic glucose production (HGP) by acting directly on the liver as well as indirectly through effects on adipose tissue, pancreas, and brain. While insulin's indirect effects are indisputable, their physiologic role in the suppression of HGP seen in response to increased insulin secretion is not clear. Likewise, the mechanisms by which insulin suppresses lipolysis and pancreatic α cell secretion under physiologic circumstances are also debated. In this study, insulin was infused into the hepatic portal vein to mimic increased insulin secretion, and insulin's indirect liver effects were blocked either individually or collectively. During physiologic hyperinsulinemia, plasma free fatty acid (FFA) and glucagon levels were clamped at basal values and brain insulin action was blocked, but insulin's direct effects on the liver were left intact. Insulin was equally effective at suppressing HGP when its indirect effects were absent as when they were present. In addition, the inhibition of lipolysis, as well as glucagon and insulin secretion, did not require CNS insulin action or decreased plasma FFA. This indicates that the rapid suppression of HGP is attributable to insulin's direct effect on the liver and that its indirect effects are redundant in the context of a physiologic increase in insulin secretion.


Conflict of interest statement

Conflict of interest: The authors have declared that no conflict of interest exists.

Figures

Figure 1
Figure 1. Effect of a fall in free fatty acids (FFAs) on hepatic glucose production during hyperinsulinemia.
Insulin was elevated 6-fold by portal vein insulin infusion in conscious dogs in the INS control (n = 6) and INS+FFA fat-clamp (n = 5) groups. Intralipid and heparin were infused in the latter to maintain arterial FFA levels at basal. (A) Arterial and hepatic sinusoidal plasma insulin levels. (B) Arterial plasma glucose levels and peripheral glucose infusion rate. (C) Arterial plasma C-peptide and hepatic sinusoidal plasma glucagon levels. (D) Arterial plasma FFA levels and net hepatic FFA uptake. (E) Arterial blood glycerol levels and net glycerol hepatic uptake. (F) Arterial blood lactate levels and net hepatic lactate uptake. (G) Intrahepatic gluconeogenic and glycogenolytic fluxes. (H) Net hepatic glucose balance and hepatic glucose production. Values are means ± SEM. *Denotes a difference (P < 0.05; 2-way repeated measure ANOVA) between groups.
Figure 2
Figure 2. Effect of a fall in glucagon on hepatic glucose production during hyperinsulinemia.
Insulin was elevated 6-fold by portal vein insulin infusion in conscious dogs in the INS control (n = 6) and INS+GGN glucagon-clamp (n = 5) groups. Glucagon was infused into the portal vein in the latter to prevent a decrease in its level at the liver. (A) Arterial and hepatic sinusoidal plasma insulin levels. (B) Arterial plasma glucose levels and peripheral glucose infusion rate. (C) Arterial plasma C-peptide and hepatic sinusoidal plasma glucagon levels. (D) Arterial plasma free fatty acid (FFA) levels and net hepatic FFA uptake. (E) Arterial blood glycerol levels and net glycerol hepatic uptake. (F) Arterial blood lactate levels and net hepatic lactate uptake. (G) Intrahepatic gluconeogenic and glycogenolytic fluxes. (H) Net hepatic glucose balance and hepatic glucose production. Values are means ± SEM. *Denotes a difference (P < 0.05; 2-way repeated measure ANOVA) between groups.
Figure 3
Figure 3. Effect of increased brain insulin signaling on hepatic glucose production during hyperinsulinemia.
Insulin was elevated 6-fold by portal vein insulin infusion in conscious dogs in the INS control (n = 6) and brain insulin–block (INS-BRAIN, n = 9) groups. In the latter, a PI3-kinase inhibitor or insulin receptor antagonist was infused into the third ventricle to block an increase in brain insulin signaling. (A) Arterial and hepatic sinusoidal plasma insulin levels. (B) Arterial plasma glucose levels and peripheral glucose infusion rate. (C) Arterial plasma C-peptide and hepatic sinusoidal plasma glucagon levels. (D) Arterial plasma free fatty acid (FFA) levels and net hepatic FFA uptake. (E) Arterial blood glycerol levels and net glycerol hepatic uptake. (F) Arterial blood lactate levels and net hepatic lactate uptake. (G) Intrahepatic gluconeogenic and glycogenolytic fluxes. (H) Net hepatic glucose balance and hepatic glucose production. Values are means ± SEM. ICV, intracerebroventricular.
Figure 4
Figure 4. Effect of blocking all of the indirect effects of insulin on hepatic glucose production during hyperinsulinemia.
Insulin was elevated 6-fold by portal vein insulin infusion in conscious dogs in the INS control (n = 6) and INS-COMPLETE (n = 5) groups. All of insulin’s indirect effects were blocked in the latter with infusions of intravenous intralipid, portal vein glucagon, and third ventricle infusion of LY294002 and S961. (A) Arterial and hepatic sinusoidal plasma insulin levels. (B) Arterial plasma glucose levels and peripheral glucose infusion rate. (C) Arterial plasma C-peptide and hepatic sinusoidal plasma glucagon levels. (D) Arterial plasma free fatty acid (FFA) levels and net hepatic FFA uptake. (E) Arterial blood glycerol levels and net glycerol hepatic uptake. (F) Arterial blood lactate levels and net hepatic lactate uptake. (G) Intrahepatic gluconeogenic and glycogenolytic fluxes. (H) Net hepatic glucose balance and hepatic glucose production. Values are means ± SEM. *Denotes a difference (P < 0.05; 2-way repeated measure ANOVA) between groups. ICV, intracerebroventricular.
Figure 5
Figure 5. CNS activation of STAT-3 phosphorylation (Tyr705) in the liver.
Results are expressed relative to liver from overnight-fasted control dogs in which insulin was basal (n = 2) compared to when insulin was elevated 6-fold by portal vein insulin infusion in the INS control (n = 5), brain insulin–block (INS-BRAIN, n = 9), and INS-COMPLETE (all of insulin’s indirect effects blocked, n = 5) groups. Values are means ± SEM. *STAT-3 phosphorylation in the INS-BRAIN and INS-COMPLETE groups was reduced (P < 0.05) compared with the INS group.

References

    1. Edgerton DS, et al. Insulin’s direct effects on the liver dominate the control of hepatic glucose production. J Clin Invest. 2006;116(2):521–527. doi: 10.1172/JCI27073. - DOI - PMC - PubMed
    1. Hausler N, et al. Effects of insulin and cytosolic redox state on glucose production pathways in the isolated perfused mouse liver measured by integrated 2H and 13C NMR. Biochem J. 2006;394(Pt 2):465–473. - PMC - PubMed
    1. Maheux P, Chen YD, Polonsky KS, Reaven GM. Evidence that insulin can directly inhibit hepatic glucose production. Diabetologia. 1997;40(11):1300–1306. doi: 10.1007/s001250050824. - DOI - PubMed
    1. Pilkis SJ, el-Maghrabi MR, Claus TH. Hormonal regulation of hepatic gluconeogenesis and glycolysis. Annu Rev Biochem. 1988;57:755–783. - PubMed
    1. Sindelar DK, Balcom JH, Chu CA, Neal DW, Cherrington AD. A comparison of the effects of selective increases in peripheral or portal insulin on hepatic glucose production in the conscious dog. Diabetes. 1996;45(11):1594–1604. - PubMed

Publication types