. 2017 Mar 29;18(4):728.
doi: 10.3390/ijms18040728.

Inhibition or Stimulation of Autophagy Affects Early Formation of Lipofuscin-Like Autofluorescence in the Retinal Pigment Epithelium Cell

Affiliations

Inhibition or Stimulation of Autophagy Affects Early Formation of Lipofuscin-Like Autofluorescence in the Retinal Pigment Epithelium Cell

Lei Lei et al. Int J Mol Sci. .

Abstract

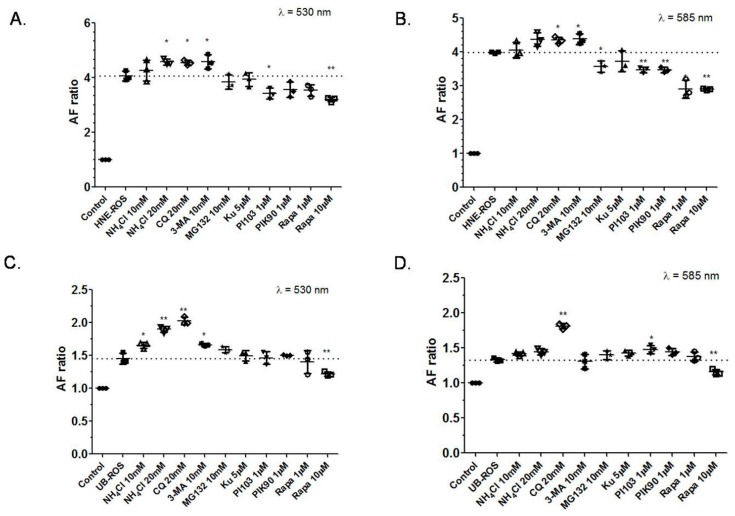
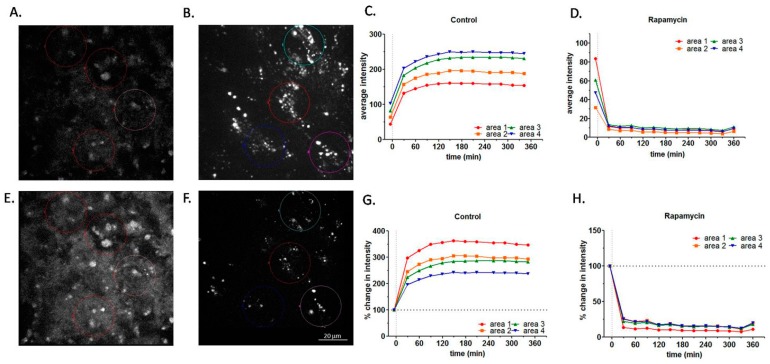
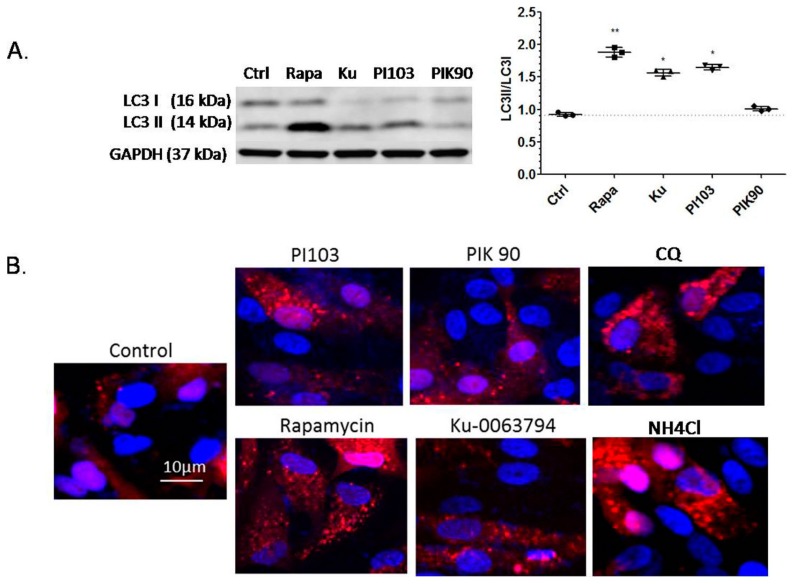
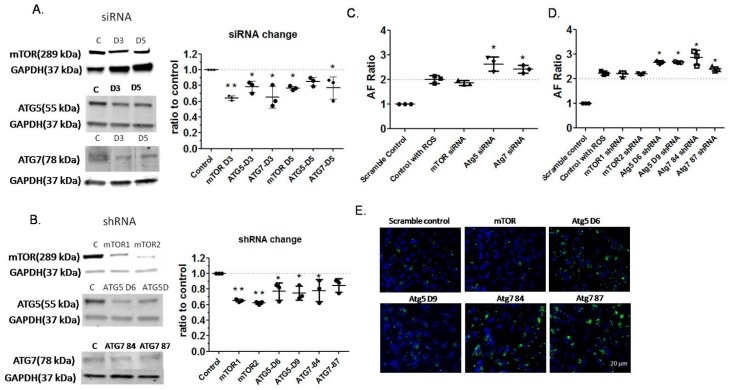
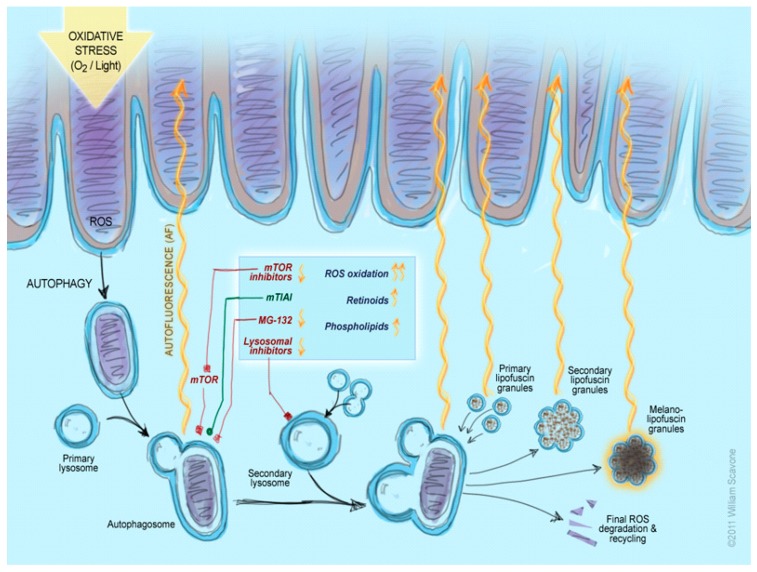
The accumulation of lipofuscin in the retinal pigment epithelium (RPE) is dependent on the effectiveness of photoreceptor outer segment material degradation. This study explored the role of autophagy in the fate of RPE lipofuscin degradation. After seven days of feeding with either native or modified rod outer segments, ARPE-19 cells were treated with enhancers or inhibitors of autophagy and the autofluorescence was detected by fluorescence-activated cell sorting. Supplementation with different types of rod outer segments increased lipofuscin-like autofluorescence (LLAF) after the inhibition of autophagy, while the induction of autophagy (e.g., application of rapamycin) decreased LLAF. The effects of autophagy induction were further confirmed by Western blotting, which showed the conversion of LC3-I to LC3-II, and by immunofluorescence microscopy, which detected the lysosomal activity of the autophagy inducers. We also monitored LLAF after the application of several autophagy inhibitors by RNA-interference and confocal microscopy. The results showed that, in general, the inhibition of the autophagy-related proteins resulted in an increase in LLAF when cells were fed with rod outer segments, which further confirms the effect of autophagy in the fate of RPE lipofuscin degradation. These results emphasize the complex role of autophagy in modulating RPE autofluorescence and confirm the possibility of the pharmacological clearance of RPE lipofuscin by small molecules.

Keywords: age-related macular degeneration; autofluorescence; autophagy; degradation; lipofuscin; mTOR; retinal pigment epithelium.


Conflict of interest statement

The authors declare no conflict of interest.

Figures

Figure 1
Figure 1
Effects of autophagy induction or inhibition on RPE cells autofluorescence detected by FACS. (AD) Bar graphs of relative LLAF, expressed as a ratio of the fluorescence from cells supplemented with rod outer segments (ROS) and treated with small molecules relative to the fluorescence detected from cells treated with small molecules only. The fluorescence levels detected from cells supplemented with ROS only are presented with a horizontal dotted line. (A) After seven days of feeding with ROS modified with the lipid peroxidation product 4-hydroxynonenal (HNE), ARPE-19 cells were treated with ammonium chloride (NH4Cl, a lysosomal inhibitor), chloroquine (CQ, a lysosomal inhibitor), 3-MA (an autophagy inhibitor), MG-132(an autophagy inducer), Ku-0063794 (Ku, a mTOR kinase inhibitor), PI-103 (a dual phosphoinositide 3-kinase and mTOR inhibitor), PIK90 (a PI3Kα inhibitor), and rapamycin (Rapa, a known mTOR inhibitor and autophagy inducer) at doses indicated in the labels below the horizontal axis for 48 h and AF was measured by FACS at 533 nm; (B) Same conditions as in A, but detected at 585 nm; (C) Same treatment and detection as in A, but seven days feeding was with native ROS; (D) Same treatment and detection as in B, but feeding was with native ROS. Values are presented as means and standard deviations, based on three replicates. Significant differences in LLAF between different preparations and relative LLAF for cells fed with HNE-modified ROS in A and B, and with native ROS in C and D, are denoted with an asterisk/s (post-hoc Dunnett’s multiple comparisons test; * p < 0.05; ** p < 0.01).
Figure 2
Figure 2
Effect of rapamycin treatment on RPE autofluorescence by live cell imaging. (A,B,E,F) Microphotographs of RPE autofluorescence obtained with live cell imaging at 610 nm before and after the addition of rapamycin or PBS. (A) Combined confocal control image before the addition of PBS; (B) Combined confocal control image before the addition of rapamycin (10 µM); (E) Combined confocal image at 342 min after the addition of PBS; (F) Combined confocal image at 360 min after the addition of rapamycin. Four color circles indicate the areas chosen for the quantitation of autofluorescence over time. (C,D,G,H) Quantification of autofluorescence in live cell imaging. Quantification of the RPE autofluorescence registered by live cell imaging presented on panels A,B,E,F and Supplemental Movies 1 and 2; (C) Changes in absolute intensity vs. time with PBS treatment (control) for each of the four colored circular regions outlined in panels A,B,E,F. Please note that the initial conditions in Panels C and D (time 0) are very similar; (D) Changes in absolute intensity vs. time with rapamycin treatment for the four circular regions; (G) Changes in relative intensity (post-treatment intensity for each circular region normalized towards the corresponding intensity pre-treatment) vs. time with PBS treatment; (H) Changes in relative intensity vs. time with rapamycin treatment (normalization as in C). Scale bar—20 µm. For more details, see the Methods section of the main text.
Figure 3
Figure 3
Effects of autophagy induction and lysosomal inhibitors on protein expression and lysosomal activity by confocal microscopy.(A) Western blot results for the microtubule-associated protein 1 light chain 3 (LC3). Upper part: LC3-1 (LC3-I) form (cytoplasmic form); lower part: LC3-2 (LC3-II) form (autophagosomal form) of the ARPE-19 cells at 8 h after no treatment (Ctrl), or after treatment with rapamycin (RAPA, 10 µM), KU-0063794 (Ku, 5 µM), PI-103 (PI103, 1 µM) and PIK-90 (1 µM); LC3-II/LC3-I ratios were calculated and the values are presented as means and standard deviations, based on three replicates; Significant differences between different groups are denoted with an asterisk/s (post-hoc Dunnett’s multiple comparisons test; * p < 0.05; ** p < 0.01); (B) Confocal microphotographs of ARPE-19 cells transfected with mCherry-LC3 at 48 h after the single addition of: 10 μM rapamycin, 1 µM PI-103, 1 µM PIK-90, 5 µM Ku-0063794, 10 µM of NH4Cl, 20 µM of chloroquine, and PBS (control). Note the punctate appearance of the fluorescence in cells treated with the drugs compared to the cells treated with PBS (control). Red color represents mCherry-LC3, blue indicates cell nuclei (DAPI).
Figure 4
Figure 4
Autofluorescence of RPE cells transfected with siRNA and shRNA.(A) Western blot results demonstrating protein levels of mTOR, autophagy protein 5 (Atg5), and autophagy protein 7 (Atg7) at three days (D3) and five days (D5) after transfection with siRNA; (B) Western blot results demonstrating protein levels of mTOR (mTOR1, mTOR2), Atg5 for both lentiviral constructs (D6 and D9), and Atg7 for both lentiviral constructs (84 and 87) at three days after transfection with shRNA. Results presented in A and B showed that protein levels were reduced after transfection and the values are presented as means and standard deviations, based on three replicates. Significant differences between different groups are denoted with an asterisk/s (post-hoc Dunnett’s multiple comparisons test; * p < 0.05, ** p < 0.01); (C) Autofluorescence of ARPE-19 cells after three days of transfection with siRNA against mTOR, Atg5, and Atg7, and then three days feeding with HNE-modified ROS; three replicates; (D) Autofluorescence of ARPE-19 cells after three days of transfection with shRNA against mTOR, Atg5, and Atg7, and then three days feeding with HNE-modified ROS; three replicates. Results presented in C and D were obtained by FACS analysis in PE channel with an emission of 585/40 nm, and represent means and standard deviations. Significant differences in LLAF between different preparations and relative LLAF for cells fed scramble control in C and D (and for the right panels in A and B)are denoted with an asterisk (post-hoc Dunnett’s multiple comparisons test, * p < 0.05, ** p < 0.01). Analysis of the autofluorescence at 530 nm showed similar pattern as at 585 nm (data not shown); (E) Microphotographs of ARPE-19 cells at three days after transfection with shRNA and feeding for three consecutive days with HNE-ROS. LLAF (green color, detected by fluorescein filter set, see Methods) of cells (nuclei stained with DAPI—blue color) infected with Atg5 and Atg7 shRNA increased with little change in the growth of the cells, while LLAF of cells infected with mTOR shRNA decreased with a decrease in the growth of the cells because of the associated physiological effect. Scale bar—20 µm.
Figure 5
Figure 5
RPE lipofuscin biogenesis and degradation pathways modulated by mTOR activity. Schematic representation of the mTOR modulation on RPE lipofuscin biogenesis and degradation pathways, based on the results from the present study. Initial degradation of the rod outer segment material occurs with the participation of autophagosomes, including their proteosome component. This part of the process can be down-regulated by the mTOR complex or by proteosomal inhibitors, and the application of the latter could increase lipofuscin-like autofluorescence (LLAF). Suppression of mTOR activity (e.g., by application of rapamycin) can stimulate the autophagosome activity and this can lead to a more complete degradation of the material, resulting in decreased LLAF. Similarly, the application of mTOR-independent autophagy inducers can decrease LLAF. In contrast, either direct lysosome inhibition or an oversupply of some ROS components, like phospholipids or retinoids, can lead to increased LLAF. Oxidation of ROS material can also lead to LLAF increase. Abbreviations: Mtch—mitochondrion; Prt—proteasome; mTIAI—mTOR-independent autophagy inducers. The illustration was generated by William Scavone (used with permission).

Similar articles

Cited by

References

    1. Adler L.T., Boyer N.P., Chen C., Ablonczy Z., Crouch R.K., Koutalos Y. The 11-cis Retinal Origins of Lipofuscin in the Retina. Prog. Mol. Biol. Transl. Sci. 2015;134:e1–e12. - PubMed
    1. Nandakumar N., Buzney S., Weiter J.J. Lipofuscin and the principles of fundus autofluorescence: A review. Semin. Ophthalmol. 2012;27:197–201. doi: 10.3109/08820538.2012.711415. - DOI - PubMed
    1. Dorey C.K., Wu G., Ebenstein D., Garsd A., Weiter J.J. Cell loss in the aging retina. Relationship to lipofuscin accumulation and macular degeneration. Investig. Ophthalmol. Vis. Sci. 1989;30:1691–1699. - PubMed
    1. Sparrow J., Boulton M. RPE lipofuscin and its role in retinal pathobiology. Exp. Eye Res. 2005;80:595–606. doi: 10.1016/j.exer.2005.01.007. - DOI - PubMed
    1. Sparrow J.R., Hicks D., Hamel C.P. The retinal pigment epithelium in health and disease. Curr. Mol. Med. 2010;10:802–823. doi: 10.2174/156652410793937813. - DOI - PMC - PubMed

LinkOut - more resources