Review
. 2017 Mar 29;17(4):714.
doi: 10.3390/s17040714.

Metal Oxide Gas Sensors, a Survey of Selectivity Issues Addressed at the SENSOR Lab, Brescia (Italy)

Affiliations
Review

Metal Oxide Gas Sensors, a Survey of Selectivity Issues Addressed at the SENSOR Lab, Brescia (Italy)

Andrea Ponzoni et al. Sensors (Basel). .

Abstract

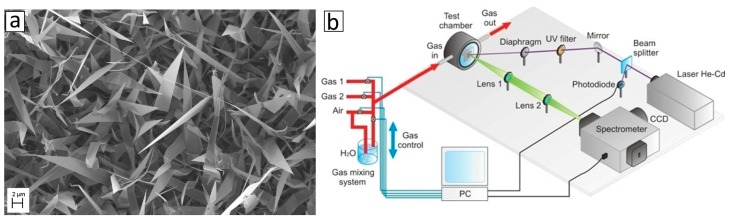
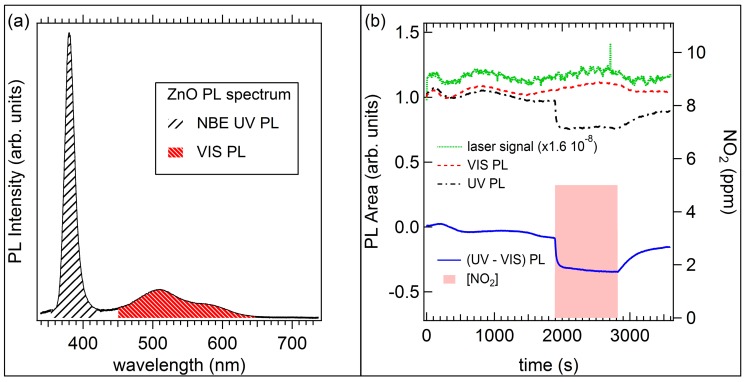
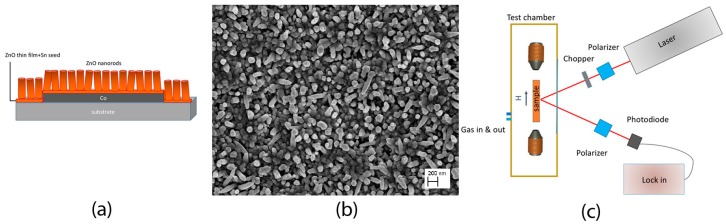
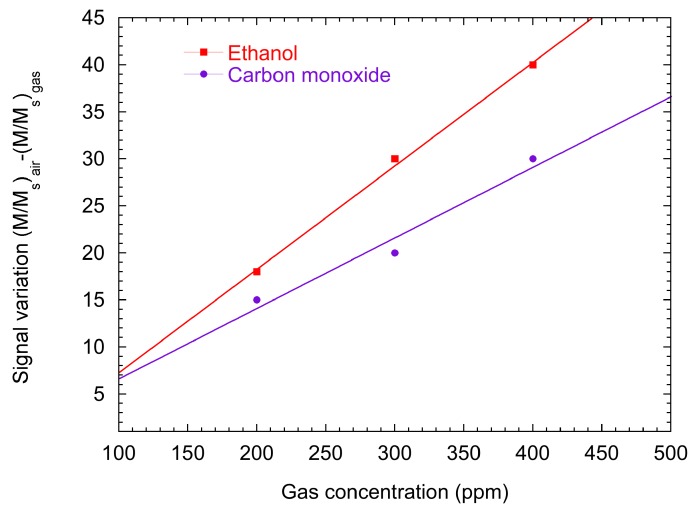
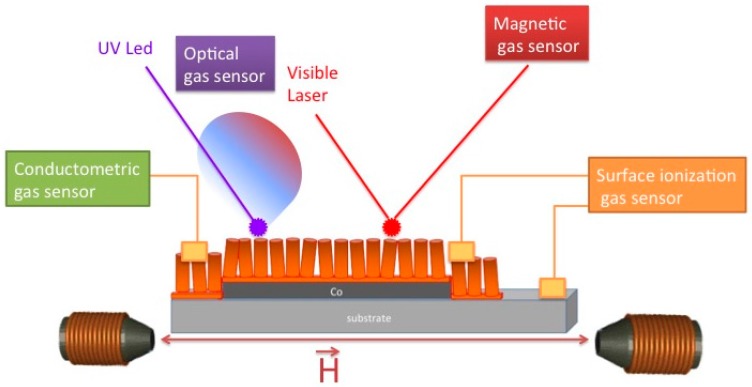
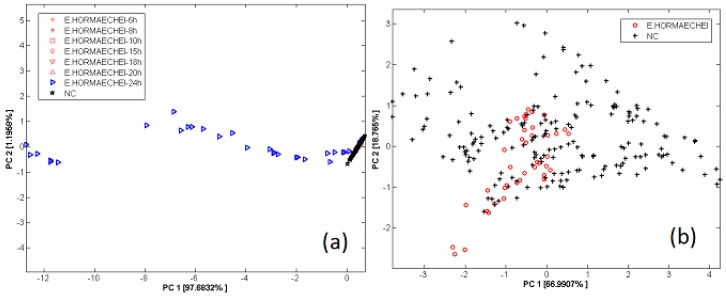
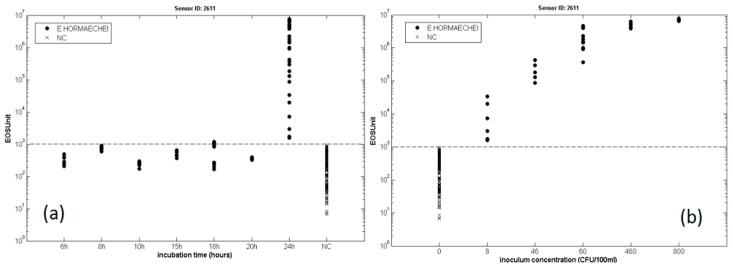
This work reports the recent results achieved at the SENSOR Lab, Brescia (Italy) to address the selectivity of metal oxide based gas sensors. In particular, two main strategies are being developed for this purpose: (i) investigating different sensing mechanisms featuring different response spectra that may be potentially integrated in a single device; (ii) exploiting the electronic nose (EN) approach. The former has been addressed only recently and activities are mainly focused on determining the most suitable configuration and measurements to exploit the novel mechanism. Devices suitable to exploit optical (photoluminescence), magnetic (magneto-optical Kerr effect) and surface ionization in addition to the traditional chemiresistor device are here discussed together with the sensing performance measured so far. The electronic nose is a much more consolidated technology, and results are shown concerning its suitability to respond to industrial and societal needs in the fields of food quality control and detection of microbial activity in human sweat.

Keywords: Enterobacter hormaechei; electronic-nose; gas-sensors; magneto-optical Kerr effect; metal oxides; nanotubes; nanowires; photoluminescence; skin microbiota; surface ionization.


Conflict of interest statement

The authors declare no conflict of interest.

Figures

Figure 1
Figure 1
Schematic representation of the structure (a) and working principle (b) of thick film gas sensors. Reprint from [7].
Figure 2
Figure 2
Response towards 500 ppm of H2, 500 ppm of CO, 50 ppm of acetone and 50 ppm of ethanol at the operating temperature of 100 °C (a), 200 °C (b), 300 °C (c), 400 °C (d), 500 °C (e), with 40% RH at the environmental temperature of 20 °C. Reprint from [32]. Response is calculated as the non-dimensional (Ggas – Gair)/Gair where Ggas and Gair are the steady state values measured in the presence of the target gas (H2, CO, acetone, ethanol) and in the background air respectively.
Figure 3
Figure 3
Response towards nitrogen dioxide, hydrogen and methane at 1 ppm, 1000 ppm, 50 ppm respectively and working the temperature of 300 °C (a), 400 °C (b), 500 °C (c) and RH 40% at the environmental temperature of 20 °C. Reprint from [38], copyright (2015), with permission from Elsevier.
Figure 4
Figure 4
(a) Energy band diagram in a single partially-depleted nanowire and fully-depleted nanowire; (b) Energy band diagram at nanowire-nanowire junction, that could be modeled as a resistor; (c) Sketch of a conductometric mat-based device.
Figure 5
Figure 5
Influence of humidity on the 180 nm WO3 device response to nitrogen dioxide, carbon monoxide and ammonia. The y-axis reports the ratio between the response at the target value of relative humidity with respect to the reference value of RH = 50% at the environmental temperature of 20 °C. Sensor temperature is 200 °C. Reprinted from [56]—Reproduced by permission from The Royal Society of Chemistry.
Figure 6
Figure 6
(a) Response of NiO nanowires towards some target gases; (b) Calibration curves for NiO sensor devices towards hydrogen at 300 °C, acetone and ethanol at 500 °C, and carbon monoxide at 300 °C. Reprint from [64] with permission.
Figure 7
Figure 7
Schematic layout of the planar (a) and vertical (b) surface ionization device.
Figure 8
Figure 8
Dynamic response of a surface ionization device with planar layout, based on CuO nanowires to acetone (a) and ethanol (b).
Figure 9
Figure 9
(a) SEM image of ZnO NWs; (b) Photoluminescence (PL) spectrum is acquired perpendicular to the sample surface by a single spectrograph and a CCD camera. The excitation wavelength is 325 nm (He-Cd laser). A sealed chamber is used for gas tests.
Figure 10
Figure 10
(a) Photoluminescence (PL) spectrum of ZnO NWs with ultraviolet Near Band Edge (NBE) and visible emission; (b) PL optical response to 5 ppm nitrogen dioxide gas.
Figure 11
Figure 11
(a) Sketch of the sensing device; (b) SEM image of ZnO NRs surface; (c) Scheme of MOKE readout for gas sensing application.
Figure 12
Figure 12
Sensor response of the magneto-optical gas sensor to H2 and CO concentration (200-300-400 ppm) in dry synthetic air. Measurements are carried out at room temperature.
Figure 13
Figure 13
Scheme of multisensor chip for gas detection merging electrical, optical, magnetic, surface ionization sensing.
Figure 14
Figure 14
Images of S3-mini (left) and S3-micro (right) developed by SENSOR Lab (courtesy of NASYS SRL).
Figure 15
Figure 15
Calibration curves acquired with chemiresistors based on SnO2 RGTO thin film (a) and nanowire (b) mounted in the EN against ethanol and acetone.
Figure 16
Figure 16
PCA score pot of the analysis carried out on samples belonging the three different individuals’ microbiota.
Figure 17
Figure 17
(a) PCA score plot of EN patters of samples not contaminated (NC) and contaminated by E. hormaechei detected in 24 h; (b) PCA score plot of EN patters of samples not contaminated (NC) and contaminated by E. hormaechei incubated for 6 h to 20 h (zoom of previous PCA reported in Figure (a)). Reprint from [120], copyright (2014) with permission from Elsevier.
Figure 18
Figure 18
(a) plot of the sensor 2611 EOS units against the sample incubation time from 6 h to 24 h. C and NC samples are labelled in different ways (dots vs. crosses); (b) plot of the sensor 2611 EOS units as a function of the inoculum concentration (only C samples incubated for 24 h). Reprint from [120], copyright (2014) with permission from Elsevier.

References

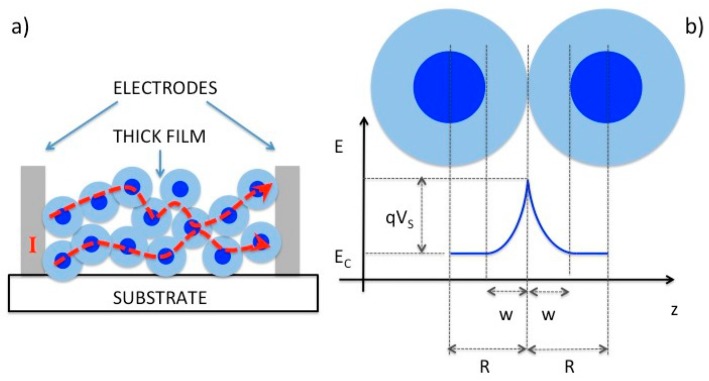
    1. Barsan N., Weimar U. Conduction model of metal oxide gas sensors. J. Electroceram. 2001;7:143–167. doi: 10.1023/A:1014405811371. - DOI
    1. Rock F., Barsan N., Weimar U. Electronic nose: Current status and future trends. Chem. Rev. 2008;108:705–725. doi: 10.1021/cr068121q. - DOI - PubMed
    1. Lee A.P., Reedy B.J. Temperature modulation in semiconductor gas sensing. Sens. Actuators B Chem. 1999;60:35–42. doi: 10.1016/S0925-4005(99)00241-5. - DOI
    1. Potyrailo R.A. Multivariable Sensors for Ubiquitous Monitoring of Gases in the Era of Internet of Things and Industrial Internet. Chem. Rev. 2016;116:11877–11923. doi: 10.1021/acs.chemrev.6b00187. - DOI - PubMed
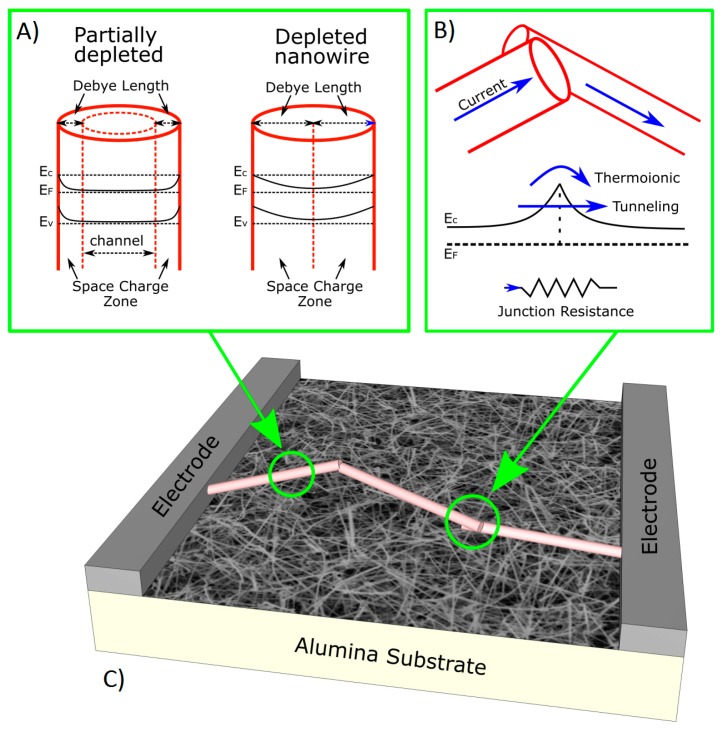
    1. Michelle J.S.S. Gas sensing applications of 1D-nanostructured zinc oxide: Insights from density functional theory calculations. Prog. Mater. Sci. 2012;57:437–486.