

Quantitative Adverse Outcome Pathways and Their Application to Predictive Toxicology
- PMID: 28355063
- PMCID: PMC6134852
- DOI: 10.1021/acs.est.6b06230
Quantitative Adverse Outcome Pathways and Their Application to Predictive Toxicology
Abstract
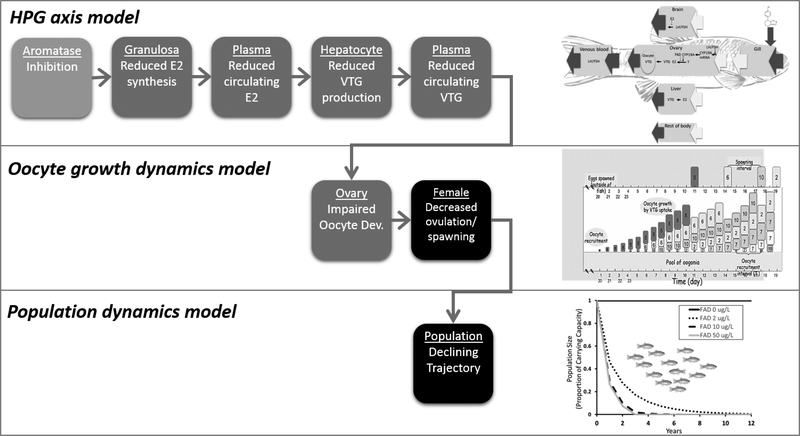
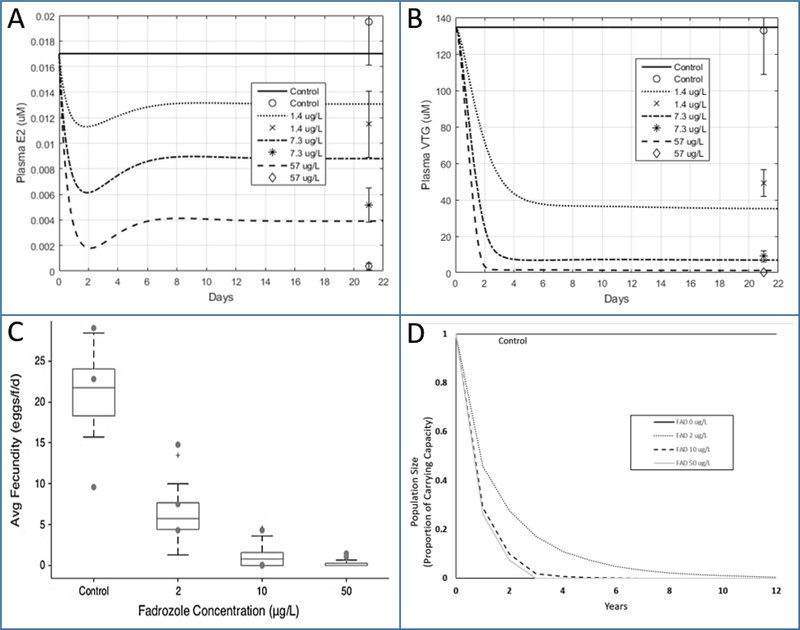
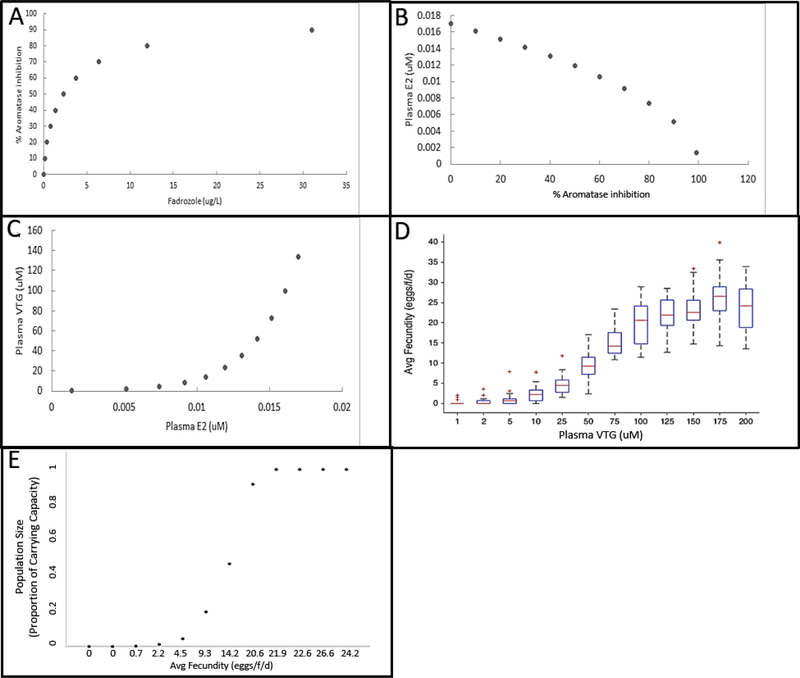
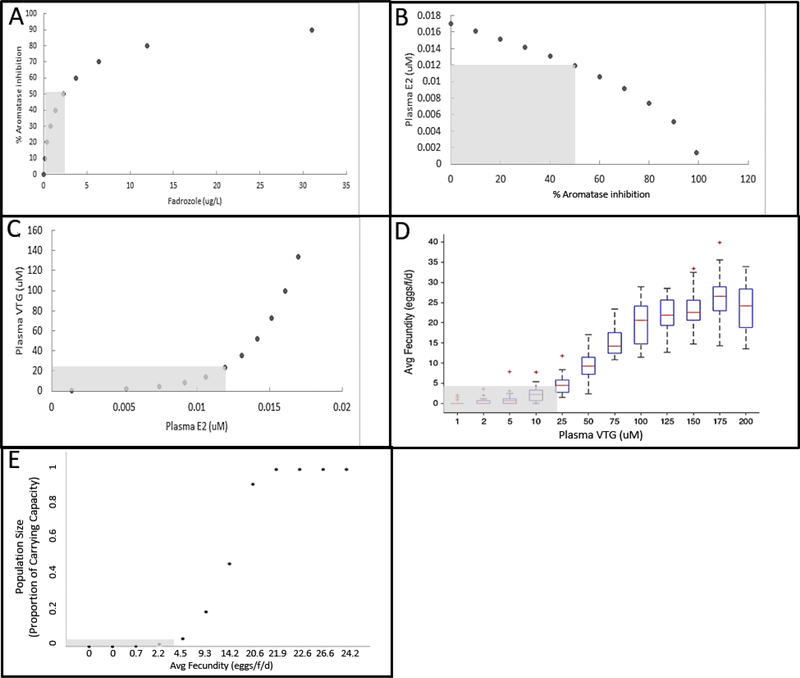
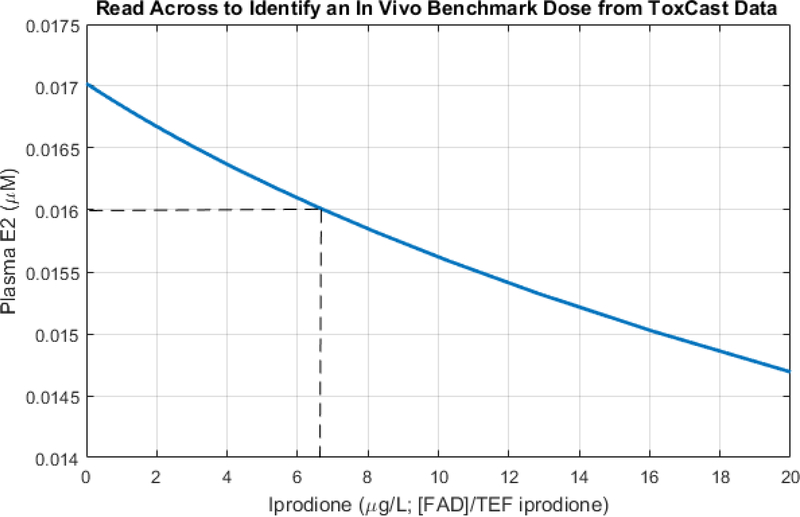
A quantitative adverse outcome pathway (qAOP) consists of one or more biologically based, computational models describing key event relationships linking a molecular initiating event (MIE) to an adverse outcome. A qAOP provides quantitative, dose-response, and time-course predictions that can support regulatory decision-making. Herein we describe several facets of qAOPs, including (a) motivation for development, (b) technical considerations, (c) evaluation of confidence, and (d) potential applications. The qAOP used as an illustrative example for these points describes the linkage between inhibition of cytochrome P450 19A aromatase (the MIE) and population-level decreases in the fathead minnow (FHM; Pimephales promelas). The qAOP consists of three linked computational models for the following: (a) the hypothalamic-pitutitary-gonadal axis in female FHMs, where aromatase inhibition decreases the conversion of testosterone to 17β-estradiol (E2), thereby reducing E2-dependent vitellogenin (VTG; egg yolk protein precursor) synthesis, (b) VTG-dependent egg development and spawning (fecundity), and (c) fecundity-dependent population trajectory. While development of the example qAOP was based on experiments with FHMs exposed to the aromatase inhibitor fadrozole, we also show how a toxic equivalence (TEQ) calculation allows use of the qAOP to predict effects of another, untested aromatase inhibitor, iprodione. While qAOP development can be resource-intensive, the quantitative predictions obtained, and TEQ-based application to multiple chemicals, may be sufficient to justify the cost for some applications in regulatory decision-making.
Figures
References
-
- National Research Council. 2007. Toxicity Testing in the 21st Century: A Vision and a Strategy. Washington, DC: The National Academies Press; DOI 10.17226/11970. - DOI
-
- Krewski D; Acosta D Jr.; Andersen M; Anderson H; Bailar JC 3rd; Boekelheide K; Brent R; Charnley G; Cheung VG; Green S Jr.; Kelsey KT; Kerkvliet NI; Li AA; McCray L; Meyer O; Patterson RD; Pennie W; Scala RA; Solomon GM; Stephens M; Yager J; Zeise L Toxicity testing in the 21st century: A vision and a strategy. J. Toxicol. Environ. Health B Crit. Rev 2010, 13, 51138. - PMC - PubMed
-
- Ankley GT; Bennett RS; Erickson RJ; Hoff DJ; Hornung MW; Johnson RD; Mount DR; Nichoils JW; Russom CL; Schmieder PK; Serrano JA; Tietge JE; Villeneuve DL 2010. Adverse outcome pathways: A conceptual framework to support ecotoxicology research and risk assessment. Environ. Toxicol. Chem 2010, 29, 730–741. - PubMed
-
- Organization for Economic Co-operation and Development. 2016. Users’ Handbook supplement to the Guidance Document for developing and assessing Adverse Outcome Pathways, OECD Series on Adverse Outcome Pathways, No. 1, OECD Publishing, Paris: DOI 10.1787/5jlv1m9d1g32-en. - DOI
MeSH terms
Substances
Grants and funding
LinkOut - more resources
Full Text Sources
Other Literature Sources
